Attached files
| file | filename |
|---|---|
| 8-K - FORM 8-K - TRANSATLANTIC PETROLEUM LTD. | v370453_8-k.htm |
March 4, 2014 SPECIAL SHAREHOLDERS MEETING

FORWARD LOOKING STATEMENTS Outlooks, projections, estimates, targets and business plans in this presentation or any related subsequent discussions are forward - looking statements . Actual future results, including TransAtlantic Petroleum Ltd . ’s own production growth and mix ; financial results ; the amount and mix of capital expenditures ; resource additions and recoveries ; finding and development costs ; project and drilling plans, timing, costs, and capacities ; revenue enhancements and cost efficiencies ; industry margins ; margin enhancements and integration benefits ; and the impact of technology could differ materially due to a number of factors . These include market prices for natural gas, natural gas liquids and oil products ; estimates of reserves and economic assumptions ; the ability to produce and transport natural gas, natural gas liquids and oil ; the results of exploration and development drilling and related activities ; economic conditions in the countries and provinces in which we carry on business, especially economic slowdowns ; actions by governmental authorities, receipt of required approvals, increases in taxes, legislative and regulatory initiatives relating to fracture stimulation activities, changes in environmental and other regulations, and renegotiations of contracts ; political uncertainty, including actions by insurgent groups or other conflict ; the negotiation and closing of material contracts ; shortages of drilling rigs, equipment or oilfield services ; and other factors discussed here and under the heading “Risk Factors" in our Annual Report on Form 10 - K for the year ended December 31 , 2012 and our Quarterly Report on Form 10 - Q for the three and nine months ended September 30 , 2013 , which are available on our website at www . transatlanticpetroleum . com and www . sec . gov . See also TransAtlantic’s audited financial statements and the accompanying management discussion and analysis . Forward - looking statements are based on management’s knowledge and reasonable expectations on the date hereof, and we assume no duty to update these statements as of any future date . The information set forth in this presentation does not constitute an offer, solicitation or recommendation to sell or an offer to buy any securities of the Company . The information published herein is provided for informational purposes only . The Company makes no representation that the information and opinions expressed herein are accurate, complete or current . The information contained herein is current as of the date hereof, but may become outdated or subsequently may change . Nothing contained herein constitutes financial, legal, tax, or other advice . The SEC has generally permitted oil and gas companies, in their filings with the SEC, to disclose only proved reserves that a company has demonstrated by actual production or conclusive formation tests to be economically and legally producible under existing economic and operating conditions . We may use the terms “estimated ultimate recovery,” “EUR,” “probable,” “possible,” and “non - proven” reserves, “prospective resources” or “upside” or other descriptions of volumes of resources or reserves potentially recoverable through additional drilling or recovery techniques that the SEC’s guidelines may prohibit us from including in filings with the SEC . These estimates are by their nature more speculative than estimates of proved reserves and accordingly are subject to substantially greater risk of actually being realized by the Company . There is no certainty that any portion of estimated prospective resources will be discovered . If discovered, there is no certainty that it will be commercially viable to produce any portion of the estimated prospective resources . Note on Possible Reserves : possible r eserves are those additional reserves that are less certain to be recovered than probably reserves . There is a 10 % probability that the quantities actually recovered will equal or exceed the sum of proved plus probable plus possible reserves . Note on BOE : BOE (barrel of oil equivalent) is derived by converting natural gas to oil in the ratio of six thousand cubic feet (Mcf) of natural gas to one barrel (bbl) of oil . BOE may be misleading, particularly if used in isolation . A BOE conversion ratio of 6 Mcf : 1 bbl is based on an energy equivalency conversion method primarily applicable at the burner tip and does not represent a value equivalency at the wellhead . 2

WELCOME • Increased reserves and production in 2013; Fourth quarter results within two weeks • 2014 capital plan is focused on sweet spots in Turkey • Newly acquired 3D seismic expected to generate Göksu and Bahar offsets • Bulgaria results will be announced post - completion 3

4 2013 RESERVES GROWTH Reserves Summary Increased Reserves in 2013 • Increased PDP reserves 12% to 5.7 MMBoe, PV - 10 +$50 million to $327 million ($0.88/share) • Increased 1P reserves 6% to 12.2 MMBoe, PV - 10 +$29 million to $593 million ($1.59/share) • Increased 2P reserves 12% to 24.2 MMBoe, PV - 10 +$74 million to $1.1 billion Expect Reserves Increases in 2014 • Şelmo horizontal drilling and waterflood pilot projects • Molla Seismic evaluation; Bahar and Göksu field development • Arpatepe drilling and waterflood project • Thrace recompletions and horizontal drilling in Mezardere and Teslimkoy
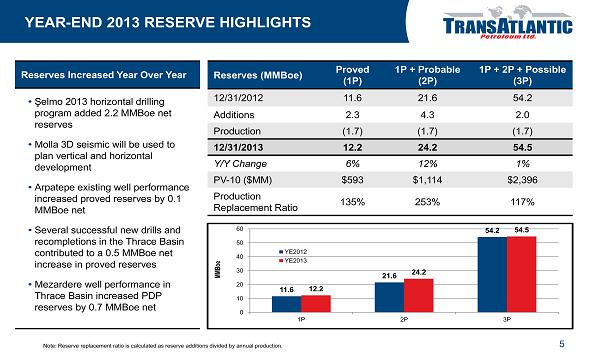
11.6 21.6 54.2 12.2 24.2 54.5 0 10 20 30 40 50 60 1P 2P 3P MMBoe YE2012 YE2013 YEAR - END 2013 RESERVE HIGHLIGHTS 5 Reserves (MMBoe) Proved (1P) 1P + Probable ( 2P) 1P + 2P + Possible ( 3P) 12/31/2012 11.6 21.6 54.2 Additions 2.3 4.3 2.0 Production (1.7) (1.7) (1.7) 12/31/2013 12.2 24.2 54.5 Y/Y Change 6% 12% 1% PV - 10 ($MM) $593 $1,114 $2,396 Production Replacement Ratio 135% 253% 117% Reserves Increased Year Over Year • Ş elmo 2013 horizontal drilling program added 2.2 MMBoe net reserves • Molla 3D seismic will be used to plan vertical and horizontal development • Arpatepe existing well performance increased proved reserves by 0.1 MMBoe net • Several successful new drills and recompletions in the Thrace Basin contributed to a 0.5 MMBoe net increase in proved reserves • Mezardere well performance in Thrace Basin increased PDP reserves by 0.7 MMBoe net Note: Reserve replacement ratio is calculated as reserve additions divided by annual production.

NET PRESENT VALUE OF RESERVES PER SHARE 6 $US/Share 373.8MM total shares at 12/31/2013 12/31/2013 Discounted at: 0% 10% PDP $ 1.17 $0.88 PDNP $ 0.14 $ 0.10 PUD $ 0.88 $ 0.61 Total 1P Reserves $2.19 $1.59 SEC Pricing 12/31/2013 12/31/2012 Crude ($US/Bbl) $102.07 $108.30 Natural Gas ($US/Mcf) $9.92 $8.94

2014 CAPEX ALLOCATION 7 $MM Net Proved Probable Possible Exploration Facilities Seismic Total Capex Ş elmo 27.0 - - 4.0 1.0 - $32.0 Thrace 6.0 0.5 - 1.8 - - $8.3 Molla 6.0 24.3 - 7.3 3.2 3.0 $43.8 Other 1.8 - - 2.1 0.5 - $4.4 Total Capex $40.8 $24.8 - $15.2 $4.7 $3.0 $88.5 Note: TransAtlantic will adjust its 2014 capital expenditures based on pending 3D seismic interpretation and drilling results. Actu al expenditures are likely to deviate from the initial plan according to seismic interpretation, drilling results, commodity prices and cash flow. Ş elmo Field operations in southeastern Turkey. Oba - 1 well operations in southeastern Turkey.

2014 Expected Well Counts Molla Area Arpatepe Field Selmo Field Thrace Basin Bulgaria 1 Total Horizontal Vertical 7 – 10 2 – 4 – 1 – 2 9 – 11 – 6 – 10 8 – 12 – – 23 – 33 10 – 16 Total 9 – 14 1 – 2 9 – 11 14 – 22 – 33 – 49 2014 PLANNED DRILL WELLS 8 Drilling rig on location in the Thrace Basin. 1 Bulgaria capital expenditures are pending results from the Deventci - R2 well. Note : Well count based on spud date. TransAtlantic will adjust its 2014 capital expenditures based on pending 3D seismic interpretation and drilling results . Actual expenditures are likely to deviate from the initial plan according to seismic interpretation, drilling results, commod ity prices and cash flow. Expected year - end production rate is 6,000 – 6,500 BOED.

9 WHAT ARE THE TARGETS? Potential Well Economics For Successful Wells in Southeastern Turkey Bahar Field • Vertical well costs ~$4.0 million - EUR 400 MBo - NPV (Discounted at 10%) $19.3 million • Horizontal well costs ~$9.0 million - EUR 1.4 MMBo - NPV (Discounted at 10%) $62.0 million Göksu Field • Horizontal well costs ~$2.5 million - EUR 307 MBo - NPV (Discounted at 10%) $16.3 million Şelmo Field • Horizontal well costs ~$2.5 million EUR - EUR 522 MBo - NPV (Discounted at 10%) $26.2 million Bahar - 1 well in the Molla area in southeastern Turkey. Note: There can be no assurance that TransAtlantic will achieve estimated well costs, recoveries, production targets or commodity prices, and actual results may differ substantially from these estimates. Please see “Forward Looking Statements” on slide 2 of this presentation.

MOLLA AREA DEVELOPMENT PLAN 10 • E xpect newly acquired Molla 3D seismic to mitigate exploration risk and increase success of multiple reservoir development Bahar Bostanpinar Kastel Arpatepe Molla Goksu Molla 3D Surface Area Arpatepe 3D Surface Area 5046 4845 4174 5025 5003 km2 mile2 1 1 4239 Altinakar Karakilise

MOLLA AREA DEVELOPMENT PLAN, CONTINUED 11 • The “breaks in the clouds” below represent faults that may contain trapped hydrocarbons; we intend to map each section in detail to assess its potential • No reserves of any classification have been booked for any of this area, save the immediate area of Bahar and Çatak wells Molla 3D – Phase I – PSTM: Dip of Maximum Similarity (attribute time - slice display @ 1.536 seconds) Bahar Bostanpinar 5046 4845 km2 mile2 1 1 Faults Faults Ç atak - 1

12 Bahar Vertical Type Well Investment $4.0 MM IP Rate 450 BOD EUR 400 MBO IRR 268% NPV (Discounted at 10%) $19.3 MM Years to Payout 0.5 years Discounted ROI 8.0x Oil Price Assumed $103/Bbl Note: Actual production through January 2014. First production 9 /2012. Cumulative production of 100,000 BO through 1/31/2014. BAHAR RESULTS AND PROJECTION 1 10 100 1,000 Oct-12 Sep-13 Aug-14 Jul-15 Jun-16 May-17 Apr-18 Mar-19 Oil (BOD) Bahar - 1 Gross Production Curve Note: There can be no assurance that TransAtlantic will achieve estimated well costs, recoveries, production targets or commo dit y prices, and actual results may differ substantially from these estimates. Please see “Forward Looking Statements” on slide 2 of this presentation.

13 Göksu Horizontal Type Well Investment $2.5 MM IP Rate 400 BOD EUR 307 MBO IRR 751% NPV (Discounted at 10%) $16.3 MM Years to Payout 0.3 years Discounted ROI 7.6x Oil Price Assumed $92/Bbl GÖKSU RESULTS AND PROJECTION 1 10 100 1,000 Nov-12 Nov-13 Nov-14 Nov-15 Nov-16 Nov-17 Nov-18 Oil (BOD) Göksu - 3H Gross Production Curve Note: Actual production through January 2014. First production 10/2012. Cumulative production of 145,000 BO through 1/31/2014. Note: There can be no assurance that TransAtlantic will achieve estimated well costs, recoveries, production targets or commo dit y prices, and actual results may differ substantially from these estimates. Please see “Forward Looking Statements” on slide 2 of this presentation.

14 MOLLA AREA NEXT STEPS Action Plan For Molla Area 3D Seismic • Map each structure in detail based on new data • Plan to s hoot final phase (incl. Goksu Field) in April/May • Expect to c omplete processing by late summer 2014 Drill Wells • Plan to d rill at least two vertical wells in the Bahar Field to confirm geology • Expect to follow with two - four horizontal wells in Bahar Field • Plan to drill three - six Goksu horizontal wells in 2H 2014, pending 3D seismic data

Ş ELMO FIELD DEVELOPMENT PLAN 15 • Each planned horizontal well (in white) may add PUD locations (in red) and increase proved reserves; some may add probable, possible reserves as well

16 Ş ELMO RESULTS AND PROJECTION Ş elmo Horizontal Type Well Investment $2.5 MM IP Rate 300 BOD EUR 522 MBO IRR 564% NPV (Discounted at 10%) $26.2 MM Years to Payout 0.3 years Discounted ROI 11.5x Oil Price Assumed $103/Bbl 1 10 100 1,000 Dec-13 Nov-14 Oct-15 Sep-16 Aug-17 Jul-18 Jun-19 Oil (BOD) Şelmo - 22H2 Gross Oil Production Curve Note: Actual production through January 2014. First production 12/2013. Cumulative production of 24,000 BO through 1/31/2014. Note: There can be no assurance that TransAtlantic will achieve estimated well costs, recoveries, production targets or commo dit y prices, and actual results may differ substantially from these estimates. Please see “Forward Looking Statements” on slide 2 of this presentation.

THRACE BASIN DEVELOPMENT PLAN 17 • Future proved reserve potential from horizontal drilling in the Mezardere and Teslimkoy formations (probable, possible locations) and improved overall well performance Mezardere Development Teslimkoy Development Gas flare in the Thrace Basin in northwestern Turkey.

BULGARIA EXPLORATION 18 Status in Bulgaria • Deventci - R2 well is currently being completed • At 12/31/2013, TransAtlantic had no reserves booked in Bulgaria ; e xpect to establish reserves at 12/31/2014 Deventci - R2 well in Bulgaria. Deventci - R2 well and surrounding area in Bulgaria.
WELCOME • Increased reserves and production in 2013; Fourth quarter results within two weeks • 2014 capital plan is focused on sweet spots in Turkey • Newly acquired 3D seismic expected to generate Göksu and Bahar offsets • Bulgaria results will be announced post - completion 19

CONTACT INFORMATION Taylor B. Miele Director of Investor Relations (214) 265 - 4746 taylor.miele@tapcor.com Ian J. Delahunty President (214) 265 - 4780 ian.delahunty@tapcor.com 20

PV - 10 RECONCILIATION 21 The PV - 10 value of the estimated future net revenue are not intended to represent the current market value of the estimated oil and natural gas reserves we own. Management believes that the presentation of PV - 10, while not a financial measure in accordance with U.S. GAAP, provides useful information to investors because it is widely used by professional analysts and sophisticated investors in evaluating oil and natural gas companies. Because many factors that are unique to each individual company impact the amount of future income taxes estimated to be paid, the use of a pre - tax measure is valuable when comparing companies based on reserves. PV - 10 is not a measure of financial or operating performance under U.S. GAAP. PV - 10 should not be considered as an alternative to the standardized measure as defined under U.S. GAAP. The following table provides a reconciliation of our PV - 10 to our standardized measure: $US millions Total PV - 10: $592.5 Future income taxes: (122.9) 1 Discount of future income taxes at 10% per annum: 30.9 1 Standardized measure: $500.5 Note: Final PV - 10 reconciliation will be appear in the Company’s annual report on Form 10 - K. 1 TransAtlantic Petroleum is not a U.S. domiciled corporation.