Attached files
| file | filename |
|---|---|
| 8-K - CURRENT REPORT OF MATERIAL EVENTS OR CORPORATE CHANGES - Hilltop Holdings Inc. | a14-7266_28k.htm |
Exhibit 99.1
|
|
Hilltop Holdings Inc. Q4 2013 Earnings Presentation Investor Presentation | March 4, 2014 |

|
|
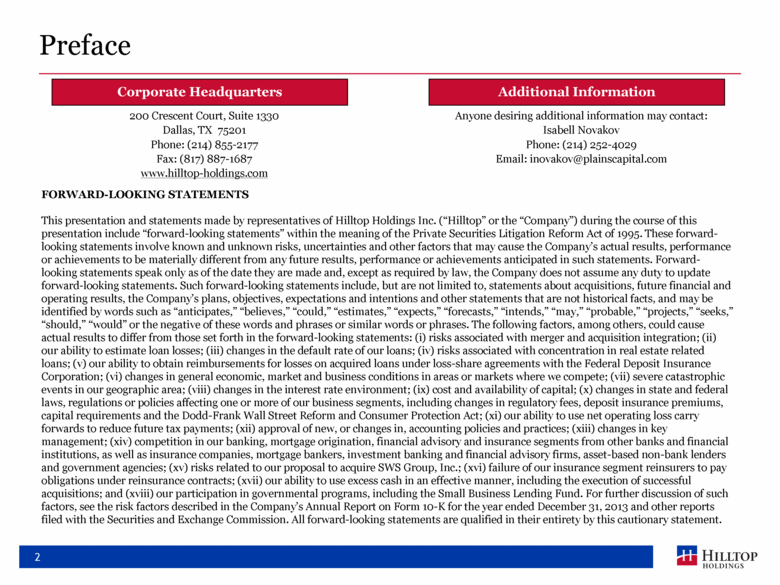
Preface 2 200 Crescent Court, Suite 1330 Dallas, TX 75201 Phone: (214) 855-2177 Fax: (817) 887-1687 www.hilltop-holdings.com Anyone desiring additional information may contact: Isabell Novakov Phone: (214) 252-4029 Email: inovakov@plainscapital.com FORWARD-LOOKING STATEMENTS This presentation and statements made by representatives of Hilltop Holdings Inc. (“Hilltop” or the “Company”) during the course of this presentation include “forward-looking statements” within the meaning of the Private Securities Litigation Reform Act of 1995. These forward-looking statements involve known and unknown risks, uncertainties and other factors that may cause the Company’s actual results, performance or achievements to be materially different from any future results, performance or achievements anticipated in such statements. Forward-looking statements speak only as of the date they are made and, except as required by law, the Company does not assume any duty to update forward-looking statements. Such forward-looking statements include, but are not limited to, statements about acquisitions, future financial and operating results, the Company’s plans, objectives, expectations and intentions and other statements that are not historical facts, and may be identified by words such as “anticipates,” “believes,” “could,” “estimates,” “expects,” “forecasts,” “intends,” “may,” “probable,” “projects,” “seeks,” “should,” “would” or the negative of these words and phrases or similar words or phrases. The following factors, among others, could cause actual results to differ from those set forth in the forward-looking statements: (i) risks associated with merger and acquisition integration; (ii) our ability to estimate loan losses; (iii) changes in the default rate of our loans; (iv) risks associated with concentration in real estate related loans; (v) our ability to obtain reimbursements for losses on acquired loans under loss-share agreements with the Federal Deposit Insurance Corporation; (vi) changes in general economic, market and business conditions in areas or markets where we compete; (vii) severe catastrophic events in our geographic area; (viii) changes in the interest rate environment; (ix) cost and availability of capital; (x) changes in state and federal laws, regulations or policies affecting one or more of our business segments, including changes in regulatory fees, deposit insurance premiums, capital requirements and the Dodd-Frank Wall Street Reform and Consumer Protection Act; (xi) our ability to use net operating loss carry forwards to reduce future tax payments; (xii) approval of new, or changes in, accounting policies and practices; (xiii) changes in key management; (xiv) competition in our banking, mortgage origination, financial advisory and insurance segments from other banks and financial institutions, as well as insurance companies, mortgage bankers, investment banking and financial advisory firms, asset-based non-bank lenders and government agencies; (xv) risks related to our proposal to acquire SWS Group, Inc.; (xvi) failure of our insurance segment reinsurers to pay obligations under reinsurance contracts; (xvii) our ability to use excess cash in an effective manner, including the execution of successful acquisitions; and (xviii) our participation in governmental programs, including the Small Business Lending Fund. For further discussion of such factors, see the risk factors described in the Company’s Annual Report on Form 10-K for the year ended December 31, 2013 and other reports filed with the Securities and Exchange Commission. All forward-looking statements are qualified in their entirety by this cautionary statement. Corporate Headquarters Additional Information |
|
|
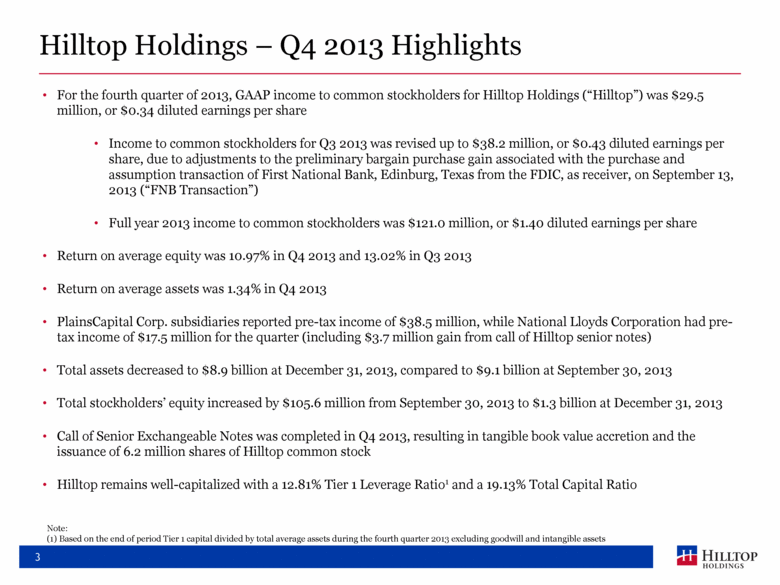
3 Hilltop Holdings – Q4 2013 Highlights For the fourth quarter of 2013, GAAP income to common stockholders for Hilltop Holdings (“Hilltop”) was $29.5 million, or $0.34 diluted earnings per share Income to common stockholders for Q3 2013 was revised up to $38.2 million, or $0.43 diluted earnings per share, due to adjustments to the preliminary bargain purchase gain associated with the purchase and assumption transaction of First National Bank, Edinburg, Texas from the FDIC, as receiver, on September 13, 2013 (“FNB Transaction”) Full year 2013 income to common stockholders was $121.0 million, or $1.40 diluted earnings per share Return on average equity was 10.97% in Q4 2013 and 13.02% in Q3 2013 Return on average assets was 1.34% in Q4 2013 PlainsCapital Corp. subsidiaries reported pre-tax income of $38.5 million, while National Lloyds Corporation had pre-tax income of $17.5 million for the quarter (including $3.7 million gain from call of Hilltop senior notes) Total assets decreased to $8.9 billion at December 31, 2013, compared to $9.1 billion at September 30, 2013 Total stockholders’ equity increased by $105.6 million from September 30, 2013 to $1.3 billion at December 31, 2013 Call of Senior Exchangeable Notes was completed in Q4 2013, resulting in tangible book value accretion and the issuance of 6.2 million shares of Hilltop common stock Hilltop remains well-capitalized with a 12.81% Tier 1 Leverage Ratio1 and a 19.13% Total Capital Ratio Note: (1) Based on the end of period Tier 1 capital divided by total average assets during the fourth quarter 2013 excluding goodwill and intangible assets |
|
|
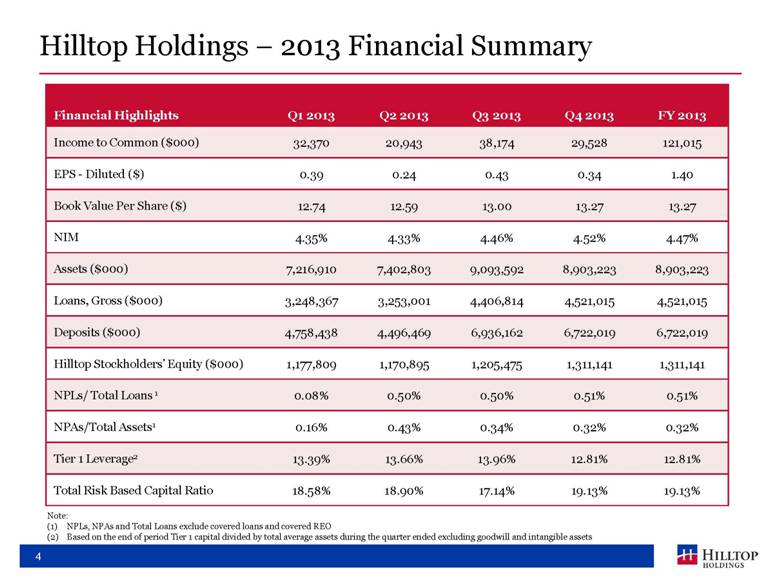
4 Hilltop Holdings – 2013 Financial Summary Financial Highlights Q1 2013 Q2 2013 Q3 2013 Q4 2013 FY 2013 Income to Common ($000) 32,370 20,943 38,174 29,528 121,015 EPS - Diluted ($) 0.39 0.24 0.43 0.34 1.40 Book Value Per Share ($) 12.74 12.59 13.00 13.27 13.27 NIM 4.35% 4.33% 4.46% 4.52% 4.47% Assets ($000) 7,216,910 7,402,803 9,093,592 8,903,223 8,903,223 Loans, Gross ($000) 3,248,367 3,253,001 4,406,814 4,521,015 4,521,015 Deposits ($000) 4,758,438 4,496,469 6,936,162 6,722,019 6,722,019 Hilltop Stockholders’ Equity ($000) 1,177,809 1,170,895 1,205,475 1,311,141 1,311,141 NPLs/ Total Loans 1 0.08% 0.50% 0.50% 0.51% 0.51% NPAs/Total Assets1 0.16% 0.43% 0.34% 0.32% 0.32% Tier 1 Leverage2 13.39% 13.66% 13.96% 12.81% 12.81% Total Risk Based Capital Ratio 18.58% 18.90% 17.14% 19.13% 19.13% Note: NPLs, NPAs and Total Loans exclude covered loans and covered REO Based on the end of period Tier 1 capital divided by total average assets during the quarter ended excluding goodwill and intangible assets |
|
|
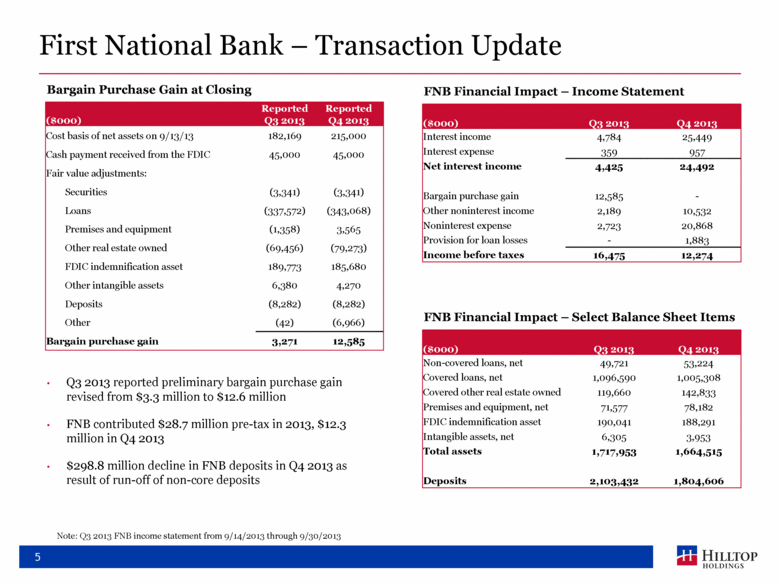
First National Bank – Transaction Update 5 Bargain Purchase Gain at Closing ($000) Q3 2013 Q4 2013 Interest income 4,784 25,449 Interest expense 359 957 Net interest income 4,425 24,492 Bargain purchase gain 12,585 - Other noninterest income 2,189 10,532 Noninterest expense 2,723 20,868 Provision for loan losses - 1,883 Income before taxes 16,475 12,274 FNB Financial Impact – Income Statement Q3 2013 reported preliminary bargain purchase gain revised from $3.3 million to $12.6 million FNB contributed $28.7 million pre-tax in 2013, $12.3 million in Q4 2013 $298.8 million decline in FNB deposits in Q4 2013 as result of run-off of non-core deposits Reported Reported ($000) Q3 2013 Q4 2013 Cost basis of net assets on 9/13/13 182,169 215,000 Cash payment received from the FDIC 45,000 45,000 Fair value adjustments: Securities (3,341) (3,341) Loans (337,572) (343,068) Premises and equipment (1,358) 3,565 Other real estate owned (69,456) (79,273) FDIC indemnification asset 189,773 185,680 Other intangible assets 6,380 4,270 Deposits (8,282) (8,282) Other (42) (6,966) Bargain purchase gain 3,271 12,585 ($000) Q3 2013 Q4 2013 Non-covered loans, net 49,721 53,224 Covered loans, net 1,096,590 1,005,308 Covered other real estate owned 119,660 142,833 Premises and equipment, net 71,577 78,182 FDIC indemnification asset 190,041 188,291 Intangible assets, net 6,305 3,953 Total assets 1,717,953 1,664,515 Deposits 2,103,432 1,804,606 FNB Financial Impact – Select Balance Sheet Items Note: Q3 2013 FNB income statement from 9/14/2013 through 9/30/2013 |
|
|
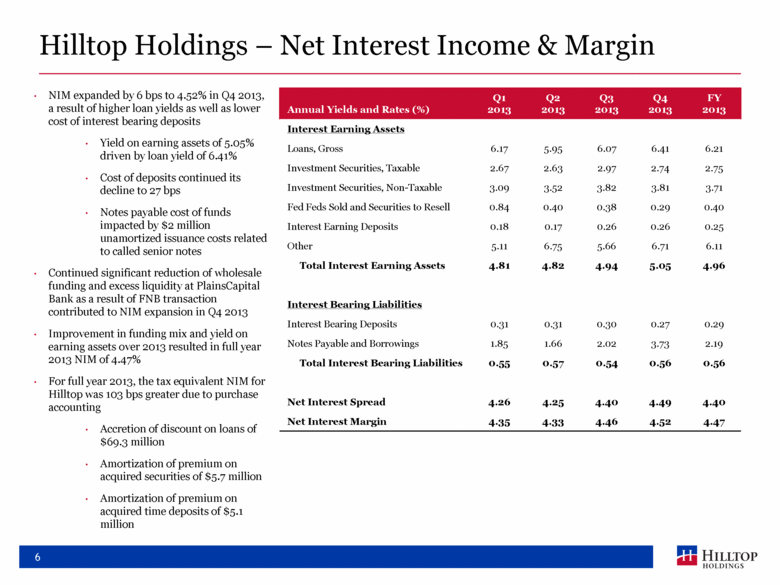
6 Hilltop Holdings – Net Interest Income & Margin NIM expanded by 6 bps to 4.52% in Q4 2013, a result of higher loan yields as well as lower cost of interest bearing deposits Yield on earning assets of 5.05% driven by loan yield of 6.41% Cost of deposits continued its decline to 27 bps Notes payable cost of funds impacted by $2 million unamortized issuance costs related to called senior notes Continued significant reduction of wholesale funding and excess liquidity at PlainsCapital Bank as a result of FNB transaction contributed to NIM expansion in Q4 2013 Improvement in funding mix and yield on earning assets over 2013 resulted in full year 2013 NIM of 4.47% For full year 2013, the tax equivalent NIM for Hilltop was 103 bps greater due to purchase accounting Accretion of discount on loans of $69.3 million Amortization of premium on acquired securities of $5.7 million Amortization of premium on acquired time deposits of $5.1 million Annual Yields and Rates (%) Q1 2013 Q2 2013 Q3 2013 Q4 2013 FY 2013 Interest Earning Assets Loans, Gross 6.17 5.95 6.07 6.41 6.21 Investment Securities, Taxable 2.67 2.63 2.97 2.74 2.75 Investment Securities, Non-Taxable 3.09 3.52 3.82 3.81 3.71 Fed Feds Sold and Securities to Resell 0.84 0.40 0.38 0.29 0.40 Interest Earning Deposits 0.18 0.17 0.26 0.26 0.25 Other 5.11 6.75 5.66 6.71 6.11 Total Interest Earning Assets 4.81 4.82 4.94 5.05 4.96 Interest Bearing Liabilities Interest Bearing Deposits 0.31 0.31 0.30 0.27 0.29 Notes Payable and Borrowings 1.85 1.66 2.02 3.73 2.19 Total Interest Bearing Liabilities 0.55 0.57 0.54 0.56 0.56 Net Interest Spread 4.26 4.25 4.40 4.49 4.40 Net Interest Margin 4.35 4.33 4.46 4.52 4.47 |
|
|
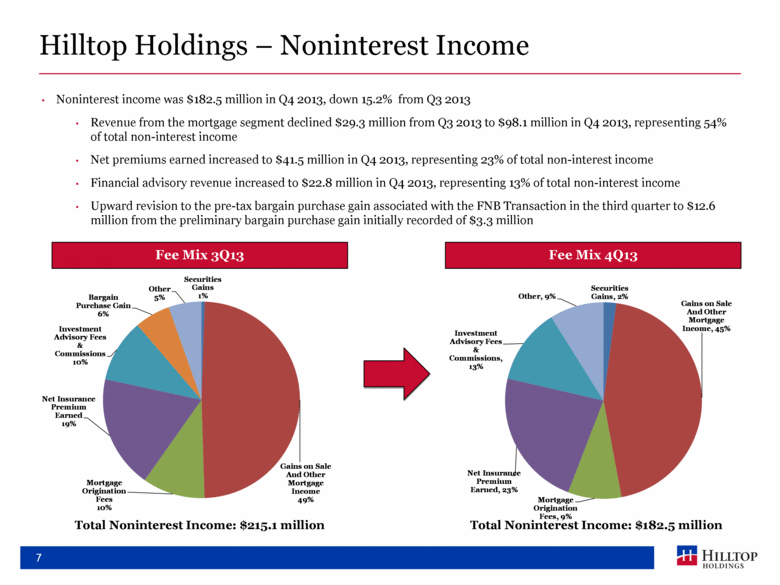
7 Hilltop Holdings – Noninterest Income Noninterest income was $182.5 million in Q4 2013, down 15.2% from Q3 2013 Revenue from the mortgage segment declined $29.3 million from Q3 2013 to $98.1 million in Q4 2013, representing 54% of total non-interest income Net premiums earned increased to $41.5 million in Q4 2013, representing 23% of total non-interest income Financial advisory revenue increased to $22.8 million in Q4 2013, representing 13% of total non-interest income Upward revision to the pre-tax bargain purchase gain associated with the FNB Transaction in the third quarter to $12.6 million from the preliminary bargain purchase gain initially recorded of $3.3 million Fee Mix 3Q13 Total Noninterest Income: $215.1 million Fee Mix 4Q13 Total Noninterest Income: $182.5 million Securities Gains, 2% Gains on Sale And Other Mortgage Income, 45% Mortgage Origination Fees, 9% Net Insurance Premium Earned, 23% Investment Advisory Fees & Commissions, 13% Other, 9% |
|
|
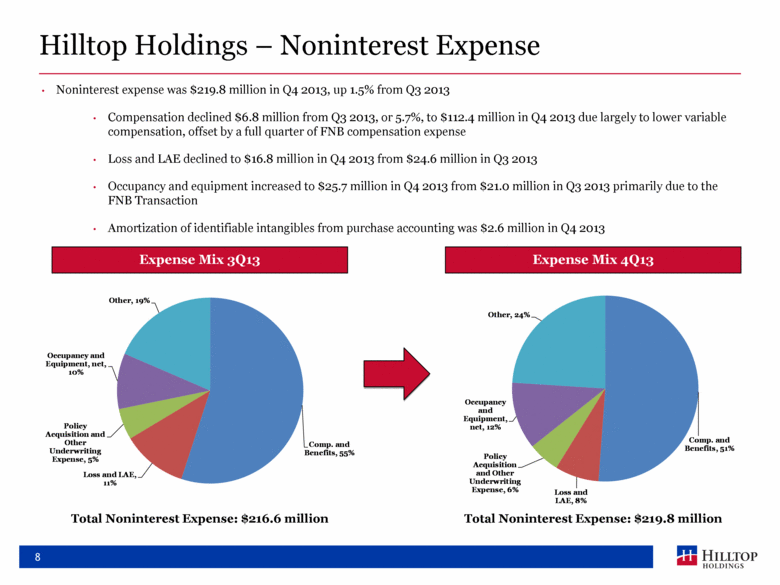
8 Hilltop Holdings – Noninterest Expense Noninterest expense was $219.8 million in Q4 2013, up 1.5% from Q3 2013 Compensation declined $6.8 million from Q3 2013, or 5.7%, to $112.4 million in Q4 2013 due largely to lower variable compensation, offset by a full quarter of FNB compensation expense Loss and LAE declined to $16.8 million in Q4 2013 from $24.6 million in Q3 2013 Occupancy and equipment increased to $25.7 million in Q4 2013 from $21.0 million in Q3 2013 primarily due to the FNB Transaction Amortization of identifiable intangibles from purchase accounting was $2.6 million in Q4 2013 Total Noninterest Expense: $216.6 million Total Noninterest Expense: $219.8 million Expense Mix 3Q13 Expense Mix 4Q13 Comp. and Benefits, 51% Loss and LAE, 8% Policy Acquisition and Other Underwriting Expense, 6% Occupancy and Equipment, net, 12% Other, 24% |
|
|
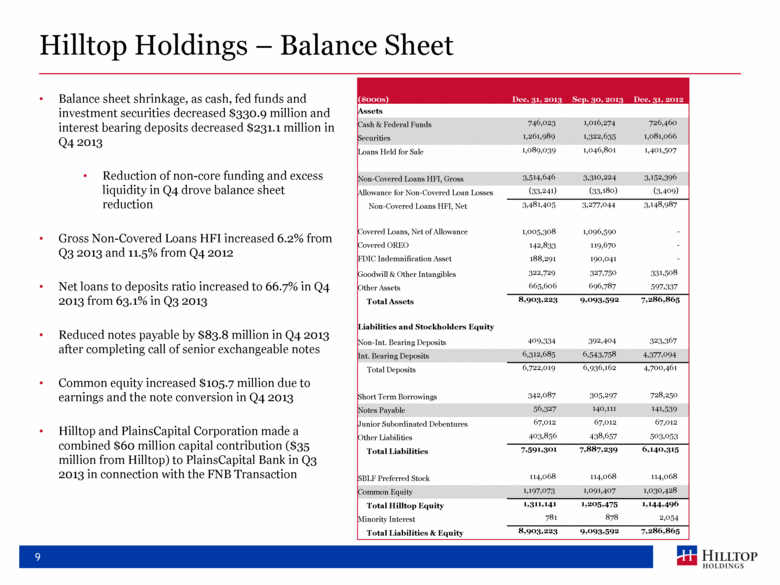
Hilltop Holdings – Balance Sheet Balance sheet shrinkage, as cash, fed funds and investment securities decreased $330.9 million and interest bearing deposits decreased $231.1 million in Q4 2013 Reduction of non-core funding and excess liquidity in Q4 drove balance sheet reduction Gross Non-Covered Loans HFI increased 6.2% from Q3 2013 and 11.5% from Q4 2012 Net loans to deposits ratio increased to 66.7% in Q4 2013 from 63.1% in Q3 2013 Reduced notes payable by $83.8 million in Q4 2013 after completing call of senior exchangeable notes Common equity increased $105.7 million due to earnings and the note conversion in Q4 2013 Hilltop and PlainsCapital Corporation made a combined $60 million capital contribution ($35 million from Hilltop) to PlainsCapital Bank in Q3 2013 in connection with the FNB Transaction 9 ($000s) Dec. 31, 2013 Sep. 30, 2013 Dec. 31, 2012 Assets Cash & Federal Funds 746,023 1,016,274 726,460 Securities 1,261,989 1,322,635 1,081,066 Loans Held for Sale 1,089,039 1,046,801 1,401,507 Non-Covered Loans HFI, Gross 3,514,646 3,310,224 3,152,396 Allowance for Non-Covered Loan Losses (33,241) (33,180) (3,409) Non-Covered Loans HFI, Net 3,481,405 3,277,044 3,148,987 Covered Loans, Net of Allowance 1,005,308 1,096,590 - Covered OREO 142,833 119,670 - FDIC Indemnification Asset 188,291 190,041 - Goodwill & Other Intangibles 322,729 327,750 331,508 Other Assets 665,606 696,787 597,337 Total Assets 8,903,223 9,093,592 7,286,865 Liabilities and Stockholders Equity Non-Int. Bearing Deposits 409,334 392,404 323,367 Int. Bearing Deposits 6,312,685 6,543,758 4,377,094 Total Deposits 6,722,019 6,936,162 4,700,461 Short Term Borrowings 342,087 305,297 728,250 Notes Payable 56,327 140,111 141,539 Junior Subordinated Debentures 67,012 67,012 67,012 Other Liabilities 403,856 438,657 503,053 Total Liabilities 7,591,301 7,887,239 6,140,315 SBLF Preferred Stock 114,068 114,068 114,068 Common Equity 1,197,073 1,091,407 1,030,428 Total Hilltop Equity 1,311,141 1,205,475 1,144,496 Minority Interest 781 878 2,054 Total Liabilities & Equity 8,903,223 9,093,592 7,286,865 |
|
|
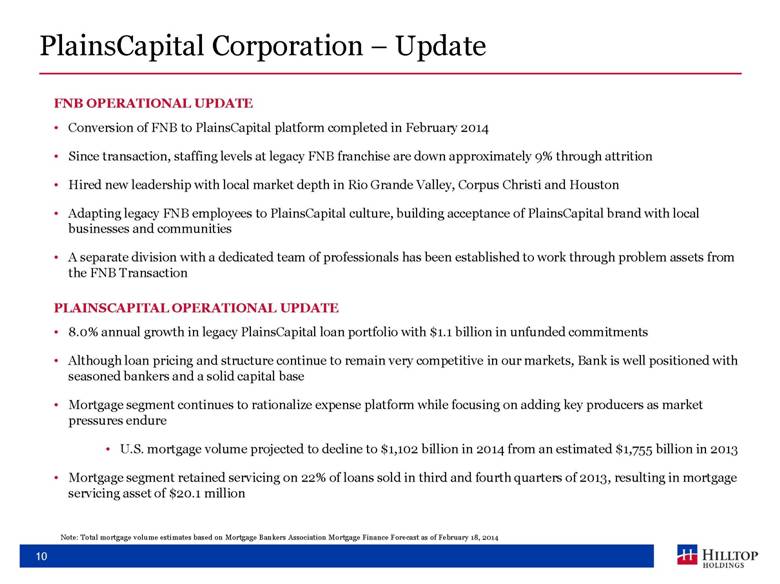
10 PlainsCapital Corporation – Update FNB OPERATIONAL UPDATE Conversion of FNB to PlainsCapital platform completed in February 2014 Since transaction, staffing levels at legacy FNB franchise are down approximately 9% through attrition Hired new leadership with local market depth in Rio Grande Valley, Corpus Christi and Houston Adapting legacy FNB employees to PlainsCapital culture, building acceptance of PlainsCapital brand with local businesses and communities A separate division with a dedicated team of professionals has been established to work through problem assets from the FNB Transaction PLAINSCAPITAL OPERATIONAL UPDATE 8.0% annual growth in legacy PlainsCapital loan portfolio with $1.1 billion in unfunded commitments Although loan pricing and structure continue to remain very competitive in our markets, Bank is well positioned with seasoned bankers and a solid capital base Mortgage segment continues to rationalize expense platform while focusing on adding key producers as market pressures endure U.S. mortgage volume projected to decline to $1,102 billion in 2014 from an estimated $1,755 billion in 2013 Mortgage segment retained servicing on 22% of loans sold in third and fourth quarters of 2013, resulting in mortgage servicing asset of $20.1 million Note: Total mortgage volume estimates based on Mortgage Bankers Association Mortgage Finance Forecast as of February 18, 2014 |
|
|
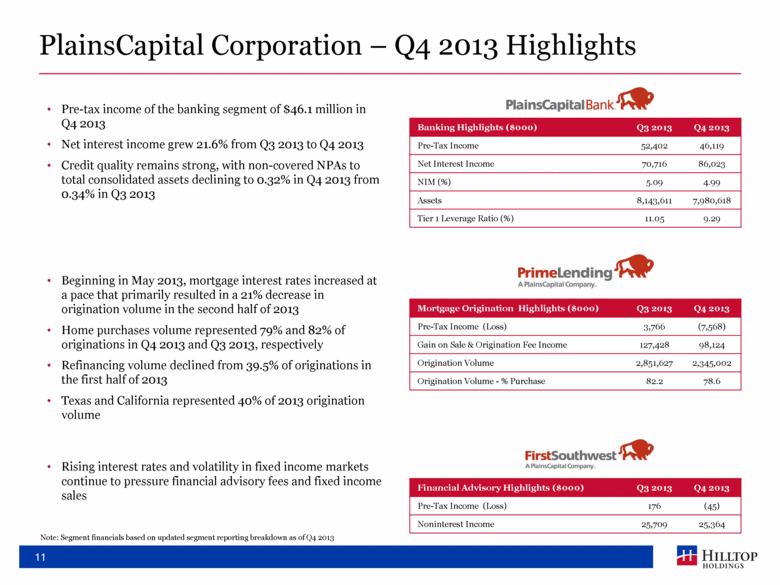
11 PlainsCapital Corporation – Q4 2013 Highlights Banking Highlights ($000) Q3 2013 Q4 2013 Pre-Tax Income 52,402 46,119 Net Interest Income 70,716 86,023 NIM (%) 5.09 4.99 Assets 8,143,611 7,980,618 Tier 1 Leverage Ratio (%) 11.05 9.29 Mortgage Origination Highlights ($000) Q3 2013 Q4 2013 Pre-Tax Income (Loss) 3,766 (7,568) Gain on Sale & Origination Fee Income 127,428 98,124 Origination Volume 2,851,627 2,345,002 Origination Volume - % Purchase 82.2 78.6 Financial Advisory Highlights ($000) Q3 2013 Q4 2013 Pre-Tax Income (Loss) 176 (45) Noninterest Income 25,709 25,364 Pre-tax income of the banking segment of $46.1 million in Q4 2013 Net interest income grew 21.6% from Q3 2013 to Q4 2013 Credit quality remains strong, with non-covered NPAs to total consolidated assets declining to 0.32% in Q4 2013 from 0.34% in Q3 2013 Beginning in May 2013, mortgage interest rates increased at a pace that primarily resulted in a 21% decrease in origination volume in the second half of 2013 Home purchases volume represented 79% and 82% of originations in Q4 2013 and Q3 2013, respectively Refinancing volume declined from 39.5% of originations in the first half of 2013 Texas and California represented 40% of 2013 origination volume Rising interest rates and volatility in fixed income markets continue to pressure financial advisory fees and fixed income sales Note: Segment financials based on updated segment reporting breakdown as of Q4 2013 |
|
|
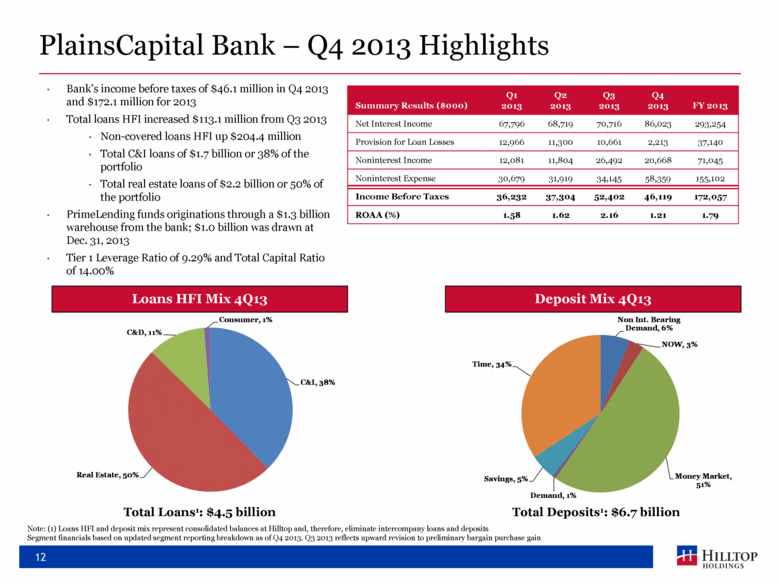
12 PlainsCapital Bank – Q4 2013 Highlights Bank’s income before taxes of $46.1 million in Q4 2013 and $172.1 million for 2013 Total loans HFI increased $113.1 million from Q3 2013 Non-covered loans HFI up $204.4 million Total C&I loans of $1.7 billion or 38% of the portfolio Total real estate loans of $2.2 billion or 50% of the portfolio PrimeLending funds originations through a $1.3 billion warehouse from the bank; $1.0 billion was drawn at Dec. 31, 2013 Tier 1 Leverage Ratio of 9.29% and Total Capital Ratio of 14.00% Summary Results ($000) Q1 2013 Q2 2013 Q3 2013 Q4 2013 FY 2013 Net Interest Income 67,796 68,719 70,716 86,023 293,254 Provision for Loan Losses 12,966 11,300 10,661 2,213 37,140 Noninterest Income 12,081 11,804 26,492 20,668 71,045 Noninterest Expense 30,679 31,919 34,145 58,359 155,102 Income Before Taxes 36,232 37,304 52,402 46,119 172,057 Loans HFI Mix 4Q13 Total Loans1: $4.5 billion Deposit Mix 4Q13 Total Deposits1: $6.7 billion Note: (1) Loans HFI and deposit mix represent consolidated balances at Hilltop and, therefore, eliminate intercompany loans and deposits Segment financials based on updated segment reporting breakdown as of Q4 2013. Q3 2013 reflects upward revision to preliminary bargain purchase gain ROAA (%) 1.58 1.62 2.16 1.21 1.79 C&I, 38% Real Estate, 50% C&D, 11% Consumer, 1% Non Int. Bearing Demand, 6% NOW, 3% Money Market, 51% Demand, 1% Savings, 5% Time, 34% |
|
|
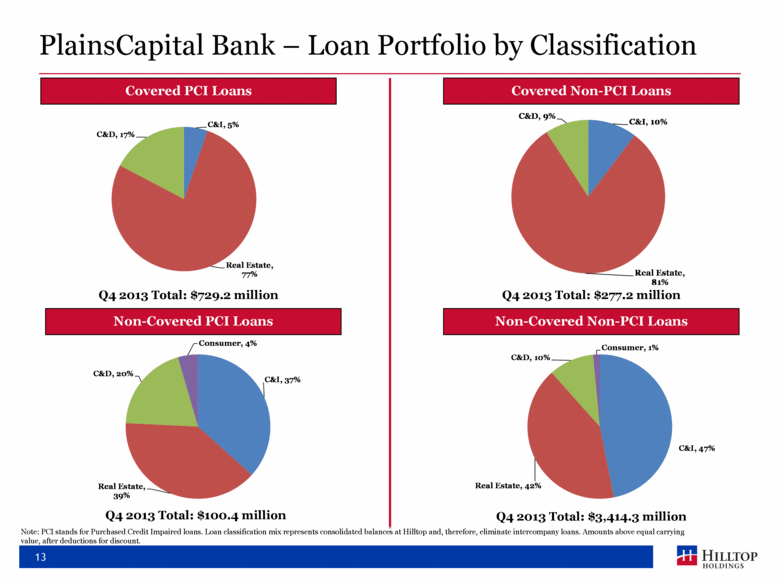
PlainsCapital Bank – Loan Portfolio by Classification 13 Covered PCI Loans Q4 2013 Total: $729.2 million Covered Non-PCI Loans Q4 2013 Total: $277.2 million Non-Covered PCI Loans Q4 2013 Total: $100.4 million Non-Covered Non-PCI Loans Q4 2013 Total: $3,414.3 million Note: PCI stands for Purchased Credit Impaired loans. Loan classification mix represents consolidated balances at Hilltop and, therefore, eliminate intercompany loans. Amounts above equal carrying value, after deductions for discount. C&I, 5% Real Estate, 77% C&D, 17% C&I, 37% Real Estate, 39% C&D, 20% Consumer, 4% C&I, 10% Real Estate, 81% C&D, 9% |
|
|
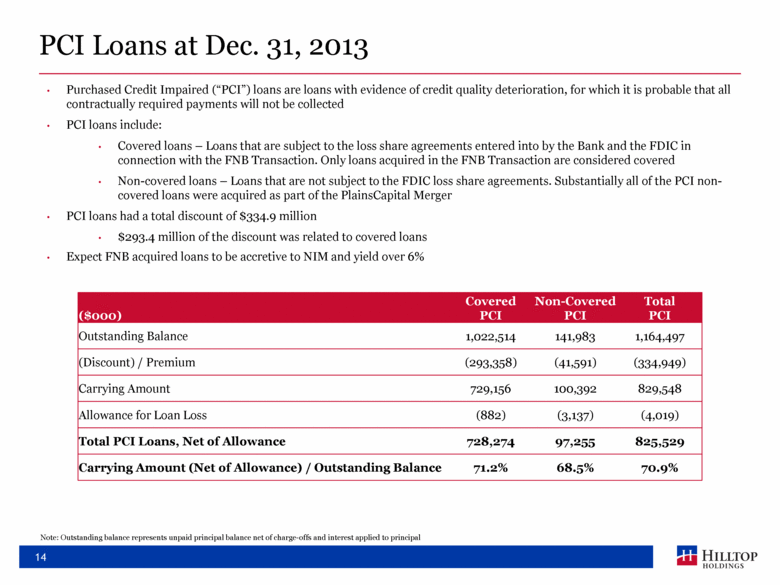
PCI Loans at Dec. 31, 2013 14 Purchased Credit Impaired (“PCI”) loans are loans with evidence of credit quality deterioration, for which it is probable that all contractually required payments will not be collected PCI loans include: Covered loans – Loans that are subject to the loss share agreements entered into by the Bank and the FDIC in connection with the FNB Transaction. Only loans acquired in the FNB Transaction are considered covered Non-covered loans – Loans that are not subject to the FDIC loss share agreements. Substantially all of the PCI non-covered loans were acquired as part of the PlainsCapital Merger PCI loans had a total discount of $334.9 million $293.4 million of the discount was related to covered loans Expect FNB acquired loans to be accretive to NIM and yield over 6% ($000) Covered PCI Non-Covered PCI Total PCI Outstanding Balance 1,022,514 141,983 1,164,497 (Discount) / Premium (293,358) (41,591) (334,949) Carrying Amount 729,156 100,392 829,548 Allowance for Loan Loss (882) (3,137) (4,019) Total PCI Loans, Net of Allowance 728,274 97,255 825,529 Carrying Amount (Net of Allowance) / Outstanding Balance 71.2% 68.5% 70.9% Note: Outstanding balance represents unpaid principal balance net of charge-offs and interest applied to principal |
|
|
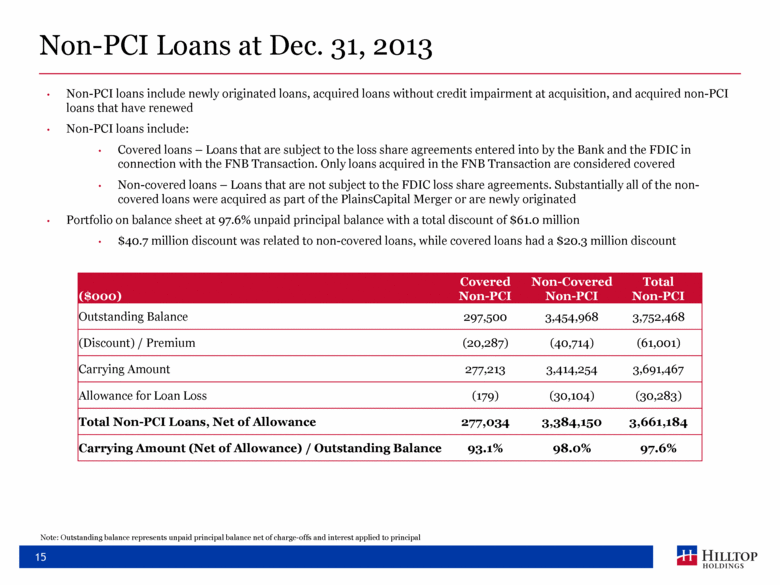
Non-PCI Loans at Dec. 31, 2013 15 ($000) Covered Non-PCI Non-Covered Non-PCI Total Non-PCI Outstanding Balance 297,500 3,454,968 3,752,468 (Discount) / Premium (20,287) (40,714) (61,001) Carrying Amount 277,213 3,414,254 3,691,467 Allowance for Loan Loss (179) (30,104) (30,283) Total Non-PCI Loans, Net of Allowance 277,034 3,384,150 3,661,184 Carrying Amount (Net of Allowance) / Outstanding Balance 93.1% 98.0% 97.6% Non-PCI loans include newly originated loans, acquired loans without credit impairment at acquisition, and acquired non-PCI loans that have renewed Non-PCI loans include: Covered loans – Loans that are subject to the loss share agreements entered into by the Bank and the FDIC in connection with the FNB Transaction. Only loans acquired in the FNB Transaction are considered covered Non-covered loans – Loans that are not subject to the FDIC loss share agreements. Substantially all of the non-covered loans were acquired as part of the PlainsCapital Merger or are newly originated Portfolio on balance sheet at 97.6% unpaid principal balance with a total discount of $61.0 million $40.7 million discount was related to non-covered loans, while covered loans had a $20.3 million discount Note: Outstanding balance represents unpaid principal balance net of charge-offs and interest applied to principal |
|
|
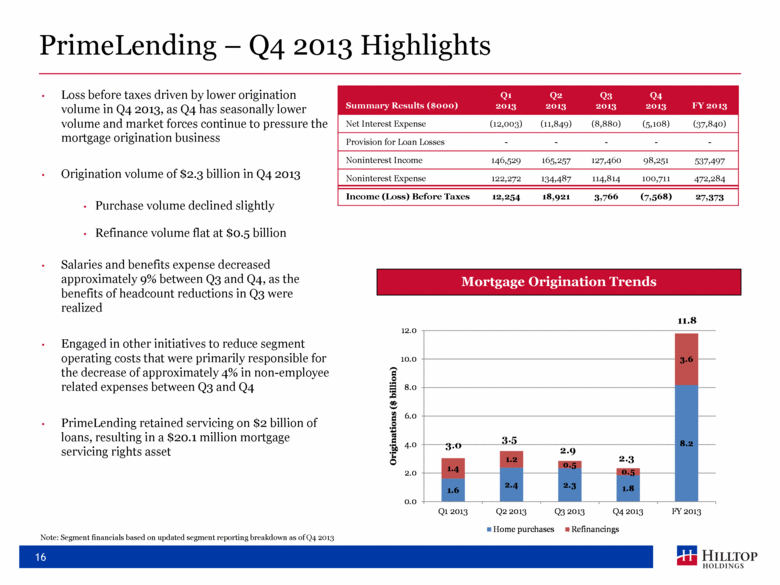
16 PrimeLending – Q4 2013 Highlights Loss before taxes driven by lower origination volume in Q4 2013, as Q4 has seasonally lower volume and market forces continue to pressure the mortgage origination business Origination volume of $2.3 billion in Q4 2013 Purchase volume declined slightly Refinance volume flat at $0.5 billion Salaries and benefits expense decreased approximately 9% between Q3 and Q4, as the benefits of headcount reductions in Q3 were realized Engaged in other initiatives to reduce segment operating costs that were primarily responsible for the decrease of approximately 4% in non-employee related expenses between Q3 and Q4 PrimeLending retained servicing on $2 billion of loans, resulting in a $20.1 million mortgage servicing rights asset Mortgage Origination Trends 3.0 3.5 2.9 Summary Results ($000) Q1 2013 Q2 2013 Q3 2013 Q4 2013 FY 2013 Net Interest Expense (12,003) (11,849) (8,880) (5,108) (37,840) Provision for Loan Losses - - - - - Noninterest Income 146,529 165,257 127,460 98,251 537,497 Noninterest Expense 122,272 134,487 114,814 100,711 472,284 Income (Loss) Before Taxes 12,254 18,921 3,766 (7,568) 27,373 2.3 11.8 Note: Segment financials based on updated segment reporting breakdown as of Q4 2013 1.6 2.4 2.3 1.8 8.2 1.4 1.2 0.5 0.5 3.6 0.0 2.0 4.0 6.0 8.0 10.0 12.0 Q1 2013 Q2 2013 Q3 2013 Q4 2013 FY 2013 Originations ($ billion) Home purchases Refinancings |
|
|
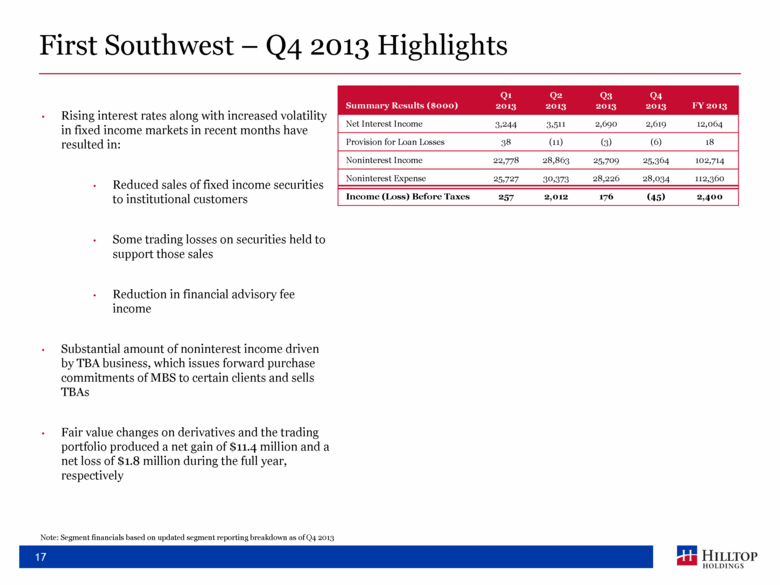
17 First Southwest – Q4 2013 Highlights Rising interest rates along with increased volatility in fixed income markets in recent months have resulted in: Reduced sales of fixed income securities to institutional customers Some trading losses on securities held to support those sales Reduction in financial advisory fee income Substantial amount of noninterest income driven by TBA business, which issues forward purchase commitments of MBS to certain clients and sells TBAs Fair value changes on derivatives and the trading portfolio produced a net gain of $11.4 million and a net loss of $1.8 million during the full year, respectively Summary Results ($000) Q1 2013 Q2 2013 Q3 2013 Q4 2013 FY 2013 Net Interest Income 3,244 3,511 2,690 2,619 12,064 Provision for Loan Losses 38 (11) (3) (6) 18 Noninterest Income 22,778 28,863 25,709 25,364 102,714 Noninterest Expense 25,727 30,373 28,226 28,034 112,360 Income (Loss) Before Taxes 257 2,012 176 (45) 2,400 Note: Segment financials based on updated segment reporting breakdown as of Q4 2013 |
|
|
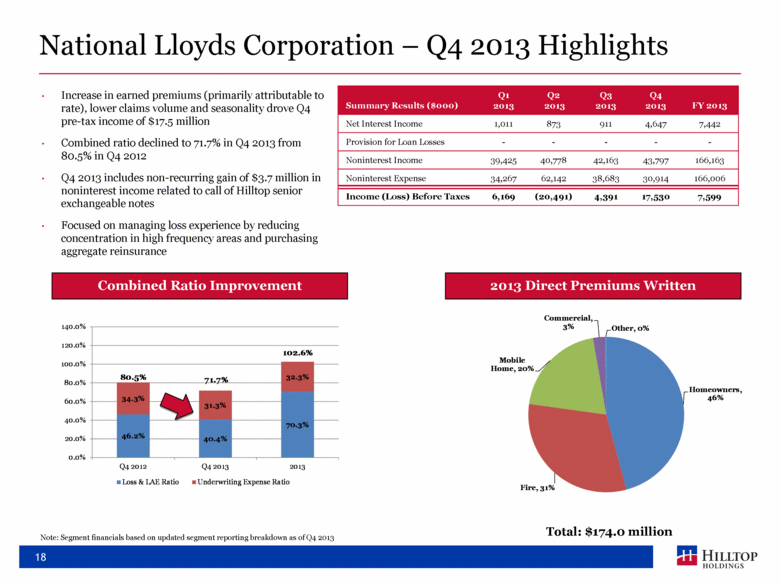
18 National Lloyds Corporation – Q4 2013 Highlights Increase in earned premiums (primarily attributable to rate), lower claims volume and seasonality drove Q4 pre-tax income of $17.5 million Combined ratio declined to 71.7% in Q4 2013 from 80.5% in Q4 2012 Q4 2013 includes non-recurring gain of $3.7 million in noninterest income related to call of Hilltop senior exchangeable notes Focused on managing loss experience by reducing concentration in high frequency areas and purchasing aggregate reinsurance 2013 Direct Premiums Written Combined Ratio Improvement Total: $174.0 million Summary Results ($000) Q1 2013 Q2 2013 Q3 2013 Q4 2013 FY 2013 Net Interest Income 1,011 873 911 4,647 7,442 Provision for Loan Losses - - - - - Noninterest Income 39,425 40,778 42,163 43,797 166,163 Noninterest Expense 34,267 62,142 38,683 30,914 166,006 Income (Loss) Before Taxes 6,169 (20,491) 4,391 17,530 7,599 Note: Segment financials based on updated segment reporting breakdown as of Q4 2013 46.2% 40.4% 70.3% 34.3% 31.3% 32.3% 0.0% 20.0% 40.0% 60.0% 80.0% 100.0% 120.0% 140.0% Q4 2012 Q4 2013 2013 Loss & LAE Ratio Underwriting Expense Ratio 80.5% 102.6% 71.7% |
|
|
19 Questions? |