Attached files
| file | filename |
|---|---|
| EX-32.2 - EXHIBIT322 - zulily, inc. | zu12292013xexhibit312.htm |
| EX-23.1 - EXHIBIT231 - zulily, inc. | exhibit231consentofindepen.htm |
| EX-10.13 - EXHIBIT1013 - zulily, inc. | zu-12292013xex1013.htm |
| EX-31.1 - EXHIBIT311 - zulily, inc. | zu12292013xexhibit311.htm |
| EX-32.1 - EXHIBIT321 - zulily, inc. | zu12292013xexhibit321.htm |
UNITED STATES
SECURITIES AND EXCHANGE COMMISSION
Washington, D.C. 20549
FORM 10-K
(Mark One)
x | ANNUAL REPORT PURSUANT TO SECTION 13 OR 15(d) OF THE SECURITIES EXCHANGE ACT OF 1934 |
For the fiscal year ended December 29, 2013
¨ | TRANSITION REPORT PURSUANT TO SECTION 13 OR 15(d) OF THE SECURITIES EXCHANGE ACT OF 1934 |
For the transition period from to
Commission File Number 001-36188
zulily, inc.
(Exact name of registrant as specified in its charter)
Delaware | 27-1202150 | |
(State or other jurisdiction of incorporation or organization) | (I.R.S. Employer Identification Number) | |
2601 Elliott Avenue, Suite 200
Seattle, WA 98121
(877) 779-5614
(Address, including zip code, and telephone number,
including area code, of registrant's principal executive offices)
Securities registered pursuant to Section 12(b) of the Act:
Title of Each Class | Name of Exchange on Which Registered | |
Class A Common Stock, par value $0.0001 per share | NASDAQ Global Select Market | |
Securities registered pursuant to Section 12(g) of the Act:
None
Indicate by check mark whether the registrant is a well-known seasoned issuer, as defined in Rule 405 of the Securities Act. Yes ¨ No x
Indicate by check mark whether the registrant is not required to file reports pursuant to Section 13 or Section 15(d) of the Act. Yes ¨ No x
Indicate by check mark whether the registrant (1) has filed all reports required to be filed by Section 13 or 15(d) of the Securities Exchange Act of 1934 during the preceding 12 months (or for such shorter period that the registrant was required to file such reports), and (2) has been subject to such filing requirements for the past 90 days. Yes x No ¨
Indicate by check mark whether the registrant has submitted electronically and posted on its corporate Web site, if any, every Interactive Data File required to be submitted and posted pursuant to Rule 405 of Regulation S-T during the preceding 12 months (or for such shorter period that the registrant was required to submit and post such files). Yes ¨ No ¨
Indicate by check mark if disclosure of delinquent filers pursuant to Item 405 of Regulation S-K (§229.405 of this chapter) is not contained herein, and will not be contained, to the best of the registrant’s knowledge, in definitive proxy or information statements incorporated by reference in Part III of this Form 10-K or any amendment to this Form 10-K. x
Indicate by check mark whether the registrant is a large accelerated filer, an accelerated filer, a non-accelerated filer, or a smaller reporting company. See definitions of “large accelerated filer”, “accelerated filer”, and “smaller reporting company” in Rule 12b-2 of the Exchange Act.
Large accelerated filer ¨ | Accelerated filer ¨ | |
Non-accelerated filer x (Do not check if a smaller reporting company) | Smaller reporting company ¨ | |
Indicate by check mark whether the registrant is a shell company (as defined in Rule 12b-2 of the Act). Yes o No x
The registrant's common stock was not publicly traded as of the last business day of the registrant's most recently completed second fiscal quarter.
As of February 26, 2014, there were 13,225,000 shares of the registrant’s Class A Common Stock, par value $0.0001 per share, and 110,858,284 shares of the registrant's Class B Common Stock, par value $0.0001 per share, issued and outstanding.
DOCUMENTS INCORPORATED BY REFERENCE
Part III incorporates certain information by reference from the definitive proxy statement to be filed by the registrant in connection with the 2014 Annual Meeting of Stockholders (the "Proxy Statement"). The Proxy Statement will be filed by the registrant with the Securities and Exchange Commission pursuant to Regulation 14A not later than 120 days after the end of the registrant's fiscal year ended December 29, 2013.
ZULILY, INC.
ANNUAL REPORT ON FORM 10-K
FOR THE FISCAL YEAR ENDED DECEMBER 29, 2013
TABLE OF CONTENTS
Page | |
Part I | |
Part II | |
Part III | |
Part IV | |
Unless the context suggests otherwise, references in this Annual Report on Form 10-K, or Annual Report, to "zulily," the "Company," "we," "us," and "our" refer to zulily, inc. and, where appropriate, its subsidiary, Zulily UK Ltd.
zulily, zulily, inc., the zulily logo and other trade names, trademarks or service marks of zulily appearing in this Annual Report are the property of zulily. Any trade names, trademarks and service marks of other companies appearing in this Annual Report are the property of their respective holders.
PART I
SPECIAL NOTE REGARDING FORWARD-LOOKING STATEMENTS
This Annual Report contains forward-looking statements within the meaning of Section 21E of the Securities Exchange Act of 1934, as amended, or the Exchange Act, and section 27A of the Securities Act of 1933, as amended, or the Securities Act. All statements contained in this Annual Report other than statements of historical fact, including statements regarding our future results of operations and financial position, our business strategy and plans, and our objectives for future operations, are forward-looking statements. The words "believe," "may," "will," "estimate," "continue," "anticipate," "intend," "expect," "seek," and similar expressions are intended to identify forward-looking statements. We have based these forward-looking statements largely on our current expectations and projections about future events and trends that we believe may affect our financial condition, results of operations, business strategy, short-term and long-term business operations and objectives, and financial needs. These forward-looking statements are subject to a number of risks, uncertainties and assumptions, including those described in the "Risk Factors" section of this Annual Report. Moreover, we operate in a very competitive and rapidly changing environment. New risks emerge from time to time. It is not possible for our management to predict all risks, nor can we assess the impact of all factors on our business or the extent to which any factor, or combination of factors, may cause actual results to differ materially from those contained in any forward-looking statements we may make. In light of these risks, uncertainties, and assumptions, the future events and trends discussed in this Annual Report may not occur and actual results could differ materially and adversely from those anticipated or implied in the forward-looking statements.
You should not rely upon forward-looking statements as predictions of future events. The events and circumstances reflected in the forward-looking statements may not be achieved or occur. Although we believe that the expectations reflected in the forward-looking statements are reasonable, we cannot guarantee future results, levels of activity, performance, or achievements. We are under no duty to update any of these forward-looking statements after the date of this Annual Report or to conform these statements to actual results or revised expectations.
Item 1. Business
Overview
zulily is an online retailer offering customers a fun and entertaining shopping experience with a fresh selection of new product styles launched each day. We launched the zulily website in January 2010 with the goal of revolutionizing the way moms shop. Today, we are one of the largest standalone e-commerce companies in the United States. Through our desktop and mobile websites and mobile applications, which we refer to as our “sites,” we help our customers discover new and unique products at great values that they would likely not find elsewhere. We provide customers a fun and entertaining shopping experience with a fresh selection of product styles offered on a typical day through various flash sales events, which are limited-time curated online sales of selected products launched each day on our sites. We source our merchandise from thousands of vendors, including emerging brands and smaller boutique vendors, as well as larger national brands. By bringing together millions of customers and a daily selection of products chosen from our vendor base, we have built a large scale and uniquely curated marketplace.
We have organized our operations into two principal segments. The North America segment consists of amounts earned from product and services sales through our North America-focused sites, including sales from the sites to customers in the United States and Canada and, through a third-party service provider, other international locations. The U.K. segment consists of amounts earned from product and services sales through our U.K.-focused sites, including sales from the sites to customers in the United Kingdom and throughout Europe. See Note 9: "Segment Information" of the Notes to Consolidated Financial Statements within Item 8 of Part II of this Annual Report.
Business Strategies
Making shopping entertaining for our customers is core to who we are and what we do. We think beyond just offering what consumers are directly looking for and instead look to inspire purchasing by finding and offering a curated set of products from new and emerging brands that could not otherwise easily be found. Our customers are passionate about buying products for themselves and their kids that stand out and look special, particularly at
1
affordable prices. Our goal is to be part of our customer's daily routine, allowing them to visit our sites and discover a selection of fresh, new and affordable merchandise curated for them every morning.
Every morning, we launch a variety of flash sales events. These events feature thousands of product styles from different vendors and last for 72 hours. The day’s events are kicked off by an early morning email to our email subscribers and “push” communication to users of our mobile applications. Offerings are only available for a limited time and in a limited quantity, creating urgency to browse and purchase. The majority of our products are sourced from emerging brands and smaller boutique vendors that our customers may not have heard of and whose products are not widely available online. We also offer larger nationally known brands that appeal to our customers and draw new customers to our sites.
Before we launch an event, our photography team typically photographs our merchandise in our in-house studios and our editorial team writes about our merchandise so that we can present each day’s selection of product in our fun and engaging voice. The experience, creativity, resourcefulness and efficiency of our merchandising, creative and operations teams enable us to feature thousands of product styles each quarter. We work to create the most compelling price points for our customers, with the average item on our sites offered for over 50% off the manufacturer’s suggested retail price. We then use our proprietary technology, data analytics and personalization tools to segment our audience, offering each customer a curated and optimized shopping experience that features brands, products and events that we believe are most relevant for that customer.
Our objective is to be the leading online retail destination for moms. We plan to attain this goal through the following key strategies:
Continue to Aggressively Acquire New Customers. We believe that there is significant room to further grow our customer base cost effectively. We plan to aggressively grow our customer base by attracting visitors to our sites through targeted and cost-effective marketing campaigns and then converting these email subscribers into active customers. We test new marketing channels and campaigns aimed at attracting new email subscribers and converting existing email subscribers into customers, constantly and rigorously measuring the returns on these campaigns.
Continue to Increase Customer Loyalty and Repeat Purchasing. Our goal is to maintain our leadership as a preeminent e-commerce company by continuing to offer a wide variety of new and unique products, refreshed daily and curated specifically for our customers, at compelling values and presented in a fun and entertaining format. Ultimately, we aim to become part of each of our customer’s daily routine by broadening the ways in which we interact with our customers, including via mobile, social and email channels. We also regularly introduce new categories, brands and products of interest to to our customers, and work to maximize the relevance of the items we display, thereby improving customer satisfaction, increasing customer loyalty and driving higher repeat purchasing.
Continue to Add New Vendors and Strengthen Existing Vendor Relationships. Our merchandising team is continually discovering new vendors with compelling and unique merchandise to add to our large base of existing repeat vendors. We use the substantial structural advantages in our business model to build strong long-term relationships with our vendor partners. Our platform creates a large-scale marketing, technology and distribution advantage that our vendors can leverage, efficiently and cost-effectively, to drive greater brand awareness and significant incremental sales. We will continue to develop tools and resources that allow us to provide our new and existing vendors with a compelling return on investment and a successful platform to scale their businesses.
Continue to Invest in Our Mobile Platform. The e-commerce industry’s shift to mobile represents a key growth opportunity for us. We expect our mobile revenue to continue to grow.
Expand International Presence. To date, we have primarily focused on expanding our North American business (in which we include Canada) and are just beginning to focus on our international strategy. In April 2012, we launched our first international site, with a small team based in the United Kingdom. For the fiscal years ended December 29, 2013 and December 30, 2012, we generated $13.9 million and $4.9 million in net sales from our U.K.-based sites, respectively, or 2.0% and 1.5% of total net sales, respectively. We are gradually increasing the level of investment in our international expansion and plan to continue to invest in and develop international markets, balanced with a continued focus on building the core North American market.
2
Opportunistically Pursue Strategic Acquisitions. We may expand our business through opportunistic acquisitions that will allow us to enhance our customer offering, enter new geographies or leverage our existing platform capabilities, among other things.
Product Offerings and Vendor Relationships
We offer merchandise primarily targeted at moms purchasing for their children, themselves and their homes. Our merchandise includes children’s apparel, women’s apparel, and other product categories such as toys, infant gear, kitchen accessories and home décor. Many of our customers initially purchase in one product category, but as they discover new products on our sites, they begin purchasing from other categories as well. While children’s apparel is our largest merchandise category today, we have expanded our categories over time such that all non-children’s apparel categories combined accounted for 57% of our North America units ordered for the fiscal year ended December 29, 2013, up from 45% in the fiscal year ended December 30, 2012. Our model of rapidly launching new styles allows us to easily experiment with new categories efficiently and cost-effectively. The average value of an order placed during the fiscal year ended December 29, 2013 was $54.75. Our current categories include:
Category | Offering |
Children’s Apparel | Infant, Two to Six Year Old Children, Tween Girls, Tween Boys, Accessories, Shoes |
Women’s Apparel | Apparel, Special Sizes, Maternity/Nursing, Intimates, Accessories, Shoes |
Children’s Merchandise | Infant Gear, Sports Equipment, Toys, Books |
Other Merchandise | Kitchen Accessories, Home Décor, Entertainment, Electronics, Pet Accessories |
Our primary vendors are emerging brands and smaller boutique vendors. These are typically small-to-medium sized businesses. Since these vendors’ products are typically not available broadly online, the vendors generally work with us to gain brand awareness and generate incremental sales. We introduce these vendors to our large audience and help them tell their stories in a way that differentiates their products and properly reflects their brand attributes. Our entire operational infrastructure - photography studios, editorial writers, fulfillment operations and technology capabilities - is designed to showcase these emerging brands’ and smaller boutique vendors’ products in the most compelling, engaging and personalized way, providing great value to our customers and revenue to our vendors as cost-effectively as possible.
We serve as an important channel for our vendors because by working with us they eliminate wholesale, direct sales and fulfillment costs for the products they sell through our platform. Because of our minimal inventory, intermediary model and short event cycle, we are able to experiment with a broad range of new products and a wide variety of vendors on a regular basis. Our vendors typically provide us with first-run, in-season merchandise as they are incentivized to get their best products in front of the broadest potential customer base. We supplement our boutique brand offerings with events from larger national brands and often become a meaningful partner for these larger national brands as well, driving significant sales and vendor loyalty. We typically purchase merchandise from our vendors through purchase orders we issue as we conduct flash sales events. We do not typically have long-term agreements or exclusive arrangements with our vendors.
Sales and Marketing
We acquire new email subscribers through a diverse set of paid and unpaid marketing channels, including affiliate channels and partners, customer referrals, direct navigation, display advertising, key word search campaigns, search engine optimization, social media and television ads. Core to our business model is that we acquire customers once via paid and unpaid sources, and then we drive engagement and repeat purchases from those customers over a long period of time through the sending of daily emails and mobile “push” communications.
We evaluate each of our marketing initiatives for its return on investment based on marketing spend measured against net sales and contribution margin generated. Although some of the visitors to our sites become customers when they first sign up, other visitors may sign up to receive our emails and “push” communications months before they make their first purchase. A portion of our marketing spend is meant to target these visitors for whom the conversion to purchasing comes after we have built a substantial relationship with them through regular contact and outreach over time.
3
Technology
Continual innovation through investment in technology is core to our business. We use our technology platform to improve the experience of our customers and vendors, increase the purchase frequency and average order size of our customers and optimize the efficiency of our business operations. Our technology team is focused on rapid innovation through advanced agile software development processes. Our scalable platform uses custom-built and third-party technologies to support our specific customer and vendor requirements, including handling significant spikes in site traffic and transactions on a daily basis, and the rapid order fulfillment needs that are unique to our flash sales and minimal inventory model. We believe we can quickly scale our infrastructure to accommodate significantly higher volumes of site traffic, customers, orders and the overall growth in our business.
We have built a comprehensive set of technology solutions, including:
• | e-Commerce Platform. Our core e-commerce platform consists of our customer facing desktop website, our mobile website and applications, our order processing and customer service systems. |
• | Mobile Platform and Applications. Mobile is a key component of our long-term strategy. Our mobile website and applications for iPhone, iPad and Android-based devices were custom built for our unique needs and are powered by the same core platform that powers our e-commerce platform. |
• | Relevancy and Personalization Systems. Our system is designed to provide a customized and personalized experience in real time to each email subscriber and customer in order to maximize the relevancy of the products we present to them. To provide this personalized experience, we process and analyze the large amounts of data generated by our email subscribers’ and customers’ browsing and shopping patterns on our sites. |
• | Customer Messaging. Every morning we send millions of personalized emails and alerts to our email subscribers and users of our mobile applications. To do this we have built an advanced customized messaging platform leveraging both our own proprietary technology solutions and third-party software solutions. In addition, our systems manage standard e-commerce customer communications such as order and shipment confirmations on a routine basis. |
• | Merchandising and Vendor Tools. We have built tools, including vendor management, vendor portal, catalog and price management and event management, that leverage our own proprietary technology and open source technology to manage our event process from end-to-end. Our platform supports hundreds of internal users and thousands of vendors and is designed specifically to effectively support emerging brands and smaller boutique vendors who may have limited systems and technical expertise. |
• | Fulfillment Management Systems. Our fulfillment management system combines custom-built and third-party software to satisfy our unique needs in a flexible and efficient manner. Our system allows us to efficiently manage inventory, track orders, fulfill orders and deliver the products to our customers in a timely manner. Our fulfillment management systems are integrated with our customer messaging system in order to provide real time information on order status and expected delivery date. |
Customer Service
Our goal in customer service is to “deliver magical service that inspires customers to be advocates for life.” We use both in-house operations in Seattle and a U.S.-based third-party customer service provider which allows us to deliver high quality service at lower costs. Our goal is to deliver the highest quality of customer service to our customers, and our customer service operators are empowered to make the right decision for the customer and strengthen that customer's experience with zulily.
Fulfillment
To best serve our customers and vendors, we have in place a custom, fully integrated fulfillment infrastructure consisting of our receiving, sorting, inventory management and repackaging systems which are coordinated by our proprietary fulfillment management software. Our supply chain solution efficiently handles the small-to-medium lot sizes and high inventory turnover required by our constantly changing, limited-time product offerings. We operate a minimal inventory, intermediary model where we typically take customer orders before we purchase inventory from our vendors. As a result, we are able to offer a much larger selection of products to our
4
customers and to generate greater sales for our vendors, who are able to match a broader range of their product supply to actual customer demand.
Seasonality
We believe our results are impacted by a pattern of increased sales during the back-to-school shopping season in the third quarter and holiday shopping season in the fourth quarter which has resulted in increased sales during a portion of the third quarter and the fourth quarter each fiscal year, which then results in lower sequential growth in the first quarter. The fourth quarter accounted for approximately 36.9% and 38.8% of our net sales in the fiscal years ended December 29, 2013 and December 30, 2012, respectively. See Item 1A, “Risk Factors” for further information regarding seasonality.
Competition
We view our target market broadly and we believe we are competitive with any retailer where our customers shop. We face significant competition from both online and offline retailers. Our customers have a wide variety of shopping options that include:
• | Direct e-Commerce Websites and Online Marketplaces. These websites include pure play e-commerce companies, such as Amazon.com, Inc., the e-commerce platforms of traditional retailers, such as Target Corporation, Toys“R”Us, Inc., and Wal-Mart Stores, Inc., and online marketplaces such as eBay Inc. |
• | In-person Stores and Boutiques. These include discount and mass-merchandisers, such as Target Corporation, Toys“R”Us, Inc., and Wal-Mart Stores, Inc., as well as boutique sellers of children’s apparel, women’s apparel, toys, infant gear, kitchen accessories and home décor and other products. |
We compete based on: product curation and selection, personalization, value, convenience, ease of use, consumer experience, vendor satisfaction and shipping time and cost. While our industry is evolving rapidly and is becoming increasingly competitive, we believe that we compete favorably across these dimensions taken as a whole.
Intellectual Property
We rely on laws and regulations, contractual restrictions, copyrights, and trademarks to protect our intellectual property and proprietary rights. Our employees and contractors also enter into agreements to assign to us the inventions and content they produce in performing their jobs. We control access to our confidential information by entering into confidentiality agreements with our employees, contractors and third parties, such as vendors, service providers, individuals and entities that may be exploring a business relationship with us. Despite the protection of general intellectual property law and our contractual restrictions, it may be possible for a third party to copy or otherwise obtain and use our intellectual property without our authorization.
We have registered numerous Internet domain names related to our business. As of December 29, 2013, we had two pending patent applications directed to our technology in the United States. In addition, we pursue the registration of our trademarks in the United States and certain other locations outside of the United States; however, effective intellectual property protection or enforcement may not be available in every country in which our products and services are made available in the future. In the United States and certain other countries, we have registered or have applications pending for our key trademarks: zulily, the zulily design mark and the “Z” design associated with our mobile applications.
Employees
As of December 29, 2013, we had 1,110 employees globally. Additionally, we rely on independent contractors and temporary personnel to supplement our workforce, primarily in our fulfillment centers. None of our employees is represented by a labor union or covered by a collective bargaining agreement. We consider our relationship with our employees to be good.
5
Fiscal Year
Our fiscal year ends on the Sunday closest to December 31 of the respective calendar year. Each fiscal year consists of four 13-week quarters, with one extra week added in the fourth quarter every five to six years.
Corporate Information
We were incorporated in 2009 in Delaware. zulily's principal executive office is located at 2601 Elliott Avenue, Suite 200, Seattle, WA 98121. We also operate a buying and studio office in Columbus, Ohio and have fulfillment centers in McCarran, Nevada and Lockbourne, Ohio. Our telephone number is (877) 779-5614 and our website address is www.zulily.com. The information on, or that can be accessed through, our website, is not part of this Annual Report.
Zulily UK Ltd. was incorporated in the United Kingdom in October 2011 and is a wholly owned subsidiary of zulily, inc.
Available Information
Our investor relations website is http://investor.zulily.com and we encourage investors to use it as a way of easily finding information about us. We promptly make available on this website, free of charge, the reports that we file or furnish with the Securities and Exchange Commission (“SEC”), and corporate governance information (including our Code of Business Conduct and Ethics). We file annual reports on Form 10-K, quarterly reports on Form 10-Q, current reports on Form 8-K, proxy and information statements and amendments to reports filed or furnished pursuant to Sections 13(a), 14 and 15(d) of the Exchange Act. All material we file with the SEC is publicly available at the SEC's Public Reference Room at 100 F Street NE, Washington, DC 20549. You may obtain information on the operation of the SEC's Public Reference Room by calling the SEC at 1-800-SEC-0330. In addition, the SEC maintains a website at www.sec.gov that contains reports, proxy and information statements and other information regarding zulily and other issuers that file electronically with the SEC. Our website and the information contained therein or connected thereto are not a part of, or incorporated into, this Annual Report.
Item 1A. Risk Factors
Our operations and financial results are subject to various risks and uncertainties, including those described below. Before making an investment decision, you should carefully consider the risks described below and all other information contained in this Annual Report, including our consolidated financial statements and related notes, which could materially and adversely affect our business, results of operations or financial condition. Our business faces significant risks and the risks described below may not be the only risks we face. Additional risks not presently known to us or that we currently believe are immaterial may materially affect our business, results of operations, or financial condition. If any of these risks occur, the trading price of our Class A common stock could decline and you may lose all or part of your investment.
Risks Related to Our Business and Industry
Because we have a short operating history in an evolving industry, our past results may not be indicative of future performance, and our future performance may fluctuate materially and increase your investment risk.
We have a short operating history in a rapidly evolving industry that may not develop as expected, if at all. Our relatively short operating history makes it difficult to assess our future prospects. You should consider our business and prospects in light of the risks and difficulties we may encounter.
Our future success will depend in large part upon our ability to, among other things:
• | acquire new customers who purchase products from us at the same rate and of the same type as existing customers; |
• | retain our existing customers and have them continue to purchase products from us at rates and methods consistent with their prior purchasing behavior; |
• | encourage customers to expand the categories of products they purchase from us; |
6
• | attract new vendors to supply quality products that we can offer to our customers at attractive prices; |
• | retain our existing vendors and have them supply additional quality products that we can offer to our customers at attractive prices; |
• | increase the awareness of our brand; |
• | provide our customers and vendors with a superior experience; |
• | fulfill and deliver orders in a timely way and in accordance with customer expectations, which may change over time; |
• | respond to changes in consumer access to and use of the Internet and mobile devices; |
• | react to challenges from existing and new competitors; |
• | expand our business in new and existing markets, both domestic and international; |
• | avoid interruptions or disruptions in our business; |
• | develop a scalable, high-performance technology and fulfillment infrastructure that can efficiently and reliably handle increased usage globally, as well as the deployment of new features and the sale of new products and services; |
• | respond to macroeconomic trends; and |
• | hire, integrate and retain talented merchandise buyers and other personnel. |
We experience seasonal trends in our business and our mix of product offerings, which change with each 72 hour event, is highly variable from day-to-day and quarter-to-quarter. This variability makes it difficult to predict sales and can result in significant fluctuations in our net sales from period-to-period. We base our expense levels and investment plans on our estimates of net sales and gross margins. A significant portion of our expenses and investments is fixed, and we may be unable to adjust our spending quickly if our net sales or our gross margins are worse than expected.
The cumulative effects of these factors or our inability to manage any of the risks and difficulties identified above and elsewhere in this section could result in large fluctuations and unpredictability in our quarterly and annual operating results. As a result, comparing our operating results on a period-to-period basis may not be meaningful. You should not rely on our past results as an indication of our future performance. This variability and unpredictability could also result in our failing to meet the expectations of industry or financial analysts or investors for any period. If our net sales or operating results fall below the expectations of analysts or investors or below any forecasts we may provide to the market, or if the forecasts we provide to the market are below the expectations of analysts or investors, the price of our Class A common stock could decline substantially. Such a stock price decline could occur even when we have met any previously publicly stated net sales or earnings forecasts that we may provide.
If we fail to effectively manage our growth, our business, financial condition and operating results could be harmed.
To effectively manage our growth, we must continue to implement our operational plans and strategies, improve and expand our infrastructure of people and information systems and expand, train and manage our employee and contractor base. We have rapidly increased employee and contractor headcount since our inception to support the growth in our business, and we intend for this growth to continue for the foreseeable future. The number of our employees increased from 329 as of January 1, 2012 to 1,110 as of December 29, 2013, and we expect to add a significant number of employees during the remainder of 2014. To support continued growth, we must effectively integrate, develop and motivate a large number of new employees, while maintaining our corporate culture. In particular, we intend to continue to make substantial investments to expand our merchandising and technology personnel. We face significant competition for personnel, particularly in the Seattle area where our headquarters is located. To attract top talent, we have had to offer, and believe we will need to continue to offer, competitive compensation packages before we can validate the productivity of those employees. The risks associated with a rapidly growing workforce will be particularly acute internationally. Additionally, we may not be able to hire new employees quickly enough to meet our needs. If we fail to effectively manage our hiring needs or successfully integrate our new hires, our efficiency and ability to meet our forecasts and our employee morale,
7
productivity and retention could suffer, which may have a material adverse effect on our business, financial condition and operating results.
Additionally, the growth and expansion of our business and our product offerings place significant demands on our management. In particular, our mid-level management has not kept pace with the growth in our overall headcount, which we will need to devote significant resources to address. We produce new versions of our sites and emails to our customers on a daily basis, which generally requires new products, photos and text every day. The growth of our business may require significant additional resources to meet these daily requirements, which may not scale in a cost-effective manner or may negatively affect the quality of our sites and customer experience. We are also required to manage multiple relationships with various vendors, customers and other third parties. Further growth of our operations, our vendor base, our fulfillment centers, information technology systems or our internal controls and procedures may not be adequate to support our operations. If we are unable to manage the growth of our organization effectively, our business, financial condition and operating results may be materially and adversely affected.
We have incurred significant operating losses in the past, and we may not be able to generate sufficient net sales to achieve or maintain profitability. Our recent net sales growth may not be sustainable, and a failure to maintain an adequate growth rate will materially and adversely affect our business, financial condition and operating results.
While we achieved profitability on an annual basis for the first time for the fiscal year ended December 29, 2013, we incurred net losses of $10.3 million and $11.3 million in the fiscal year ended December 30, 2012 and the fiscal year ended January 1, 2012, respectively, and had an accumulated deficit of $45.1 million as of December 29, 2013. We anticipate that our operating expenses will increase substantially in the foreseeable future as we continue to invest to increase our customer base, increase the number and variety of products we offer, expand our marketing channels, expand our operations, hire additional employees and managers, incur the costs of being a public company and develop our technology platform and fulfillment infrastructure. These efforts may prove more expensive than we currently anticipate. Although our net sales have grown rapidly, increasing from $331.2 million in the fiscal year ended December 30, 2012 to $695.7 million in the fiscal year ended December 29, 2013, we may not be able to sustain this rate of net sales growth or to increase our net sales sufficiently to offset higher expenses. Some of our efforts to generate net sales from our business are new and unproven, and any failure to increase our net sales or improve our gross margins could prevent us from maintaining or increasing profitability. In addition, we expect to invest to fund longer term initiatives, which will likely impact profitability or other operating results. We cannot be certain that we will be able to maintain or increase profitability on a quarterly or annual basis. If we are unable to effectively manage these risks and difficulties as we encounter them, our business, financial condition and operating results may be materially and adversely affected.
We may be unable to accurately forecast net sales and appropriately plan our expenses in the future.
We may base our current and future expense levels on our operating forecasts and estimates of future net sales and gross margins. Net sales and operating results are difficult to forecast because they generally depend on the volume, timing and type of the orders we receive, all of which are uncertain. Additionally, our business is affected by general economic and business conditions in the United States, and we anticipate that it will be increasingly affected by conditions in international markets. A significant portion of our expenses is fixed, and as a result, we may be unable to adjust our spending in a timely manner to compensate for any unexpected shortfall in net sales. Any failure to accurately predict net sales or gross margins could cause our operating results in any given quarter, or a series of quarters, to be lower than expected, which could cause the price of our Class A common stock to decline substantially.
Our business is highly competitive. Competition presents an ongoing threat to the success of our business.
We expect competition in e-commerce generally, and with companies employing a flash sales model in particular, to continue to increase because there are no significant barriers to entry. We currently compete with and expect to increasingly compete with e-commerce businesses, such as Amazon.com, Inc., the e-commerce platforms of traditional retailers, such as Target Corporation, Toys“R”Us, Inc. and Wal-Mart Stores, Inc., and online marketplaces such as eBay Inc., particularly as some of these companies adopt flash sales business practices. A substantial number of flash sales sites have similar business models in related and unrelated market segments, including Fab, Inc., Gilt Groupe Holdings, Inc., HauteLook (which is owned by Nordstrom, Inc.), MyHabit (which is operated by Amazon.com), One Kings Lane, Inc., Groupon, Inc., Wayfair LLC and RueLaLa.com (which is operated
8
by Retail Convergence.com LP). We also compete with the traditional offline retail industry, including discount and mass merchandisers, such as Target, Toys“R”Us and Walmart, as well as boutique sellers of children’s apparel, women’s apparel, and other product categories, such as toys, infant gear, kitchen accessories and home décor.
We believe that our ability to compete depends upon many factors both within and beyond our control, including:
• | the size of the online retail market; |
• | the size and composition of our customer base and vendor base; |
• | the number of vendors and products we feature on our sites; |
• | selling and marketing efforts; |
• | the quality, price and reliability of products offered either by us or our competitors; |
• | the convenience and entertainment of the shopping experience that we provide; |
• | our ability to cost-effectively source, market and distribute our products and manage our operations; and |
• | our reputation and brand strength relative to our competitors. |
Many of our current competitors have, and potential competitors may have, longer operating histories, larger fulfillment infrastructures, greater technical capabilities, significantly faster shipping times as well as free or low-cost shipping, significantly greater financial, marketing and other resources and larger customer bases than we do. These factors may allow our competitors to derive greater net sales and profits from their existing customer base, acquire customers at lower costs or respond more quickly than we can to new or emerging technologies and changes in consumer habits. These competitors may engage in more extensive research and development efforts, undertake more far-reaching marketing campaigns and adopt more aggressive pricing policies, which may allow them to build larger customer bases or generate net sales from their customer bases more effectively than we do.
We depend on the continued growth of e-commerce in general and the flash sales model in particular.
The business of selling products over the Internet, particularly on the flash sales model, is dynamic and relatively new. The market segment for the flash sales model has grown significantly, and this growth may not be sustainable. If customers cease to find the flash sales model shopping experience fun, entertaining and a good value, or otherwise lose interest in shopping in this manner, we may not acquire new customers at rates consistent with historical or projected periods, and existing customers’ buying patterns and levels may be less than historical or projected rates. If the market segment for the flash sales model were to become saturated or decline overall, we may not be able to acquire new customers or engage existing customers, and our business, financial condition and operating results may suffer.
If we fail to acquire new customers, we may not be able to increase net sales or maintain profitability.
We have made significant investments related to customer acquisition and expect to continue to spend significant amounts to acquire additional customers. We must continue to acquire customers in order to increase net sales and maintain profitability. In order to expand our customer base, we must appeal to and acquire customers who have historically used other means of commerce to purchase products and may prefer alternatives to our offerings, such as in-store, the retailer’s own website or the websites of our competitors. In the United States, where we have achieved some level of market penetration, acquiring new customers may become more difficult and costly than it has been in the past. We cannot assure you that the net sales from new customers we acquire will ultimately exceed the cost of acquiring those customers. If we fail to deliver an entertaining shopping experience, or if consumers do not perceive the products we offer to be of high value and quality, we may not be able to acquire new customers. If we are unable to acquire new customers who purchase products in numbers sufficient to grow our business, the net sales we generate may decrease, and our business, financial condition and operating results may be materially and adversely affected.
We believe that many of our new customers originate from word-of-mouth and other non-paid referrals from existing customers, and therefore we must ensure that our existing customers remain loyal to us in order to continue receiving those referrals. If our efforts to satisfy our existing customers are not successful, we may not be able to acquire new customers in sufficient numbers to continue to grow our business, or we may be required to
9
incur significantly higher marketing expenses in order to acquire new customers. If the level of usage by our customer base declines or does not grow as expected, we may suffer a decline in customer growth or net sales. A significant decrease in the level of usage or customer growth would have a material adverse effect on our business, financial condition and operating results.
We have relationships with social networking sites, such as Facebook, Pinterest, Twitter and Tumblr, online services, search engines, affiliate marketing websites, directories and other websites and e-commerce businesses to provide advertising and other links that direct customers to our sites. As e-commerce and social networking continue to rapidly evolve, we must continue to establish relationships with the channels that are used by our current and prospective customers and cost-effectively drive traffic to our sites. We rely on these relationships as significant sources of traffic to our sites and to generate new customers. If we are unable to develop or maintain these relationships on acceptable terms, our ability to attract new customers and our financial condition would suffer.
We periodically conduct national U.S. television branding and advertising campaigns. Such campaigns are expensive and may not result in the cost-effective acquisition of customers.
We base our decisions regarding expenditures in customer acquisition primarily on our analysis of the net sales generated from customers that we acquired in prior periods. Our estimates and assumptions may not accurately reflect our future results, and we may not be able to recover our customer acquisition costs.
Our success depends on our ability to attract customers in a cost-effective manner. Our decisions regarding investments in customer acquisition substantially depend upon our analysis of the net sales generated from customers we acquired in earlier periods. Our analysis regarding customer acquisition investment and net sales includes several assumptions, such as:
• | Many customers sign-up as subscribers to our sites for varying periods of time before they make their first purchase and become active customers. We make various assumptions with respect to the level of additional marketing or other expenses necessary to activate these subscribers and how these expenses vary from those required to generate subscriptions. If our assumptions regarding such expenses are incorrect, our net sales relative to customer acquisition cost could be less favorable than we believe. |
• | We make various assumptions based on our historical data with respect to the repurchase rates of active customers. If our assumptions regarding such repurchase rates are incorrect, our net sales relative to customer acquisition cost could be less favorable than we believe. |
If our assumptions regarding our customer acquisition investment and resulting net sales from these customers, including those relating to the effectiveness of our marketing expenditures, prove incorrect, our ability to generate net sales from our investments in new customer acquisitions may be less than we have assumed and than we have experienced in the past. In such case, we may need to increase expenses or otherwise alter our strategy, and our business, financial condition and operating results may be materially and adversely affected.
Our sales may be adversely affected if we fail to respond to changes in consumer preferences in a timely manner or are not successful in expanding our product offerings.
Our financial performance depends on our ability to identify, originate and define retail product trends, as well as to anticipate, gauge and react to changing consumer preferences in a timely manner. Our products must appeal to a broad range of moms and other consumers whose preferences cannot be predicted with certainty and are subject to change. Our business fluctuates according to changes in consumer preferences dictated in part by fashion trends, perceived product value and seasonal variations.
We have broadened our product offering beyond children's apparel, to include women’s apparel, toys, infant gear, kitchen accessories, home décor and other categories. We continue to explore additional categories which may be accepted by our target customers. If we offer new products or categories that are not accepted by our customers, our sales may fall short of expectations, our brand and reputation could be adversely affected and we may incur expenses that are not offset by sales. If we expand into new categories, consumer demands may be different, and there is no assurance that the flash sales model will be successful in these new categories. We may make substantial investments in such new categories in anticipation of future net sales. If the launch of a new category requires investments greater than we expect, if we are unable to attract vendors that produce sufficient high quality, value-oriented products or if the sales generated from a new category grow more slowly or produce
10
lower gross margins than we expect, our results of operations could be adversely impacted. Expansion of our product lines may also strain our management and operational resources, specifically the need to hire and manage additional merchandise buyers to source and curate these new products. We may also face greater competition in specific categories from Internet sites that are more focused on such categories. It may be difficult to differentiate our offering from other competitors as we offer additional product categories, and our customers may have additional considerations in deciding whether or not to purchase these additional product categories. In addition, the relative profitability, if any, of new product lines may be lower than what we have experienced historically, and we may not generate sufficient net sales from new product initiatives to recoup our investments in them. If any of these were to occur, it could damage our reputation, limit our growth and have a material adverse effect on our business, financial condition and operating results.
Customer growth and activity on mobile devices depends upon effective use of mobile operating systems, networks and standards that we do not control.
Purchases using mobile devices by consumers generally, and by our customers specifically, have increased significantly, and we expect this trend to continue. To optimize the mobile shopping experience, we are somewhat dependent on our customers downloading our specific mobile applications for their particular device as opposed to accessing our sites from an Internet browser on their mobile device. As new mobile devices and platforms are released, it is difficult to predict the problems we may encounter in developing applications for these alternative devices and platforms, and we may need to devote significant resources to the creation, support and maintenance of such applications. In addition, our future growth and our results of operations could suffer if we experience difficulties in the future in integrating our mobile applications into mobile devices or if problems arise with our relationships with providers of mobile operating systems or mobile application download stores, such as those of Apple Inc. or Google Inc., if our applications receive unfavorable treatment compared to competing applications, such as the order of our products in the Apple AppStore, or if we face increased costs to distribute or have customers use our mobile app. We are further dependent on the interoperability of our sites with popular mobile operating systems that we do not control, such as iOS and Android, and any changes in such systems that degrade the functionality of our sites or give preferential treatment to competitive products could adversely affect the usage of our sites on mobile devices. In the event that it is more difficult for our customers to access and use our sites on their mobile devices, or if our customers choose not to access or to use our sites on their mobile devices or to use mobile products that do not offer access to our sites, our customer growth could be harmed and our business, financial condition and operating results may be materially and adversely affected.
Our business depends on a strong brand. We may not be able to maintain and enhance our brand, or we may receive unfavorable customer complaints or negative publicity, which could adversely affect our brand.
We believe that the brand we have built with our customers has significantly contributed to the success of our business. We also believe that maintaining and enhancing the “zulily” brand is critical to expanding our base of customers and vendors. Maintaining and enhancing our brand may require us to make substantial investments, and these investments may not be successful. If we fail to promote and maintain the “zulily” brand or if we incur excessive expenses in this effort, our business, operating results and financial condition may be materially and adversely affected. We anticipate that, as our market becomes increasingly competitive, maintaining and enhancing our brand may become increasingly difficult and expensive. Maintaining and enhancing our brand will depend largely on our ability to continue to provide reliable, trustworthy and high quality products to our customers and a reliable, trustworthy and profitable market to our vendors, which we may not do successfully.
Our brand depends on effective customer support, which requires significant personnel expense. If not managed properly, this expense could impact our profitability. Failure to manage or train our own or outsourced customer support representatives properly could compromise our ability to handle customer complaints effectively.
Customer complaints or negative publicity about our sites, products, product delivery times, customer data handling and security practices or customer support, especially on social media platforms such as blogs and social media websites, could rapidly and severely diminish consumer use of our sites and consumer and vendor confidence in us and cause our reputation to suffer.
Uncertainties in global economic conditions and their impact on consumer spending patterns, particularly in the apparel, toys, infant gear, kitchen accessories and home décor segments, could adversely impact our operating results.
11
Our performance is subject to global economic conditions and their impact on levels of consumer spending worldwide, particularly spending on children and women’s apparel, toys, infant gear, kitchen accessories and home décor. Some of the factors adversely affecting consumer spending include levels of unemployment, consumer debt levels, changes in net worth based on market changes and uncertainty, home foreclosures and changes in home values, fluctuating interest rates, credit availability, government actions, fluctuating fuel and other energy costs, fluctuating commodity prices and general uncertainty regarding the overall future economic environment. Consumer purchases of discretionary items, including our merchandise, generally decline during periods when disposable income is adversely affected or there is economic uncertainty. Adverse economic changes in any of the regions in which we sell our products could reduce consumer confidence and could negatively affect net sales and have a material adverse effect on our operating results.
Our business is subject to seasonal sales fluctuations which could result in volatility or have an adverse effect on the market price of our Class A common stock.
We believe our results are impacted by a pattern of increased sales during the back-to-school shopping season in the third quarter and holiday shopping season in the fourth quarter which has resulted in increased sales during a portion of the third quarter and the fourth quarter each fiscal year, which then results in lower sequential growth in the first quarter. For example, net sales in the first quarter of 2013 decreased when compared with net sales in the fourth quarter of 2012. We also believe that we have experienced slower growth in orders placed during the late spring and early summer months. Shifts in product mix, when combined with seasonality, could further affect our overall operating results or growth rates. Our historical growth rates and limited operating history make it difficult to discern the impact of any seasonality in our business. To the extent the growth of our business slows, or our product mix changes, these seasonal fluctuations may become more evident. Seasonality may cause our working capital cash flow requirements to vary from quarter-to-quarter depending on the variability in the volume and timing of sales. These factors, among other things, make forecasting more difficult and may adversely affect our ability to manage working capital and to predict financial results accurately, which could result in volatility or adversely affect the market price of our Class A common stock.
Failure to continue to provide our customers with differentiated merchandise from vendors will harm our business.
Our net sales growth depends, in part, on our ability to continue to source unique merchandise in sufficient quantities at competitive prices from vendors. Offering a variety of brands, styles, categories and products at affordable price points is important to our ability to acquire new customers and to keep our existing customers engaged and purchasing products. Typically, our events feature thousands of product styles from different vendors and last for 72 hours, and we believe our business requires us to continue this rapid pace of product introduction. Growth in the number of our customers, as well as increased competition, may make it difficult to source additional brands and styles in sufficient quantities and on acceptable terms to meet the demand of our customers. Since launching our sites, we have purchased our merchandise from thousands of brands, with a particular focus on emerging brands and smaller boutique vendors. We believe our ability to offer our customers a high volume of merchandise from emerging brands and smaller boutique vendors is particularly important to our long-term success.
We have few contractual assurances of continued supply, no contractual assurances of pricing or access to new products, and vendors could change the terms upon which they sell to us or discontinue selling to us for future sales at any time. As we grow, continuing to identify a sufficient number of new emerging brands and smaller boutique vendors may become more and more of a challenge. If we are not able to identify and effectively promote these new brands, we may lose customers to our competitors. Even if we identify new vendors, we may not be able to purchase desired merchandise in sufficient quantities on terms acceptable to us in the future, and products from alternative sources, if any, may be of a lesser quality or more expensive than those from existing vendors. In addition, larger national brands may offer products that are less unique, and it may be easier for our competitors to offer such products at prices or upon terms that may be compelling to consumers. An inability to purchase suitable merchandise on acceptable terms or to source new vendors could have a material adverse effect on our business, financial condition and operating results.
Our merchandise approach and the flash sales model is challenging and, if not managed effectively, could adversely affect our operating results.
To support our large and diverse base of vendors and our flash sales model which requires constantly changing products, we must incur significant costs, including costs related to our merchandising team, photography
12
studios and creative personnel. As our business grows, we may not be able to continue to expand our product offerings in a cost-effective manner. Expanding personnel in our merchandising and studio departments is challenging due to competition for such personnel, and expansion of our studio spaces may require fixed expenses and investments that will impact profitability and may not be recouped if sufficient additional net sales are not generated.
In addition, the variety in size and sophistication of our vendors presents different challenges to our infrastructure and operations. Our emerging brands and smaller boutique vendors may be less experienced in manufacturing and shipping, which in the past has lead to inconsistencies in quality, delays in the delivery of merchandise or additional fulfillment cost. Our larger national brands may impose additional requirements on us or offer less favorable terms than our smaller vendors related to margins and inventory ownership and risk. If we are unable to maintain and effectively manage our relationships with our emerging brands and smaller boutique vendors or our larger national brands, our business, financial condition and operating results could be materially and adversely affected.
Failure of our vendors to supply high quality and compliant merchandise in a timely manner may damage our reputation and brand and harm our business.
We depend on our vendors to supply high quality merchandise in a timely manner. The failure of these vendors to supply merchandise which meets our quality standards or the quality standards of our customers could damage our reputation and harm our business, financial condition and operating results.
Our vendors are subject to various risks, including raw material costs, inflation, labor disputes, union organizing activities, boycotts, financial liquidity, product merchantability, safety issues, inclement weather, natural disasters, disruptions in exports, trade restrictions, trade disruptions, currency fluctuations and general economic and political conditions that could limit the ability of our vendors to provide us with high quality merchandise on a timely basis and at prices and payment terms that are commercially acceptable. For these or other reasons, one or more of our vendors might not adhere to our vendor terms and conditions or their applicable contract or might stop providing us with high quality merchandise. If there are any deficiencies in the products our vendors have provided to us, we might not identify such deficiencies before products ship to our customers.
In addition, our vendors may have difficulty adjusting to our changing demands and growing business. Failure of our vendors to provide us with quality merchandise that complies with all applicable laws, including but not limited to product safety regulations and legislation, in a timely and effective manner could damage our reputation and brand and could lead to an increase in customer litigation against us and an increase in our routine and non-routine litigation costs. Further, any merchandise could become subject to a recall, regulatory action or legal claim, which could result in increased legal expenses as well as damage to our reputation and brand and harm to our business. We cannot predict whether any of the countries in which our merchandise currently is manufactured or may be manufactured in the future will be subject to additional trade restrictions imposed by the United States and other foreign governments, including the likelihood, type or effect of any such restrictions. Such developments could have a material adverse effect on our business, financial condition and operating results.
Any failure by our vendors to comply with product safety, labor or other laws, or our standard vendor terms and conditions or to provide safe factory conditions for their workers, may damage our reputation and brand and harm our business.
Many of the products we sell on our sites are subject to regulation by the Federal Consumer Product Safety Commission, the Federal Food and Drug Administration and similar state and international regulatory authorities. As a result, such products have been and could be in the future subject to recalls and other remedial actions. Many of the products we sell are for children, and these products are often subject to enhanced safety concerns and additional scrutiny and regulation. Product safety concerns may require us to voluntarily remove selected products from our sites. Such recalls and voluntary removal of products can result in, among other things, lost sales, diverted resources, potential harm to our reputation and increased customer service costs and legal expenses, which could have a material adverse effect on our business, financial condition and operating results.
Some of the products we sell may expose us to product liability claims and litigation or regulatory action relating to personal injury, death or environmental or property damage. Although we maintain liability insurance, we cannot be certain that our coverage will be adequate for liabilities actually incurred or that insurance will continue to be available to us on economically reasonable terms, or at all. In addition, some of our agreements with our
13
vendors may not indemnify us from product liability for a particular vendor’s products, or our vendors may not have sufficient resources or insurance to satisfy their indemnity and defense obligations.
We purchase our merchandise from numerous domestic and international manufacturers. Our standard vendor terms and conditions require vendors to comply with applicable laws. Failure of our vendors to comply with applicable laws and regulations and contractual requirements could lead to litigation against us, resulting in increased legal expenses and costs. In addition, the failure of any such vendors to provide safe and humane factory conditions and oversight at their facilities could damage our reputation with consumers or result in legal claims against us.
If we do not successfully optimize, operate and manage the expansion of capacity of our fulfillment centers, our business, financial condition and operating results could be harmed.
If we do not optimize and operate our fulfillment centers successfully and efficiently, it could result in excess or insufficient fulfillment capacity, an increase in costs or impairment charges or harm our business in other ways. We have very limited experience designing and operating fulfillment centers. In addition, if we do not have sufficient fulfillment capacity or experience a problem fulfilling orders in a timely manner, our customers may experience delays in receiving their purchases, which could harm our reputation and our relationship with our customers.
We depend on a third party to provide staffing for our U.S. fulfillment centers. By using a third-party staffing organization, we face additional risks that are outside of our control, such as employment claims, issues arising from failure to comply with labor or other laws, union organizing activities and any deterioration in the finance and operations of such organization. If our third-party staffing organization is unable to adequately staff our fulfillment centers or if the cost of such staffing is higher than historical or projected costs, our operations could be harmed. In 2014, we anticipate staffing our U.S. fulfillment centers, in part, with our employees. If we do not effectively integrate these employees into our U.S. fulfillment centers or transition staffing from the third party staffing organization, or if the cost of such employees is higher than historical or projected costs, our operations could be harmed. Outside of the United States, we depend on a third party to provide fulfillment services, and we face similar risks with that third party.
We have designed and built our own fulfillment center infrastructure, including customizing third-party inventory and package handling software systems, which is tailored to meet the specific needs of our business. If we continue to add fulfillment and warehouse capabilities, add new businesses or categories with different fulfillment requirements or change the mix in products that we sell, our fulfillment network will become increasingly complex and operating it will become more challenging. For example, in our prior outsourced third-party fulfillment center, operational difficulties were encountered as our shipping volumes increased dramatically, which resulted in shipping delays and customer dissatisfaction. Failure to successfully address such challenges in a cost-effective and timely manner could impair our ability to timely deliver our customers’ purchases and could harm our reputation and ultimately, our business, financial condition and operating results.
Our current fulfillment center network has the capability to handle limited growth with the current mix of product offerings before additional capacity will be required. We need to add additional fulfillment center capacity by late 2014, and have entered into a lease for a new fulfillment center in McCarran, Nevada. The expansion of our fulfillment center capacity will put pressure on our managerial, financial, operational, technology and other resources. We cannot assure you that the new fulfillment center will be timely constructed, that we will effectively transition to the new facility, that our customized inventory and package handling software systems meet our business needs, or that will be able to execute on our expansion plans, or recruit qualified managerial and operational personnel necessary to support our expansion plans. If we are unable to expand our fulfillment operations and increase fulfillment center capacity or to effectively control expansion-related expenses, our business, prospects, financial condition and operating results could be materially and adversely affected. If we grow faster than we anticipate, we may exceed our fulfillment center capacity sooner than we anticipate, we may experience problems fulfilling orders in a timely manner or our customers may experience delays in receiving their purchases, which could harm our reputation and our relationship with our customers, and we would need to increase our capital expenditures more than anticipated. Many of the expenses and investments with respect to our fulfillment centers are fixed, and any expansion of such fulfillment centers will require additional investment of capital. We expect to incur higher capital expenditures in the future for our fulfillment center operations. We may incur such expenses or make such investments in advance of expected sales, and such expected sales may not occur.
14
We generally do not hold inventory until products have been ordered by customers, which results in slower delivery time than other e-commerce retailers.
We generally do not order inventory from our vendors to be held in our fulfillment centers until after the products have been ordered by our customers. As a result, the time from when an order is placed on our sites to when the product is delivered to our customers is longer than for many other e-commerce retailers who generally carry significant inventory that enables them to expedite delivery. Our relatively slower delivery times may place us at a competitive disadvantage to other e-commerce retailers. If we are required to decrease our delivery times to address this competition or to meet customer demands, we may be required to incur additional shipping costs, which we may or may not be able to pass on to our customers, or to change our operations to carry additional inventory and face additional inventory risk, either of which could adversely affect our business, financial condition and operating results.
Our business relies heavily on email and other messaging services, and any restrictions on the sending of emails or messages or an inability to timely deliver such communications could adversely affect our net sales and business.
Our business is highly dependent upon email and other messaging services for promoting our sites and products. We provide daily emails and mobile alerts to subscribers informing them of what is available for purchase on our sites that day, and we believe these emails are an important part of our customer experience and help generate a substantial portion of our net sales. If we are unable to successfully deliver emails or other messages to our subscribers, or if subscribers decline to open our emails or messages, our net sales and profitability would be adversely affected. Changes in how webmail applications organize and prioritize email may reduce the number of subscribers opening our emails. For example, Google Inc.’s Gmail service introduced features that organize incoming emails into categories (for example, primary, social and promotions). Such categorization or similar inbox organizational features may result in our emails being delivered in a less prominent location in a subscriber’s inbox or viewed as “spam” by our subscribers and may reduce the likelihood of that subscriber opening our emails. Actions by third parties to block, impose restrictions on or charge for the delivery of emails or other messages could also materially and adversely impact our business. From time to time, Internet service providers or other third parties may block bulk email transmissions or otherwise experience technical difficulties that result in our inability to successfully deliver emails or other messages to third parties. Changes in the laws or regulations that limit our ability to send such communications or impose additional requirements upon us in connection with sending such communications would also materially and adversely impact our business. Our use of email and other messaging services to send communications about our sites or other matters may also result in legal claims against us, which may cause us increased expenses, and if successful might result in fines and orders with costly reporting and compliance obligations or might limit or prohibit our ability to send emails or other messages. We also rely on social networking messaging services to send communications and to encourage customers to send communications. Changes to the terms of these social networking services to limit promotional communications, any restrictions that would limit our ability or our customers’ ability to send communications through their services, disruptions or downtime experienced by these social networking services or decline in the use of or engagement with social networking services by customers and potential customers could materially and adversely affect our business, financial condition and operating results.
We rely on a third-party service for the delivery of all our daily emails, and delay or errors in the delivery of such emails or other messaging we send may occur and are beyond our control. For example, the delivery of our daily emails to subscribers has previously been delayed by two hours as a result of a third-party service error. We have also experienced technical issues that have resulted in shorter delivery delays of our daily emails to subscribers. Such delays could occur again in the future or be more severe, which could result in damage to our reputation or harm our business, financial condition and operating results. If we were unable to use our current email service or other messaging services, alternate services are available; however, we believe our sales could be impacted for some period as we transition to a new provider. Any disruption or restriction on the distribution of our emails or other messages, termination or disruption of our relationship with our messaging service providers, including our third-party service that delivers our daily emails, or any increase in our costs associated with our email and other messaging activities could materially and adversely affect our business, financial condition and operating results.
We may choose to expand or alter our operations by developing new sites or applications or by promoting new or complementary products, sales formats or services, which may increase our costs and may not be successful.
15
There can be no assurance that we will be able to expand or alter our operations in a cost-effective or timely manner or that any such efforts would be accepted by the market. Furthermore, any new business, website, application, product, promotion, sales format or service launched by us that is not favorably received by consumers could damage our reputation and brand. Any such expansion or alteration of our operations could also require significant additional expenses, management time and operations personnel that could impact our operating results. Any failure to generate satisfactory net sales from such expansion or alteration of our operations to offset their cost could have a material adverse effect on our business, financial condition and operating results.
We are subject to payment-related risks.
We accept payments using a variety of methods, including credit card, debit card, PayPal and gift cards. As we offer new payment options to consumers, we may be subject to additional regulations, compliance requirements and fraud. For certain payment methods, including credit and debit cards, we pay interchange and other fees, which may increase over time and raise our operating costs and lower profitability. We are also subject to payment card association operating rules and certification requirements, including the Payment Card Industry Data Security Standard and rules governing electronic funds transfers, which could change or be reinterpreted to make it difficult or impossible for us to comply. If we fail to comply with the rules or requirements of any provider of a payment method we accept, among other things, we may be subject to fines or higher transaction fees and may lose, or face restrictions placed upon, our ability to accept credit and debit card payments from consumers or facilitate other types of online payments. If any of these events were to occur, our business, financial condition and operating results could be materially and adversely affected.
We also may incur significant losses from fraud. We may incur losses from claims that the consumer did not authorize the purchase, from merchant fraud, from erroneous transmissions and from consumers who have closed bank accounts or have insufficient funds in them to satisfy payments. In addition to the direct costs of such losses, if they are related to credit card transactions and become excessive, they could potentially result in our losing the right to accept credit cards for payment. In addition, under current credit card practices, we are liable for fraudulent credit card transactions because we do not obtain a cardholder’s signature. We do not currently carry insurance against this risk. To date, we have experienced minimal losses from credit card fraud, but we continue to face the risk of significant losses from this and other types of fraud. Our failure to adequately control fraudulent transactions could damage our reputation and brand and result in litigation or regulatory action, causing an increase in legal expenses and fees and substantially harm our business, financial condition and operating results.
Government regulation of the Internet and e-commerce is evolving, and unfavorable changes or failure by us to comply with these regulations could substantially harm our business and results of operations.
We are subject to general business regulations and laws as well as regulations and laws specifically governing the Internet and e-commerce. Existing and future regulations and laws could impede the growth of the Internet, e-commerce or mobile commerce. These regulations and laws may involve taxes, tariffs, privacy and data security, anti-spam, content protection, electronic contracts and communications, consumer protection and gift cards. It is not clear how existing laws governing issues such as property ownership, sales and other taxes and consumer privacy apply to the Internet as the vast majority of these laws were adopted prior to the advent of the Internet and do not contemplate or address the unique issues raised by the Internet or e-commerce. It is possible that general business regulations and laws, or those specifically governing the Internet or e-commerce, may be interpreted and applied in a manner that is inconsistent from one jurisdiction to another and may conflict with other rules or our practices. We cannot guarantee that our practices have complied, comply or will comply fully with all such laws and regulations. Any failure, or perceived failure, by us to comply with any of these laws or regulations could result in damage to our reputation, a loss in business and proceedings or actions against us by governmental entities or others. Any such proceeding or action could hurt our reputation, force us to spend significant amounts in defense of these proceedings, distract our management, increase our costs of doing business, decrease the use of our sites by consumers and vendors and may result in the imposition of monetary liability. We may also be contractually liable to indemnify and hold harmless third parties from the costs or consequences of non-compliance with any such laws or regulations. In addition, it is possible that governments of one or more countries may seek to censor content available on our sites or may even attempt to completely block access to our sites. Adverse legal or regulatory developments could substantially harm our business. In particular, in the event that we are restricted, in whole or in part, from operating in one or more countries, our ability to retain or increase our customer base may be adversely affected, and we may not be able to maintain or grow our net sales and expand our business as anticipated.
16
Failure to comply with federal, state and international laws and regulations relating to privacy, data protection and consumer protection, or the expansion of current or the enactment of new laws or regulations relating to privacy, data protection and consumer protection, could adversely affect our business and our financial condition.
A variety of federal, state and international laws and regulations govern the collection, use, retention, sharing and security of consumer data. Laws and regulations relating to privacy, data protection and consumer protection are evolving and subject to potentially differing interpretations. We strive to comply with all applicable laws, regulations and other legal obligations relating to privacy, data protection and consumer protection, including those relating to the use of data for marketing purposes. It is possible, however, that these requirements may be interpreted and applied in a manner that is inconsistent from one jurisdiction to another or may conflict with other rules or our practices. We cannot guarantee that our practices have complied, comply or will comply fully with all such laws, regulations, requirements and obligations. Any failure, or perceived failure, by us to comply with our posted privacy practices or with any federal, state or international privacy or consumer protection-related laws, regulations, industry self-regulatory principles, industry standards or codes of conduct, regulatory guidance, orders to which we may be subject or other legal obligations relating to privacy or consumer protection could adversely affect our reputations, brand and business, and may result in claims, proceedings or actions against us by governmental entities or others or other liabilities. Any such claim, proceeding or action could hurt our reputation, brand and business, force us to incur significant expenses in defense of such proceedings, distract our management, increase our costs of doing business, result in a loss of customers and vendors and may result in the imposition of monetary liability. We may also be contractually liable to indemnify and hold harmless third parties from the costs or consequences of non-compliance with any laws, regulations or other legal obligations relating to privacy or consumer protection or any inadvertent or unauthorized use or disclosure of data that we store or handle as part of operating our business.
Federal, state and international governmental authorities continue to evaluate the privacy implications inherent in the use of third-party “cookies”, "web beacons", and other methods of online tracking for behavioral advertising and other purposes. U.S. and foreign governments have enacted, considered or are considering legislation or regulations that could significantly restrict the ability of companies and individuals to engage in these activities, such as by regulating the level of consumer notice and consent required before a company can employ cookies or other electronic tracking tools. Additionally, some providers of consumer devices and web browsers have implemented, or announced plans to implement, means to make it easier for Internet users to prevent the placement of cookies,web beacons, or to block other tracking technologies, which could if widely adopted result in the use of third-party cookies,web beacons, and other methods of online tracking becoming significantly less effective. The regulation of the use of these cookies, web beacons, and other current online tracking and advertising practices or a loss in our ability to make effective use of services that employ such practices could increase our costs of operations and limit our ability to acquire new customers on cost-effective terms and consequently, materially and adversely affect our business, financial condition and operating results.
Foreign data protection, privacy and other laws and regulations are often more restrictive than those in the United States. The European Union, for example, traditionally has imposed stricter obligations under its laws and regulations relating to privacy, data protection and consumer protection than the United States. Individual EU member countries have had discretion with respect to their interpretation and implementation of these laws, resulting in variation of privacy standards from country to country. Legislation and regulation in the European Union and some EU member states require companies to obtain specific types of notice and consent from consumers before using cookies or other tracking technologies. International expansion of our operations may require changes in the way we use consumer information in operating our business. Compliance with such laws and regulations will result in additional costs and may necessitate changes to our business practices, which may adversely affect our business and financial condition. Further, there is no harmonized approach to legal compliance in many of these regions, and there is little regulatory guidance. Consequently, we could be at risk of non-compliance with applicable foreign data protection laws as we continue our international expansion.
In addition, various federal, state and foreign legislative and regulatory bodies, or self-regulatory organizations, may expand current laws or regulations, enact new laws or regulations or issue revised rules or guidance regarding privacy, data protection and consumer protection. Any such changes may force us to incur substantial costs or require us to change our business practices. This could compromise our ability to pursue our growth strategy effectively and may adversely affect our ability to acquire customers or otherwise harm our business, financial condition and operating results.
17
Our failure or the failure of third-party service providers to protect our sites, networks and systems against security breaches, or otherwise to protect our confidential information, could damage our reputation and brand and substantially harm our business and operating results.
Our business employs sites, networks and systems through which we collect, maintain, transmit and store data about our customers, vendors and others, including credit card information and personally identifiable information, as well as other confidential and proprietary information. We also employ third-party service providers that store, process and transmit proprietary, personal and confidential information on our behalf. We rely on encryption and authentication technology licensed from third parties in an effort to securely transmit confidential and sensitive information, including credit card numbers. Advances in computer capabilities, new technological discoveries or other developments may result in the whole or partial failure of this technology to protect transaction data or other confidential and sensitive information from being breached or compromised. More generally, we take steps to protect the security, integrity and confidentiality of the information we collect, store or transmit, but there is no guarantee that inadvertent or unauthorized use or disclosure will not occur or that third parties will not gain unauthorized access to this information despite our efforts. Our security measures, and those of our third-party service providers, may not detect or prevent all attempts to hack our systems, denial-of-service attacks, viruses, malicious software, break-ins, phishing attacks, social engineering, security breaches or other attacks and similar disruptions that may jeopardize the security of information stored in or transmitted by our sites, networks and systems or that we or our third-party service providers otherwise maintain. We and our service providers may not have the resources or technical sophistication to anticipate or prevent all types of attacks, and techniques used to obtain unauthorized access to or sabotage systems change frequently and may not be known until launched against us or our third-party service providers. In addition, security breaches can also occur as a result of non-technical issues, including intentional or inadvertent breaches by our employees or by persons with whom we have commercial relationships.
Breaches of our security measures or those of our third-party service providers or cyber security incidents could result in unauthorized access to our sites, networks and systems; unauthorized access to and misappropriation of consumer information, including consumers’ personally identifiable information, or other confidential or proprietary information of ourselves or third parties; viruses, worms, spyware or other malware being served from our sites, networks or systems; deletion or modification of content or the display of unauthorized content on our sites; interruption, disruption or malfunction of operations; costs relating to breach remediation, deployment of additional personnel and protection technologies, response to governmental investigations and media inquiries and coverage; engagement of third party experts and consultants; litigation, regulatory action and other potential liabilities. If any of these breaches of security occur, our reputation and brand could be damaged, our business may suffer, we could be required to expend significant capital and other resources to alleviate problems caused by such breaches and we could be exposed to a risk of loss, litigation or regulatory action and possible liability. Actual or anticipated attacks may cause us to incur increasing costs, including costs to deploy additional personnel and protection technologies, train employees and engage third-party experts and consultants. In addition, any party who is able to illicitly obtain a subscriber’s password could access the subscriber’s transaction data or personal information. Any compromise or breach of our security measures, or those of our third-party service providers, could violate applicable privacy, data security and other laws, and cause significant legal and financial exposure, adverse publicity and a loss of confidence in our security measures, which could have an adverse and material effect on our business, financial condition and operating results. Although we maintain privacy, data breach and network security liability insurance, we cannot be certain that our coverage will be adequate for liabilities actually incurred or that insurance will continue to be available to us on economically reasonable terms, or at all. We may need to devote significant resources to protect against security breaches or to address problems caused by breaches, diverting resources from the growth and expansion of our business.
Changes in tax treatment of companies engaged in e-commerce may adversely affect the commercial use of our sites and our financial results.
Due to the global nature of the Internet, it is possible that various states or foreign countries might attempt to impose additional or new regulation on our business or levy additional or new sales, income or other taxes relating to our activities. Tax authorities at the international, federal, state and local levels are currently reviewing the taxation of e-commerce companies and transactions of companies engaged in e-commerce. New or revised international, federal, state or local tax regulations may subject us or our customers to additional sales, income and other taxes. We cannot predict the effect of current attempts to impose sales, income or other taxes on e-commerce. New or revised taxes and, in particular, sales taxes, VAT and similar taxes would likely increase the cost of doing business online and decrease the attractiveness of advertising and selling products over the Internet. New taxes could also create significant increases in internal costs necessary to capture data and collect and remit taxes.
18
Any of these events could have a material and adverse effect on our business, financial condition and operating results.
Taxing authorities may successfully assert that we should have collected or in the future should collect sales and use, VAT or similar taxes, and we could be subject to liability with respect to past or future sales, which could adversely affect our operating results.
We do not collect sales and use, VAT and similar taxes in all jurisdictions in which we have sales, based on our belief that such taxes are not applicable. Sales and use, VAT and similar tax laws and rates vary greatly by jurisdiction. Certain jurisdictions in which we do not collect such taxes on our sales may assert that such taxes are applicable, which could result in tax assessments, penalties and interest, and we may be required to collect such taxes in the future. Such tax assessments, penalties and interest or future requirements may materially and adversely affect our business, financial condition and operating results.
We may experience fluctuations in our tax obligations and effective tax rate, which could materially and adversely affect our operating results.
We are subject to taxes in the United States and numerous international jurisdictions. We record tax expense based on current tax payments and our estimates of future tax payments, which may include reserves for estimates of probable settlements of international and domestic tax audits. At any one time, multiple tax years and jurisdictions are subject to audit by various taxing authorities. The results of these audits and negotiations with taxing authorities may affect the ultimate settlement of these issues. As a result, we expect that throughout the year there could be ongoing variability in our quarterly tax rates as taxable events occur and uncertain tax positions are re-evaluated. Further, our effective tax rate in a given financial statement period may be materially impacted by changes in tax laws, changes in the mix and level of earnings by taxing jurisdiction, changes to existing accounting rules or regulations or by changes to our ownership or capital structures. Fluctuations in our tax obligations and effective tax rate could materially and adversely affect our results of business, financial condition and operating results.
In addition, we are evaluating and may adopt a corporate structure to more closely align with our international operations and any future international expansion, which will require us to incur expenses but could fail to achieve the intended benefits. This proposed corporate structure may result in a reduction in our overall effective tax rate through changes in how we use our intellectual property, international procurement and sales operations. This proposed corporate structure may also allow us to obtain financial and operational efficiencies. If we adopt this revised structure, it will require us to incur expenses in the near term for which we may not realize related benefits. If the intended structure is not accepted by the applicable taxing authorities, changes in domestic and international tax laws negatively impact the proposed structure, including proposed legislation to reform U.S. taxation of international business activities or we do not operate our business consistent with the proposed structure and applicable tax provisions, we may fail to achieve the financial and operational efficiencies that we anticipate as a result of the proposed structure, and our business, financial condition and operating results may be materially and adversely affected.
Our business depends on network and mobile infrastructure, our single third-party data center hosting facility, other third-party providers and our ability to maintain and scale our technology. Any significant interruptions or delays in service on our sites or any undetected errors or design faults could result in limited capacity, reduced demand, processing delays and loss of customers or vendors.
A key element of our strategy is to generate a high volume of traffic on, and use of, our sites. Our reputation and ability to acquire, retain and serve our customers are dependent upon the reliable performance of our sites and the underlying network infrastructure. As our customer base and the amount of information shared on our sites continue to grow, we will need an increasing amount of network capacity and computing power. We have spent and expect to continue to spend substantial amounts on data centers and equipment and related network infrastructure to handle the traffic on our sites. The operation of these systems is expensive and complex and could result in operational failures. In the event that our customer base or the amount of traffic on our sites grows more quickly than anticipated, we may be required to incur significant additional costs to enhance the underlying network infrastructure. Interruptions or delays in these systems, whether due to system failures, computer viruses, physical or electronic break-ins, undetected errors, design faults or other unexpected events or causes, could affect the security or availability of our sites and prevent our customers from accessing our sites.
19
We depend on the development and maintenance of the Internet and mobile infrastructure. This includes maintenance of reliable Internet and mobile networks with the necessary speed, data capacity and security, as well as timely development of complementary products, for providing reliable Internet and mobile access and services.
We currently utilize a single third-party data center hosting facility located in the United States. Nearly all of our data storage and analytics are conducted on, and the data and content we create associated with sales on our sites are processed through, servers in this facility. As we transition to additional servers, failure to effectively transfer our data could result in interruptions in the availability or functionality of our sites. We also rely on third-party email service providers, bandwidth providers, Internet service providers and mobile networks to deliver our email and “push” communications to subscribers and to allow subscribers to access our sites. Any damage to, or failure of, the systems of our third-party data center or our other third-party providers could result in interruptions to the availability or functionality of our sites. If for any reason our arrangements with our data center or third-party providers are terminated or interrupted, such termination or interruption could adversely affect our business. We exercise little control over these providers, which increases our vulnerability to problems with the services they provide. We could experience additional expense in arranging for new facilities, technology, services and support. In addition, the failure of our data center or any other third-party providers to meet our capacity requirements could result in interruptions in the availability or functionality of our sites.
The occurrence of a natural disaster, an act of terrorism, vandalism or sabotage, a decision to close the third-party data center on which we normally operate or the facilities of any third-party provider without adequate notice or other unanticipated problems at these facilities could result in lengthy interruptions in the availability of our solutions. While we have some limited disaster recovery arrangements in place, they have not been tested under actual disasters or similar events and may not effectively permit us to continue to provide our products in the event of any problems with respect to our data center or any other third-party facilities. To date, we have not experienced these types of events, but we cannot provide any assurances that they will not occur in the future. If any such event were to occur to our business, the delivery of our products could be impaired and our business, financial condition and operating results may be materially and adversely affected.
We may from time to time pursue acquisitions, which could have an adverse impact on our business, as could the integration of the businesses following acquisition.
As part of our business strategy, we may acquire other companies or businesses. Acquisitions involve numerous risks, any of which could harm our business, including: difficulties in integrating the technologies, operations, existing contracts and personnel of an acquired company; difficulties in supporting and transitioning vendors, if any, of an acquired company; diversion of financial and management resources from existing operations or alternative acquisition opportunities; failure to realize the anticipated benefits or synergies of a transaction; failure to identify all of the problems, liabilities or other shortcomings or challenges of an acquired company or technology, including issues related to intellectual property, regulatory compliance practices, revenue recognition or other accounting practices or employee or customer issues; risks of entering new markets in which we have limited or no experience; potential loss of key employees, customers and vendors from either our current business or an acquired company’s business; inability to generate sufficient net sales to offset acquisition costs; additional costs or equity dilution associated with funding the acquisition; and possible write-offs or impairment charges relating to acquired businesses.
Growing and expanding of our international operations will require management attention and resources, involves additional risks, and may be unsuccessful, which could harm our future business development and existing domestic operations.
We have conducted limited international operations in the United Kingdom but plan to grow our current United Kingdom operations and to further expand into international markets in order to grow our business. These growth and expansion plans will require management attention and resources and may be unsuccessful. We have limited experience in selling our products to conform to different local cultures, standards and policies, and the flash sales model we employ and the products we offer may not appeal to customers in the same manner, if at all, in the United Kingdom and other geographies. In addition, we may need to vary our practices in ways with which we have limited or no experience or which are less profitable or carry more risk to us. For example, we permit customer returns in the United Kingdom and expect that we may be required to adopt similar policies in other jurisdictions. We may have to compete with local companies which understand the local market better than we do. In addition, to deliver satisfactory performance for customers in international locations, it may be necessary to locate physical facilities, such as fulfillment centers in foreign markets, and we may have to invest in these facilities before the success or lack thereof of our foreign operations. We have limited experience establishing such facilities overseas.
20
We may not be successful in growing our United Kingdom operations and expanding into any other international markets or in generating net sales from foreign operations. Furthermore, different privacy, censorship, liability, intellectual property and other laws and regulations in foreign countries may cause our business, financial condition and operating results to be materially and adversely affected.
Our future results could be adversely affected by a number of factors inherent in international operations, including:
• | localization of our product offerings, including compliance with product safety regulatory schemes as well as translation into foreign languages and adaptation for local practices; |
• | different consumer demand dynamics, which may make the flash sales model less successful compared to the United States; |
• | unexpected changes in regulatory requirements, taxes, trade laws, tariffs, export quotas, custom duties or other trade restrictions; |
• | differing labor regulations where labor laws may be more advantageous to employees as compared to the United States; |
• | more stringent regulations relating to data security and the unauthorized use of, or access to, commercial and personal information, particularly in the European Union; |
• | reluctance to allow personally identifiable data related to non-U.S. citizens to be stored in databases within the United States, due to concerns over the U.S. government’s right to access information in these databases or other concerns; |
• | changes in a specific country’s or region’s political or economic conditions; |
• | challenges inherent in efficiently managing an increased number of employees over large geographic distances, including the need to implement appropriate systems, policies, benefits and compliance programs; |
• | risks resulting from changes in currency exchange rates; |
• | limitations on our ability to reinvest earnings from operations in one country to fund the capital needs of our operations in other countries; |
• | different or lesser intellectual property protection; and |
• | exposure to liabilities under anti-corruption and anti-money laundering laws, including the U.S. Foreign Corrupt Practices Act and similar laws and regulations in other jurisdictions. |
Operating internationally requires significant management attention and financial resources. We cannot be certain that the investment and additional resources required to establish and expand our international operations will produce desired levels of net sales or profitability. If we invest substantial time and resources to establish and expand our international operations and are unable to do so successfully and in a timely manner, our business, financial condition and operating results may be materially and adversely affected.
We rely on the performance of members of management and highly skilled personnel, and if we are unable to attract, retain and motivate well-qualified employees, our business could be harmed.
We believe our success has depended, and continues to depend, on the efforts and talents of Darrell Cavens, one of our founders and our chief executive officer, Mark Vadon, one our founders and chairman of the board of directors, and other members of our management team. Our success also depends on our highly skilled team of employees, including our merchandising and technology personnel. Our future success depends on our continuing ability to attract, develop, motivate and retain highly qualified and skilled employees, particularly mid-level managers and merchandising and technology personnel. The market for such positions is competitive. Qualified individuals are in high demand, and we may incur significant costs to attract them. In addition, the loss of any of our senior management or key employees or our inability to recruit and develop mid-level managers could materially and adversely affect our ability to execute our business plan, and we may not be able to find adequate replacements. All of our officers and other U.S. employees are at-will employees, meaning that they may terminate their employment relationship with us at any time, and their knowledge of our business and industry would be extremely difficult to replace. In addition, we may not be able to find highly skilled personnel in international markets similar to such personnel on which the success of our U.S. operations depends. If we do not succeed in attracting
21
well-qualified employees or retaining and motivating existing employees, our business, financial condition and operating results may be materially and adversely affected.
Our management team has limited experience managing a public company, and regulatory compliance may divert its attention from the day-to-day management of our business.
The individuals who now constitute our management team have limited experience managing a publicly-traded company and complying with the increasingly complex laws pertaining to public companies. Our management team may not successfully or efficiently manage our transition to being a public company subject to significant regulatory oversight and incremental reporting obligations under the federal securities laws. In particular, these new obligations require substantial attention from our senior management and could divert their attention away from the day-to-day management of our business, which could materially and adversely affect our business, financial condition and operating results.
Adverse litigation judgments or settlements resulting from legal proceedings in which we may be involved could expose us to monetary damages or limit our ability to operate our business.
We may become involved from time to time in private actions, collective actions, investigations and various other legal proceedings by customers, employees, suppliers, competitors, government agencies or others. The results of any such litigation, investigations and other legal proceedings are inherently unpredictable and expensive. Any claims against us, whether meritorious or not, could be time-consuming, result in costly litigation, damage our reputation, require significant amounts of management time and divert significant resources. If any of these legal proceedings were to be determined adversely to us, or we were to enter into a settlement arrangement, we could be exposed to monetary damages or limits on our ability to operate our business, which could have a material adverse effect on our business, financial condition and operating results.
We may not be able to adequately protect our intellectual property rights.
We regard our subscriber list, marks, domain names, copyrights, patents, trade dress, trade secrets, proprietary technology and similar intellectual property as critical to our success, and we rely on trademark, copyright and patent law, trade secret protection, agreements and other methods with our employees and others to protect our proprietary rights. We might not be able to obtain effective intellectual property protection in every country in which we sell products. The protection of our intellectual property rights may require the expenditure of significant financial, managerial and operational resources. Moreover, the steps we take to protect our intellectual property may not adequately protect our rights or prevent third parties from infringing or misappropriating our proprietary rights. Any of our patents, marks, copyrights or other intellectual property rights may be challenged by others or invalidated through administrative process or litigation. Our patent applications may never be granted. Additionally, the process of obtaining patent protection is expensive and time-consuming, and we may not be able to prosecute all necessary or desirable patent applications at a reasonable cost or in a timely manner. Even if issued, there can be no assurance that these patents will adequately protect our intellectual property, as the legal standards relating to the validity, enforceability and scope of protection of patent and other intellectual property rights are uncertain. We also cannot be certain that others will not independently develop or otherwise acquire equivalent or superior technology or intellectual property rights.
We might be required to spend significant resources to monitor and protect our intellectual property rights. We may not be able to discover or determine the extent of any infringement, misappropriation or other violation of our intellectual property rights and other proprietary rights. We may initiate claims or litigation against others for infringement, misappropriation or violation of our intellectual property rights or proprietary rights or to establish the validity of such rights. Despite our efforts, we may be unable to prevent third parties from infringing upon, misappropriating or otherwise violating our intellectual property rights and other proprietary rights. Any litigation, whether or not it is resolved in our favor, could result in significant expense to us and divert the efforts of our technical and management personnel, which may materially and adversely affect our business, financial condition and operating results.
We may be accused of infringing intellectual property rights of third parties.
We may in the future be subject to litigation and disputes related to our intellectual property rights and technology, as well as disputes related to intellectual property and product offerings of third-party vendors featured by us. The costs of supporting such litigation and disputes are considerable, and there can be no assurances that favorable outcomes will be obtained.
22
The e-commerce industry is characterized by vigorous protection and pursuit of intellectual property rights, which has resulted in protracted and expensive litigation for many companies. We are subject to claims and litigation by third parties that we infringe their intellectual property rights, and we expect additional claims and litigation with respect to infringement to occur in the future. As our business expands and the number of competitors in our market increases and overlaps occur, we expect that infringement claims may increase in number and significance. Any claims or proceedings against us, whether meritorious or not, could be time-consuming, result in costly litigation, require significant amounts of management time or result in the diversion of significant operational resources, any of which could materially and adversely affect our business, financial condition and operating results.
Legal claims regarding intellectual property rights are subject to inherent uncertainties due to the oftentimes complex issues involved, and we cannot be certain that we will be successful in defending ourselves against such claims. In addition, some of our larger competitors have extensive portfolios of issued patents. Many potential litigants, including patent holding companies, have the ability to dedicate substantially greater resources to enforce their intellectual property rights and to defend claims that may be brought against them. Furthermore, a successful claimant could secure a judgment that requires us to pay substantial damages or prevents us from conducting our business as we have historically done or may desire to do in the future. We might also be required to seek a license and pay royalties for the use of such intellectual property, which may not be available on commercially acceptable terms, or at all. Alternatively, we may be required to develop non-infringing technology or intellectual property, which could require significant effort and expense and may ultimately not be successful.
We have received in the past, and we anticipate receiving in the future, communications alleging that certain items posted on or sold through our sites violate third-party copyrights, marks and trade names or other intellectual property rights or other proprietary rights. Brand and content owners and other proprietary rights owners have actively asserted their purported rights against online companies, including zulily. In addition to litigation from rights owners, we may be subject to regulatory, civil or criminal proceedings and penalties if governmental authorities believe we have aided and abetted in the sale of counterfeit or infringing products.
Such claims, whether or not meritorious, may result in the expenditure of significant financial, managerial and operational resources, injunctions against us or the payment of damages by us. We may need to obtain licenses from third parties who allege that we have violated their rights, but such licenses may not be available on terms acceptable to us, or at all. These risks have been amplified by the increase in third parties whose sole or primary business is to assert such claims.
The inability to acquire, use or maintain our “zulily” mark and domain names for our sites could substantially harm our business and operating results.
We currently are the registrant of the “zulily” mark in numerous jurisdictions and are the registrant of the Internet domain name for our website, zulily.com, as well as various related domain names. However, we have not registered the mark or domain name in all major international jurisdictions. Domain names generally are regulated by Internet regulatory bodies and are also controlled by trademark and other related laws of each country. If we do not have or cannot obtain on reasonable terms the ability to use our “zulily” mark in a particular country, or to use or register our domain name, we could be forced either to incur significant additional expenses to market our products within that country, including the development of a new brand and the creation of new promotional materials and packaging, or to elect not to sell products in that country. Either result could materially and adversely affect our business, financial condition and operating results.
Furthermore, the regulations governing domain names and laws protecting marks and similar proprietary rights could change in ways that block or interfere with our ability to use relevant domains or our current brand. Also, we might not be able to prevent third parties from registering, using or retaining domain names that interfere with our consumer communications or infringe or otherwise decrease the value of our marks, domain names and other proprietary rights. Regulatory bodies have established and may create additional generic or country-code top-level domains or may allow modifications of the requirements for registering, holding or using domain names. As a result, we might not be able to register, use or maintain the domain names that utilize the name zulily in all of the countries in which we currently or intend to conduct business.
Some of our software and systems contain open source software, which may pose particular risks to our proprietary software and solutions.
23
We use open source software in our software and systems and will use open source software in the future. The licenses applicable to open source software typically require that the source code subject to the license be made available to the public and that any modifications or derivative works to open source software continue to be licensed under open source licenses. From time to time, we may face claims from third parties claiming infringement of their intellectual property rights, or demanding the release or license of the open source software or derivative works that we developed using such software (which could include our proprietary source code) or otherwise seeking to enforce the terms of the applicable open source license. These claims could result in litigation and could require us to purchase a costly license, publicly release the affected portions of our source code, be limited in the licensing of our technologies or cease offering the implicated solutions unless and until we can re-engineer them to avoid infringement or change the use of the implicated open source software. In addition to risks related to license requirements, use of certain open source software can lead to greater risks than use of third-party commercial software, as open source licensors generally do not provide warranties, indemnities or other contractual protections with respect to the software (for example, non-infringement or functionality). Our use of open source software may also present additional security risks because the source code for open source software is publicly available, which may make it easier for hackers and other third parties to determine how to breach our sites and systems that rely on open source software. Any of these risks could be difficult to eliminate or manage, and, if not addressed, could have a material and adverse effect on our business, financial condition and operating results.
Our results could be adversely affected by natural disasters, public health crises, political crises or other catastrophic events.
Our principal offices are located in Seattle, Washington, an area that has experienced earthquakes in the past, and are thus vulnerable to damage. Natural disasters, such as hurricanes, tornadoes, floods, earthquakes and other adverse weather and climate conditions; unforeseen public health crises, such as pandemics and epidemics; political crises, such as terrorist attacks, war and other political instability; or other catastrophic events, whether occurring in the United States or internationally, could disrupt our operations or the operations of one or more of our vendors. In particular, these types of events could impact our product supply chain from or to the impacted region and could impact our ability or the ability of third parties to operate our sites. In addition, these types of events could negatively impact consumer spending in the impacted regions or depending upon the severity, globally. To the extent any of these events occur, our business, financial condition and operating results could be materially and adversely affected.
Our ability to raise capital in the future may be limited, and our failure to raise capital when needed could prevent us from growing.
In the future, we could be required to raise capital through public or private financing or other arrangements. Such financing may not be available on acceptable terms, or at all, and our failure to raise capital when needed could harm our business. We may sell Class A common stock, convertible securities and other equity securities in one or more transactions at prices and in a manner as we may determine from time to time. If we sell any such securities in subsequent transactions, investors may be materially diluted. New investors in such subsequent transactions could gain rights, preferences and privileges senior to those of holders of our Class A common stock. Debt financing, if available, may involve restrictive covenants and could reduce our operational flexibility or profitability. For example, we currently have a credit facility which requires that we meet certain customary covenants that include restrictions on, among other things, indebtedness, liens, investments, mergers, dispositions, dividends or other distributions. In addition, such credit facility contains certain financial covenants. If we cannot raise funds on acceptable terms, we may not be able to grow our business or respond to competitive pressures.
Risks Related to Ownership of our Class A Common Stock
Our stock price has been and will likely continue to be volatile and may decline regardless of our operating performance, resulting in substantial losses for investors.
24
The trading price of our Class A common stock has been, and is likely to continue to be, volatile for the foreseeable future. For example, since shares of our Class A common stock were sold in our initial public offering in November 2013, at a price of $22.00 per share, our Class A common stock's daily closing price on the NASDAQ Global Select Market has ranged from $34.19 to $61.59 through February 26, 2014. The market price of our Class A common stock may fluctuate significantly in response to numerous factors, many of which are beyond our control, including the factors listed below and other factors described in this "Risk Factors" section:
• | actual or anticipated fluctuations in our results of operations; |
• | the financial projections we may provide to the public, any changes in these projections or our failure to meet these projections; |
• | failure of securities analysts to initiate or maintain coverage of our company, changes in financial estimates or ratings by any securities analysts who follow our company or our failure to meet these estimates or the expectations of investors; |
• | announcements by us or our competitors of significant technical innovations, acquisitions, strategic partnerships, joint ventures, operating results or capital commitments; |
• | changes in operating performance and stock market valuations of other technology or retail companies generally, or those in our industry in particular; |
• | price and volume fluctuations in the overall stock market, including as a result of trends in the economy as a whole; |
• | changes in our board of directors or management; |
• | sales of large blocks of our Class A common stock, including sales by our executive officers, directors and significant stockholders; |
• | lawsuits threatened or filed against us; |
• | changes in laws or regulations applicable to our business; |
• | the expiration of contractual lock-up agreements; |
• | changes in our capital structure, such as future issuances of debt or equity securities; |
• | short sales, hedging and other derivative transactions involving our capital stock; |
• | general economic conditions in the United States and abroad; |
• | other events or factors, including those resulting from war, incidents of terrorism or responses to these events; and |
• | the other factors described in this section of our Annual Report captioned, “Risk Factors.” |
In addition, stock markets have experienced extreme price and volume fluctuations that have affected and continue to affect the market prices of equity securities of many technology companies, including e-commerce companies. Stock prices of many technology companies, including e-commerce companies, have fluctuated in a manner unrelated or disproportionate to the operating performance of those companies. In the past, stockholders have instituted securities class action litigation following periods of market volatility. If we were to become involved in securities litigation, it could subject us to substantial costs, divert resources and the attention of management from our business and materially and adversely affect our business, financial condition and operating results.
Substantial future sales of shares of our Class A common stock could cause the market price of our Class A common stock to decline.
We have a small public float relative to the total number of shares of Class A and Class B common stock that are issued and outstanding and a substantial majority of our issued and outstanding shares are currently restricted as a result of securities laws and lock-up agreements. We anticipate that some of these shares will be sold into the public market as these restrictions expire. In particular, as of December 29, 2013, approximately 110,159,235 shares of Class A common stock issuable upon conversion of outstanding Class B common stock will become eligible for sale into the public market, subject to compliance with applicable securities laws, upon expiration of the underwriter lock-up agreements expiring in mid-May 2014. Sales of a substantial number of shares of our Class A common stock in the public market, or the perception that these sales might occur, could depress the market price of our Class A common stock and could impair our ability to raise capital through the sale of additional equity
25
securities. We are unable to predict the effect that such sales may have on the prevailing market price of our Class A common stock.
In addition, as of December 29, 2013, there were 142,397 shares of Class A common stock and 13,796,090 shares of Class B common stock subject to outstanding options. All of the shares of Class A common stock issuable upon exercise of options (or upon conversion of Class B common stock issued upon exercise of options) have been registered for public resale under the Securities Act of 1933, as amended, or the Securities Act. Accordingly, these shares will be able to be freely sold in the public market upon issuance as permitted by any applicable vesting requirements, subject to the lock-up agreements described above and compliance with applicable securities laws.
Holders of approximately 84.8 million shares of Class B common stock have rights, subject to some conditions, to require us to file registration statements for the public resale of the Class A common stock issuable upon conversion of such shares or to include such shares in registration statements that we may file for zulily or other stockholders.
The dual class structure of our common stock and the existing ownership of capital stock by our executive officers, directors and their affiliates have the effect of concentrating voting control with our executive officers, directors and their affiliates for the foreseeable future, which will limit your ability to influence corporate matters.
Our Class B common stock has ten votes per share, and our Class A common stock has one vote per share. Given the greater number of votes per share attributed to our Class B common stock, holders of Class B common stock collectively own shares representing approximately 98.8% of the voting power of our outstanding capital stock as of December 29, 2013. Our executive officers and directors and their related parties, which include funds affiliated with Maveron LLC and August Capital, will collectively beneficially own shares representing approximately 80.3% of the voting power of our outstanding capital stock as of December 29, 2013. Consequently, the holders of Class B common stock collectively will continue to be able to control a majority of the voting power even if their stock holdings represent as few as approximately 9.1% of the outstanding number of shares of our common stock. This concentrated control will limit your ability to influence corporate matters for the foreseeable future. For example, these stockholders will be able to control elections of directors, amendments of our certificate of incorporation or bylaws, increases to the number of shares available for issuance under our equity incentive plans or adoption of new equity incentive plans and approval of any merger or sale of assets for the foreseeable future. This control may adversely affect the market price of our Class A common stock. Additionally, the holders of our Class B common stock may cause us to make strategic decisions or pursue acquisitions that could involve risks to you or may not be aligned with your interests.
Future transfers by holders of Class B common stock will generally result in those shares converting on a 1:1 basis to Class A common stock, which will have the effect, over time, of increasing the relative voting power of those holders of Class B common stock who retain their shares in the long-term, which may include our executive officers and directors and their affiliates.
If securities or industry analysts do not publish research or reports about our business, or publish negative reports about our business, our share price and trading volume could decline.
The trading market for our Class A common stock will depend in part on the research and reports that securities or industry analysts publish about us or our business, our market and our competitors. We do not have any control over these analysts. If one or more of the analysts who cover us downgrade our shares or change their opinion of our shares, our share price would likely decline. If one or more of these analysts cease coverage of our company or fail to regularly publish reports on us, we could lose visibility in the financial markets, which could cause our share price or trading volume to decline.
We are an “emerging growth company,” and we cannot be certain if the reduced disclosure requirements applicable to “emerging growth companies” will make our Class A common stock less attractive to investors.
We are an “emerging growth company,” as defined in the Jumpstart Our Business Startups Act of 2012, or the JOBS Act, and we may take advantage of certain exemptions from various reporting requirements that are applicable to other public companies that are not “emerging growth companies” including, but not limited to, not being required to comply with the auditor attestation requirements of Section 404 of the Sarbanes-Oxley Act, reduced disclosure obligations regarding executive compensation in our periodic reports and proxy statements and
26
exemptions from the requirements of holding a nonbinding advisory vote on executive compensation and stockholder approval of any golden parachute payments not previously approved. We will cease to be an “emerging growth company” upon the earliest of (1) the last day of fiscal year 2018, (2) the last day of the first fiscal year in which our annual gross revenues are $1 billion or more, (3) the date on which we have, during the previous rolling three-year period, issued more than $1 billion in non-convertible debt securities and (4) the date on which we are deemed to be a “large accelerated filer” as defined in the Securities Exchange Act of 1934, or the Exchange Act. We cannot predict if investors will find our Class A common stock less attractive or our company less comparable to certain other public companies because we will rely on these exemptions.
The requirements of being a public company may strain our resources, divert management’s attention and affect our ability to attract and retain additional executive management and qualified board members.
As a public company, we are subject to the reporting requirements of the Exchange Act, the Sarbanes-Oxley Act, the Dodd-Frank Act, the listing requirements of the NASDAQ Global Select Market and other applicable securities rules and regulations. Compliance with these rules and regulations have increased our legal and financial compliance costs, made some activities more difficult, time-consuming or costly and have increased demand on our systems and resources. We expect these costs, difficulties and demands to increase after we are no longer an “emerging growth company.” The Exchange Act requires, among other things, that we file annual, quarterly and current reports with respect to our business and results of operations. The Sarbanes-Oxley Act requires, among other things, that we maintain effective disclosure controls and procedures and internal control over financial reporting. We will be required to disclose changes made in our internal control and procedures on a quarterly basis. In order to maintain and, if required, improve our disclosure controls and procedures and internal control over financial reporting to meet this standard, significant resources and management oversight may be required. As a result, management’s attention may be diverted from other business concerns, which could adversely affect our business and results of operations. Although we have already hired additional employees to comply with these requirements, we will need to hire additional employees or engage outside consultants, which will increase our costs and expenses.
In addition, changing laws, regulations and standards relating to corporate governance and public disclosure are creating uncertainty for public companies, increasing legal and financial compliance costs and making some activities more time-consuming. These laws, regulations and standards are subject to varying interpretations, in many cases due to their lack of specificity, and, as a result, their application in practice may evolve over time as new guidance is provided by regulatory and governing bodies. This could result in continuing uncertainty regarding compliance matters and higher costs necessitated by ongoing revisions to disclosure and governance practices. We intend to invest resources to comply with evolving laws, regulations and standards, and this investment may result in increased general and administrative expenses and a diversion of management’s time and attention from revenue-generating activities to compliance activities. If our efforts to comply with new laws, regulations and standards differ from the activities intended by regulatory or governing bodies due to ambiguities related to their application and practice, regulatory authorities may initiate legal proceedings against us, and our business may be adversely affected.
Being a public company and these new rules and regulations have made it more expensive for us to obtain director and officer liability insurance, and in the future, we may be required to accept reduced coverage or incur substantially higher costs to obtain coverage. These factors could also make it more difficult for us to attract and retain qualified members of our board of directors, particularly to serve on our audit committee and compensation committee, and qualified executive officers.
As a result of disclosure of information in our filings with the SEC, our business and financial condition have become more visible, which we believe may result in threatened or actual litigation, including by competitors and other third parties. If such claims are successful, our business and results of operations could be adversely affected, and even if the claims do not result in litigation or are resolved in our favor, these claims, and the time and resources necessary to resolve them, could divert the resources of our management and materially and adversely affect our business, financial condition and operating results.
If we fail to maintain proper and effective internal control over financial reporting, our ability to produce accurate and timely financial statements could be impaired and such failure may adversely affect investor confidence in our company and, as a result, the value of our Class A common stock.
27
Ensuring that we have adequate internal financial and accounting controls and procedures in place so that we can produce accurate financial statements on a timely basis is a costly and time-consuming effort that needs to be re-evaluated frequently. We will be required, pursuant to Section 404 of the Sarbanes-Oxley Act, to furnish a report by management on, among other things, the effectiveness of our internal control over financial reporting for the first fiscal year beginning after the date of our initial public offering. This assessment will need to include disclosure of any material weaknesses identified by our management in our internal control over financial reporting, as well as a statement that our independent registered public accounting firm has issued an opinion on our internal control over financial reporting, provided that our independent registered public accounting firm will not be required to attest to the effectiveness of our internal control over financial reporting until our first annual report required to be filed with the SEC following the later of the date we are deemed to be an “accelerated filer” or a “large accelerated filer,” each as defined in the Exchange Act, or the date we are no longer an “emerging growth company,” as defined in the JOBS Act. As a newly public company, we are continuing to develop and refine our internal controls and procedures and may need to undertake various actions, including hiring accounting or internal audit staff. We are beginning the costly and challenging process of compiling the system and processing documentation necessary to perform the evaluation needed to comply with Section 404, and we may not be able to complete our evaluation, testing and any required remediation in a timely fashion.
We and our independent registered public accounting firm previously identified a material weakness in our internal control over financial reporting, subsequent to the issuance of our consolidated financial statements for the fiscal years ended December 30, 2012 and January 1, 2012. A material weakness is a deficiency, or combination of control deficiencies, in internal control over financial reporting, such that there is a reasonable possibility that a material misstatement of the annual or interim consolidated financial statements will not be prevented or detected on a timely basis. The material weakness identified related to the lack of sufficient technical accounting skills within our accounting and finance organization. Related to the identified weakness, there were a number of post-close adjustments that were determined to be immaterial to the consolidated financial statements but resulted in the correction of our previously issued consolidated financial statements as of and for the fiscal years ended December 30, 2012, January 1, 2012, and December 31, 2010. In future periods, if during the evaluation and testing process, we identify any other material weaknesses in our internal control over financial reporting, we will be unable to assert that our internal control over financial reporting is effective. If we are unable to assert that our internal control over financial reporting is effective, or if our independent registered public accounting firm is unable to express an opinion on the effectiveness of our internal control, investors could lose confidence in the accuracy and completeness of our financial reports, which would cause the price of our Class A common stock to decline, and we may be subject to investigation or sanctions by the SEC.
Anti-takeover provisions in our charter documents and under Delaware law and Washington law could make an acquisition of our company more difficult, limit attempts by our stockholders to replace or remove our current management and limit the market price of our Class A common stock.
Provisions in our certificate of incorporation and bylaws may have the effect of delaying or preventing a change of control or changes in our management. Our certificate of incorporation and bylaws include provisions that:
• | establish a classified board of directors so that not all members of our board of directors are elected at one time; |
• | permit the board of directors to establish the number of directors and fill any vacancies and newly created directorships; |
• | provide that directors may only be removed for cause; |
• | require super-majority voting to amend some provisions in our certificate of incorporation and bylaws; |
• | authorize the issuance of “blank check” preferred stock that our board of directors could use to implement a stockholder rights plan; |
• | eliminate the ability of our stockholders to call special meetings of stockholders; |
• | prohibit stockholder action by written consent, which requires all stockholder actions to be taken at a meeting of our stockholders; |
• | provide that the board of directors is expressly authorized to make, alter or repeal our bylaws; |
• | restrict the forum for certain litigation against us to Delaware; |
28
• | reflect the dual class structure of our common stock, as discussed above; and |
• | establish advance notice requirements for nominations for election to our board of directors or for proposing matters that can be acted upon by stockholders at annual stockholder meetings. |
These provisions may frustrate or prevent any attempts by our stockholders to replace or remove our current management by making it more difficult for stockholders to replace members of our board of directors, which is responsible for appointing the members of our management. In addition, because we are incorporated in Delaware, we are governed by the provisions of Section 203 of the Delaware General Corporation Law, which generally prohibits a Delaware corporation from engaging in any of a broad range of business combinations with any holder of at least 15% of our capital stock for a period of three years following the date on which the stockholder became a 15% stockholder. Likewise, because our principal executive offices are located in Washington, the anti-takeover provisions of the Washington Business Corporation Act may apply to us under certain circumstances now or in the future. These provisions prohibit a “target corporation” from engaging in any of a broad range of business combinations with any stockholder constituting an “acquiring person” for a period of five years following the date on which the stockholder became an “acquiring person.”
Our certificate of incorporation also provides that the Court of Chancery of the State of Delaware is the exclusive forum for substantially all disputes between us and our stockholders, which could limit our stockholders’ ability to obtain a favorable judicial forum for disputes with us or our directors, officers or employees.
Our certificate of incorporation provides that the Court of Chancery of the State of Delaware is the exclusive forum for any derivative action or proceeding brought on our behalf; any action asserting a breach of fiduciary duty; any action asserting a claim against us arising pursuant to the Delaware General Corporation Law, our certificate of incorporation or our bylaws; or any action asserting a claim against us that is governed by the internal affairs doctrine. The choice of forum provision may limit a stockholder’s ability to bring a claim in a judicial forum that it finds favorable for disputes with us or our directors, officers or other employees, which may discourage such lawsuits against us and our directors, officers and other employees. Alternatively, if a court were to find the choice of forum provision contained in our certificate of incorporation to be inapplicable or unenforceable in an action, we may incur additional costs associated with resolving such action in other jurisdictions, which could adversely affect our business and financial condition.
29
Item 1B. Unresolved Staff Comments
None.
Item 2. Properties
Our principal executive offices are located at 2601 Elliott Avenue, Suite 200, Seattle, Washington. The lease for our principal executive offices is for 280,894 square feet and expires in 2024, and provides for a right to terminate in January 2021, subject to satisfaction of certain payment obligations. We also occupy 110,000 square feet of office space in Seattle, Washington pursuant to a lease that expires in June 2014. We lease an approximately 737,000 square foot fulfillment center in Lockbourne, Ohio, pursuant to a lease that expires in May 2017. We also lease an approximately 17,000 square foot corporate office which houses a merchandising team and production studios in Columbus, Ohio, pursuant to a lease that expires in May 2017. Additionally, we lease an approximately 328,000 square foot fulfillment center in McCarran, Nevada, pursuant to a lease that expires in December 2014. We also entered into a lease in January 2014 for approximately 48 acres of land in McCarran, Nevada, on which a new, approximately 707,010 square feet of ground floor space, fulfillment center is being constructed, pursuant to a lease, the initial term of which expires 12 years from the earlier of completion of the fulfillment center or the date we commence business operations from the leased property. We maintain offices in the United Kingdom, leasing approximately 7,000 square feet, pursuant to a lease that expires in February 2017. We believe that our facilities are suitable and adequate to meet our current needs. We intend to add new facilities and fulfillment centers or expand existing facilities and fulfillment centers as needed as we add employees and expand operations. We believe that suitable additional or substitute space will be available as needed to accommodate any such expansion of our operations.
Item 3. Legal Proceedings
See Note 6: "Commitments and Contingencies" of the Notes to Consolidated Financial Statements within Item 8, of Part II of this Annual Report for information regarding legal proceedings.
Item 4. Mine Safety Disclosures
None.
Item 5. Market for Registrant's Common Equity, Related Stockholder Matters, and Issuer Purchases of Equity Securities
Market for Our Common Stock
Our Class A common stock has been trading on the NASDAQ Global Select Market under the symbol “ZU” since November 15, 2013. Prior to that date, there was no public market for our Class A common stock. There is no public trading market for our Class B common stock. The following table sets forth the high and low intra-day sales prices per share for our Class A common stock on the NASDAQ Global Select Market.
Year Ended December 29, 2013: | High | Low | |||||
Fourth quarter (beginning November 15, 2013) | $ | 44.96 | $ | 34.19 | |||
Holders of Record
As of February 26, 2014, there was one stockholder of record of our Class A common stock and 222 stockholders of record of our Class B common stock. The actual number of stockholders is greater than this numbers of record holders, and includes stockholders who are beneficial owners, whose shares are held of record by banks, brokers, and other financial institutions.
Dividends
We have never declared or paid dividends on our capital stock except for the deemed dividend to preferred stockholders in our fiscal year 2012; please see Note 7: "Stockholders' Equity (Deficit)" of the Notes to
30
Consolidated Financial Statements included in Item 8 of Part II of this Annual Report. We currently intend to retain all available funds and any future earnings to support operations and to finance the growth and development of our business. We do not intend to declare or pay cash dividends on our capital stock in the foreseeable future. Any future determination to pay dividends will be made at the discretion of our board of directors subject to applicable laws, and will depend upon, among other factors, our results of operations, financial condition, contractual restrictions and capital requirements.
Our future ability to pay cash dividends on our stock is limited by the terms of our January 2014 credit facility which restricts our ability to make certain restricted payments, which include the payment of cash dividends, other than certain exceptions set forth in such credit agreement. We have the ability to make future cash dividend payments under the terms of the credit agreement if, at the time of and on a pro forma basis immediately after making such cash dividend payment, we remain in compliance with certain financial covenants set forth in such credit agreement. We may be further limited by the terms of any future debt or preferred securities.
Stock Performance Graph
The following shall not be deemed “filed” for purposes of Section 18 of the Exchange Act, or incorporated by reference into any of our other filings under the Exchange Act or the Securities Act, except to the extent we specifically incorporate it by reference into such filing.
This graph compares the cumulative total return on our Class A common stock with that of the NASDAQ Composite Index and the S&P 500 Retailing Index. The chart assumes $100 was invested at the close of market on November 15, 2013 in our Class A common stock or October 31, 2013 in the NASDAQ Composite Index and the S&P 500 Retailing Index, and assumes the reinvestment of any dividends. The stock price performance on the following graph is not necessarily indicative of future stock price performance.
The closing price of our Class A common stock on December 27, 2013, the last trading day of fiscal 2013, was $40.59 per share.
31
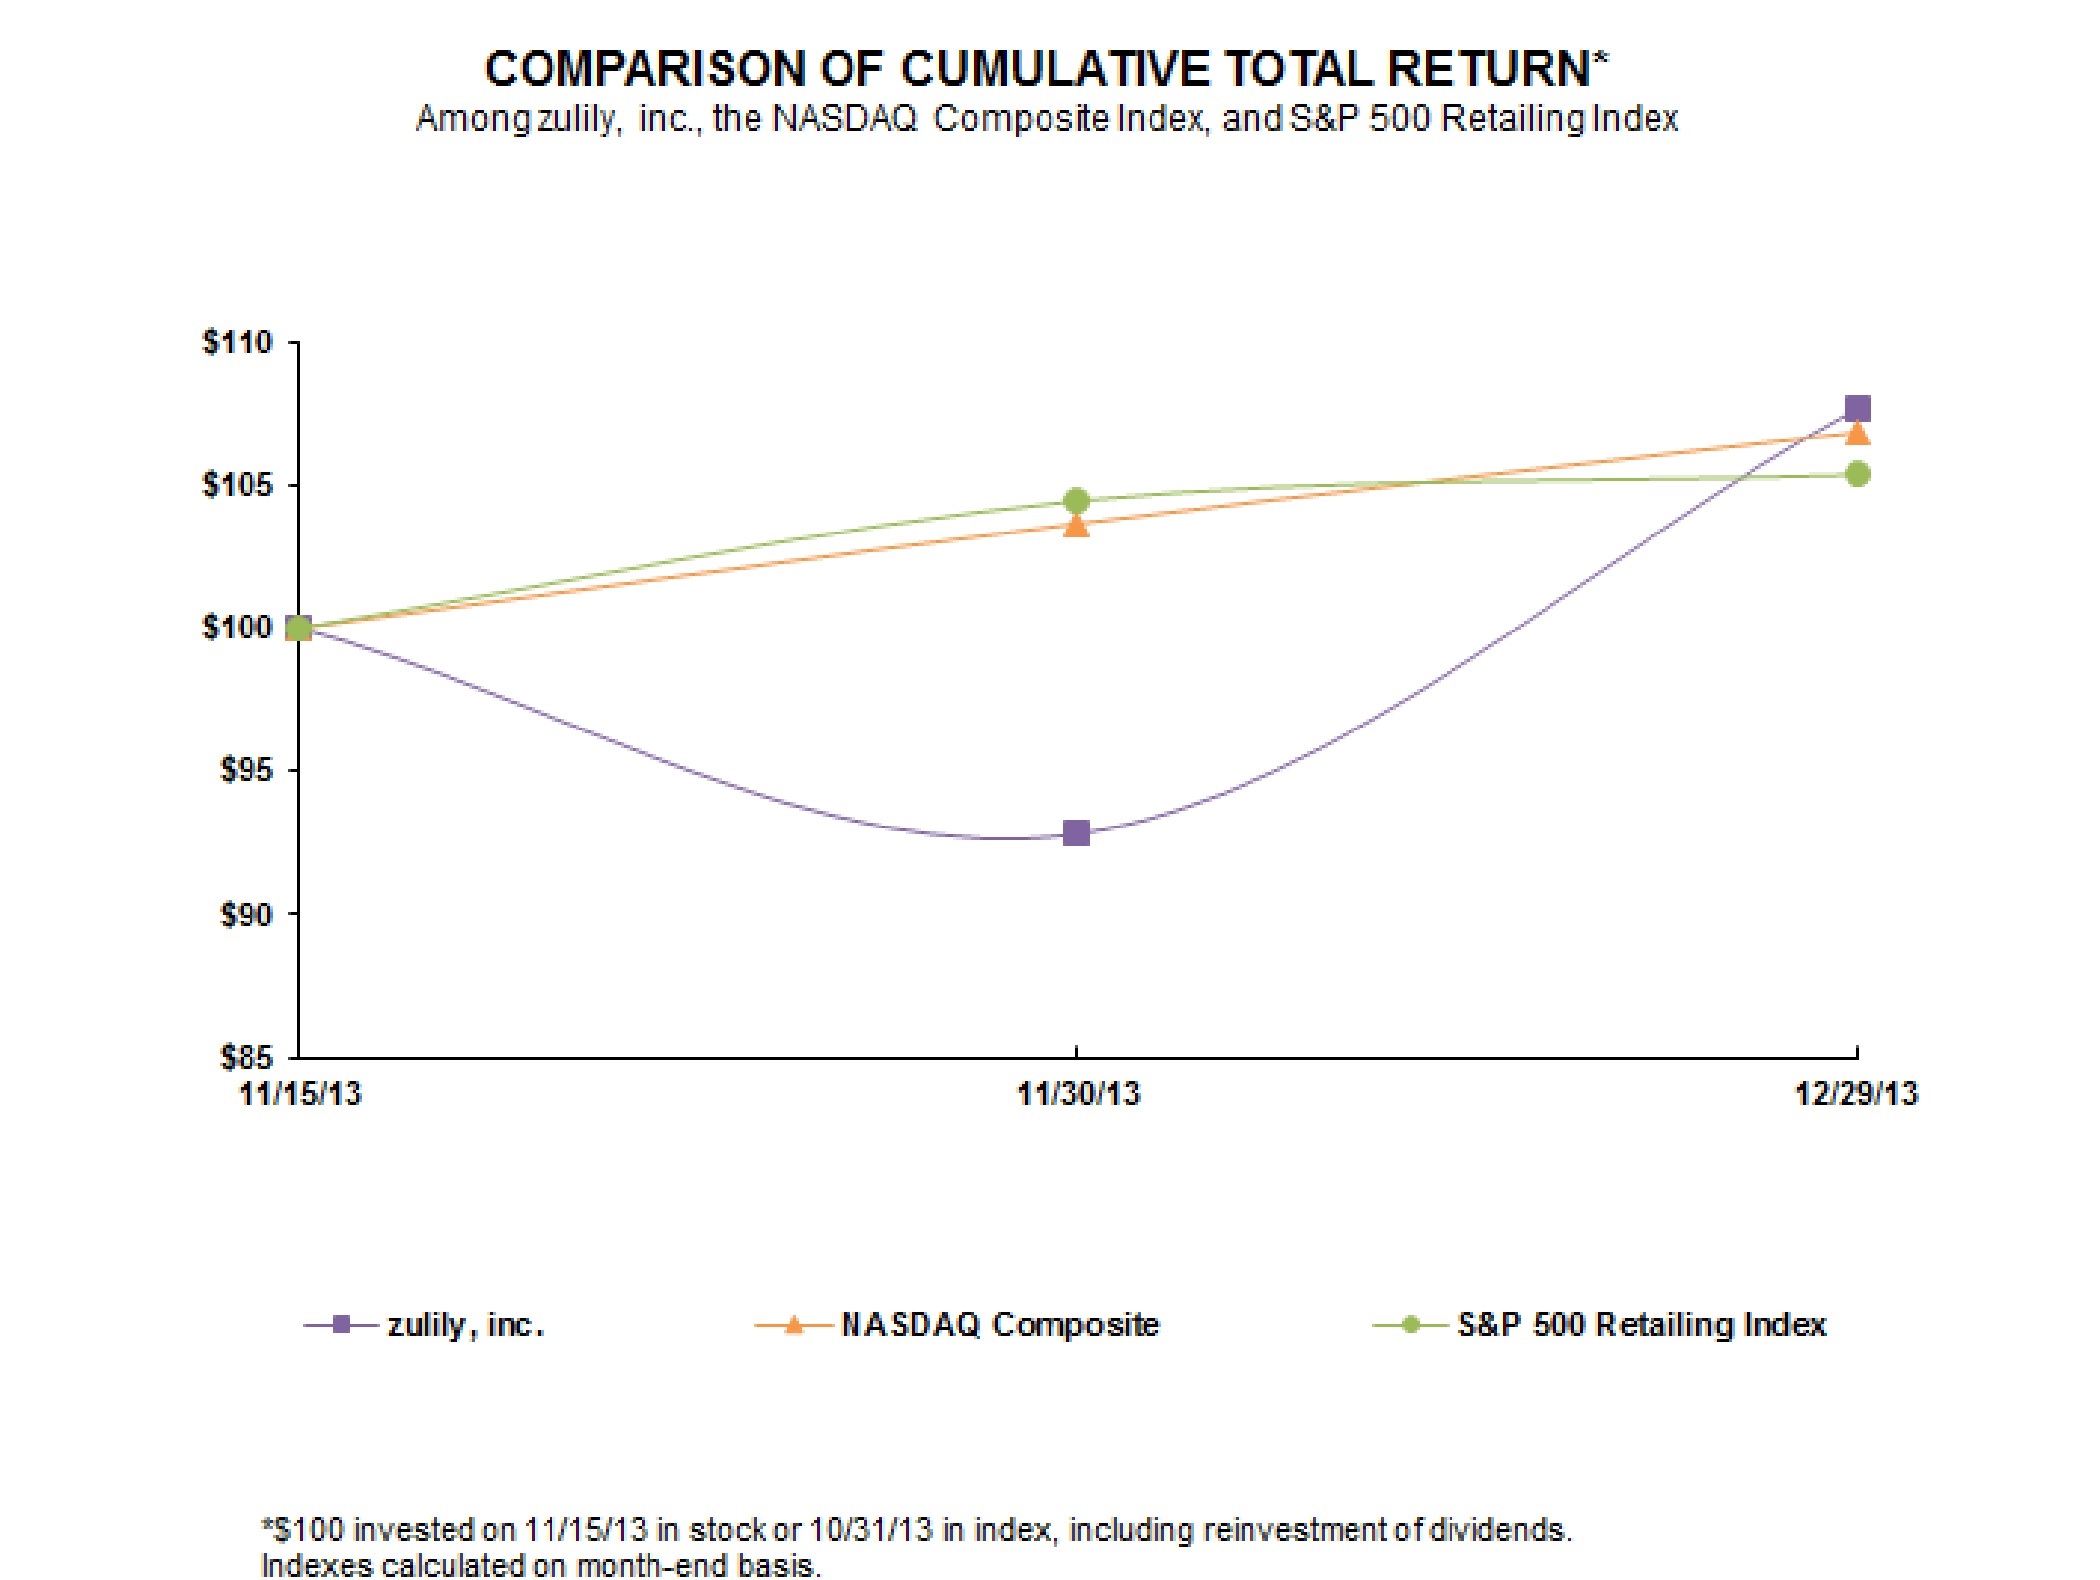
Sales of Unregistered Securities
From January 1, 2013 through November 20, 2013, the date of completion of our initial public offering, or IPO, we granted to employees, consultants and directors options to purchase an aggregate of 78,222 shares of Class A common stock pursuant to our 2013 Equity Plan having an exercise price of $22.00 per share. During this period, we also issued to employees, consultants and directors options to purchase an aggregate of 7,685,179 shares of Class B common stock pursuant to our 2009 Equity Incentive Plan having exercise prices ranging from $7.92 to $17.00 per share none of which were exercised during this period. The offers, sales and issuances of the securities described above were deemed to be exempt from registration under the Securities Act under either (a) Rule 701 promulgated under the Securities Act as offers and sale of securities pursuant to certain compensatory benefit plans and contracts relating to compensation in compliance with Rule 701 or (b) Section 4(2) of the Securities Act as transactions by an issuer not involving any public offering. The recipients of securities in each of these transactions represented their intention to acquire the securities for investment only and not with view to or for sale in connection with any distribution thereof and appropriate legends were affixed to the stock certificates and instruments issued in such transactions. All recipients had adequate access, through their relationships with us, to information about us.
Use of Proceeds from Public Offering of Common Stock
In November 2013, we closed our IPO of 13,225,000 shares of our Class A common stock, including 7,334,125 shares sold by us and 5,890,875 shares sold by the selling stockholders, at a price to the public of $22.00 per share. The offer and sale of all of the shares in the IPO were registered under the Securities Act pursuant to a registration statement on Form S-1 (File No. 333-191617), which was declared effective by the SEC on November 14, 2013. The offering closed on November 20, 2013. Goldman, Sachs & Co., BofA Merrill Lynch,
32
Citigroup, RBC Capital Markets, Allen & Company LLC and William Blair acted as underwriters. The aggregate offering price for shares sold in the offering was approximately $291 million. We did not receive any proceeds from the sale of shares by the selling stockholders. We raised approximately $147.5 million in net proceeds from the offering, after deducting the underwriter discount with respect to the shares offered by us of approximately $10.5 million and other offering expenses of approximately $3.3 million.
There has been no material change in the planned use of proceeds from our IPO as described in our final prospectus filed with the SEC on November 15, 2013 pursuant to Rule 424(b) under the Securities Act. Pending the uses described, we maintain the cash received in cash and cash equivalents as well as short-term investments.
Item 6. Selected Financial and Other Data
The selected consolidated statements of operations data for the fiscal years ended December 29, 2013, December 30, 2012 and January 1, 2012 and the consolidated balance sheet data as of December 29, 2013 and December 30, 2012 are derived from our audited consolidated financial statements appearing elsewhere in this Annual Report. The consolidated balance sheet data for the fiscal year ended January 1, 2012 and the consolidated statements of operations data for the fiscal year ended December 31, 2010 are derived from audited consolidated financial statements that are not included in this Annual Report. Our historical results are not necessarily indicative of the results that should be expected in the future. The selected consolidated financial and other data should be read in conjunction with the sections entitled Item 7, “Management’s Discussion and Analysis of Financial Condition and Results of Operations” and Item 8, "Financial Statements and Supplementary Data."
Year Ended | |||||||||||||||
December 29, 2013 | December 30, 2012 | January 1, 2012 | December 31, 2010 | ||||||||||||
(in thousands, except share and per share data) | |||||||||||||||
Consolidated Statements of Operations Data | |||||||||||||||
Net sales | $ | 695,709 | $ | 331,240 | $ | 142,545 | $ | 18,376 | |||||||
Cost of sales(1) | 502,318 | 240,943 | 104,949 | 12,574 | |||||||||||
Gross profit | 193,391 | 90,297 | 37,596 | 5,802 | |||||||||||
Operating expenses: | |||||||||||||||
Marketing expenses(1) | 59,667 | 37,780 | 20,228 | 4,897 | |||||||||||
Selling, general and administrative expenses(1) | 120,695 | 63,071 | 28,905 | 7,112 | |||||||||||
Total operating expenses | 180,362 | 100,851 | 49,133 | 12,009 | |||||||||||
Income (loss) from operations | 13,029 | (10,554 | ) | (11,537 | ) | (6,207 | ) | ||||||||
Interest income (expense)—net | 136 | 43 | 20 | (169 | ) | ||||||||||
Other income (expense)—net | 99 | 176 | 203 | (627 | ) | ||||||||||
Net income (loss) before provision for income taxes | 13,264 | (10,335 | ) | (11,314 | ) | (7,003 | ) | ||||||||
Provision for income taxes | (356 | ) | $ | — | — | — | |||||||||
Net income (loss) | $ | 12,908 | $ | (10,335 | ) | $ | (11,314 | ) | $ | (7,003 | ) | ||||
Net income (loss) attributable to Class A and Class B common stockholders | $ | — | $ | (46,822 | ) | $ | (13,233 | ) | $ | (7,448 | ) | ||||
Net income (loss) per Class A and Class B common share(2): | |||||||||||||||
Basic | $ | — | $ | (1.23 | ) | $ | (0.55 | ) | $ | (0.46 | ) | ||||
Diluted | $ | — | $ | (1.23 | ) | $ | (0.55 | ) | $ | (0.46 | ) | ||||
Shares used in computing net income (loss) per Class A and Class B common share: | |||||||||||||||
Basic | 59,450,186 | 37,976,724 | 24,102,780 | 16,347,656 | |||||||||||
Diluted | 59,450,186 | 37,976,724 | 24,102,780 | 16,347,656 | |||||||||||
33
Year Ended | |||||||||||||||
December 29, 2013 | December 30, 2012 | January 1, 2012 | December 31, 2010 | ||||||||||||
(in thousands, except revenue per active customer and average order value) | |||||||||||||||
Other Financial and Operational Data | |||||||||||||||
Adjusted EBITDA(3) | $ | 27,046 | $ | (5,920 | ) | $ | (8,871 | ) | $ | (3,734 | ) | ||||
Free cash flow(4) | $ | 53,514 | $ | 8,425 | $ | 3,749 | $ | (1,164 | ) | ||||||
Active customers(5) | 3,172 | 1,580 | 791 | 157 | |||||||||||
Revenue per active customer(6) | $ | 219 | $ | 210 | $ | 180 | $ | 117 | |||||||
Total orders placed(7) | 14,144 | 6,950 | 2,998 | 384 | |||||||||||
Average order value(8) | $ | 54.75 | $ | 53.37 | $ | 53.48 | $ | 52.52 | |||||||
As of | |||||||||||
December 29, 2013 | December 30, 2012 | January 1, 2012 | |||||||||
(in thousands) | |||||||||||
Consolidated Balance Sheet Data | |||||||||||
Cash and cash equivalents | $ | 290,089 | $ | 96,998 | $ | 28,361 | |||||
Short-term investments | 18,014 | 8,000 | 14,000 | ||||||||
Working capital | 220,820 | 62,605 | 22,821 | ||||||||
Total assets | 356,087 | 130,737 | 58,323 | ||||||||
Deferred revenue | 23,250 | 9,653 | 3,520 | ||||||||
Convertible redeemable preferred stock(9) | — | 128,714 | 45,519 | ||||||||
Total stockholders’ equity (deficit)(9) | 242,203 | (55,750 | ) | (16,168 | ) | ||||||
______________
(1)Stock-based compensation included in the statements of operations data above was as follows:
Year Ended | |||||||||||||||
December 29, 2013 | December 30, 2012 | January 1, 2012 | December 31, 2010 | ||||||||||||
(in thousands) | |||||||||||||||
Cost of sales | $ | 70 | $ | 26 | $ | 2 | $ | — | |||||||
Marketing expenses | 327 | 142 | 62 | 2 | |||||||||||
Selling, general and administrative expenses | 7,380 | 1,097 | 2,015 | 2,396 | |||||||||||
Total stock-based compensation expense | $ | 7,777 | $ | 1,265 | $ | 2,079 | $ | 2,398 | |||||||
(2) | Basic and diluted net loss per common share attributable to common stockholders for the fiscal year ended December 30, 2012 includes a deemed dividend distribution of $32.1 million. Such dividend is included as it represents distributed earnings attributable to participating securities. For further information, see Note 7: "Stockholders' Equity (Deficit)" of the Notes to Consolidated Financial Statements included in Item 8 of Part II of this Annual Report. |
(3) | Adjusted EBITDA is a non-GAAP financial measure that we calculate as earnings (loss) before interest and other income and expense, taxes, depreciation, amortization and stock-based compensation expense. See “Non-GAAP Financial Measures—Adjusted EBITDA” below for more information and for a reconciliation of Adjusted EBITDA to net income (loss), the most directly comparable financial measure calculated and presented in accordance with GAAP. |
(4) | Free cash flow is a non-GAAP financial measure that we calculate as net cash provided by (used in) operating activities less net cash used in capital expenditures. See “Non-GAAP Financial Measures—Free Cash Flow” below for more information and for a reconciliation of free cash flow to net cash provided by (used in) operating activities, the most directly comparable financial measure calculated and presented in accordance with GAAP. |
(5) | Represents individual customers who have purchased from us at least once in the last year. In any particular period, we determine our number of active customers by counting the total number of customers who have made at least one purchase in the preceding 12 month period, measured from the last date of such period. For more information, see "Management's Discussion and Analysis of Financial Condition and Results of Operations—Key Financial and Operating Metrics—Active Customers." |
(6) | Represents our total net sales divided by our total number of active customers in any particular period. For more information, see "Management's Discussion and Analysis of Financial Condition and Results of Operations—Key Financial and Operating Metrics—Revenue Per Active Customer." |
(7) | Represents the total number of customer orders placed by our customers in any period. For more information, see "Management's Discussion and Analysis of Financial Condition and Results of Operations—Key Financial and Operating Metrics—Total Orders Placed." |
34
(8) | Represents the sum of the total order values (including shipping and handling charges) in a given period divided by the total orders placed in that period. For more information, see "Management's Discussion and Analysis of Financial Condition and Results of Operations—Key Financial and Operating Metrics—Average Order Value." |
(9) | Outstanding convertible redeemable preferred stock converted to Class B common shares following the close of our IPO. |
Non-GAAP Financial Measures
Adjusted EBITDA
To provide investors with additional information regarding our financial results, we have disclosed in the table above and elsewhere in this Annual Report Adjusted EBITDA, a non-GAAP financial measure that we calculate as earnings (loss) before interest and other income and expense, taxes, depreciation, amortization and stock-based compensation expense. We have provided a reconciliation below of Adjusted EBITDA to net income (loss), the most directly comparable GAAP financial measure.
We have included Adjusted EBITDA in this Annual Report because it is a key measure used by our management and board of directors to evaluate our operating performance, generate future operating plans and make strategic decisions regarding the allocation of capital. In particular, the exclusion of certain expenses in calculating Adjusted EBITDA facilitates operating performance comparisons on a period-to-period basis and, in the case of exclusion of the impact of stock-based compensation, excludes an item that we do not consider to be indicative of our core operating performance. Accordingly, we believe that Adjusted EBITDA provides useful information to investors and others in understanding and evaluating our operating results in the same manner as our management and board of directors.
Adjusted EBITDA has limitations as an analytical tool, and you should not consider it in isolation or as a substitute for analysis of our results as reported under GAAP. Some of these limitations are:
• | although depreciation and amortization are non-cash charges, the assets being depreciated and amortized may have to be replaced in the future, and Adjusted EBITDA does not reflect cash capital expenditure requirements for such replacements or for new capital expenditure requirements; |
• | Adjusted EBITDA does not reflect changes in, or cash requirements for, our working capital needs; |
• | Adjusted EBITDA does not consider the potentially dilutive impact of equity-based compensation; |
• | Adjusted EBITDA does not reflect tax payments that may represent a reduction in cash available to us; and |
• | other companies, including companies in our industry, may calculate Adjusted EBITDA differently, which reduces its usefulness as a comparative measure. |
Because of these limitations, you should consider Adjusted EBITDA alongside other financial performance measures, including various cash flow metrics, net income (loss) and our other GAAP results.
The following table reflects the reconciliation of net income (loss) to Adjusted EBITDA for each of the periods indicated:
Year Ended | |||||||||||||||
December 29, 2013 | December 30, 2012 | January 1, 2012 | December 31, 2010 | ||||||||||||
(in thousands) | |||||||||||||||
Reconciliation of Adjusted EBITDA: | |||||||||||||||
Net income (loss) | $ | 12,908 | $ | (10,335 | ) | $ | (11,314 | ) | $ | (7,003 | ) | ||||
Excluding: | |||||||||||||||
Interest (income) expense—net | (136 | ) | (43 | ) | (20 | ) | 169 | ||||||||
Other (income) expense—net | (99 | ) | (176 | ) | (203 | ) | 627 | ||||||||
Taxes | 356 | — | — | — | |||||||||||
Depreciation and amortization | 6,240 | 3,369 | 587 | 75 | |||||||||||
Stock-based compensation expense | 7,777 | 1,265 | 2,079 | 2,398 | |||||||||||
Adjusted EBITDA | $ | 27,046 | $ | (5,920 | ) | $ | (8,871 | ) | $ | (3,734 | ) | ||||
35
Free Cash Flow
To provide investors with additional information regarding our financial results, we have also disclosed in the table above and elsewhere in this Annual Report free cash flow, a non-GAAP financial measure that we calculate as net cash provided by (used in) operating activities less net cash used in capital expenditures. We have provided a reconciliation below of free cash flow to net cash provided by (used in) operating activities, the most directly comparable GAAP financial measure.
We have included free cash flow in this Annual Report because it is a key measure used by our management and board of directors, which we believe is an important indicator of our business performance because it measures the amount of cash we generate. Free cash flow also reflects changes in working capital. Accordingly, we believe that free cash flow provides useful information to investors and others in understanding and evaluating our operating results in the same manner as our management and board of directors.
Free cash flow has limitations as an analytical tool, and you should not consider it in isolation or as a substitute for analysis of our results as reported under GAAP. There are limitations to using non-GAAP financial measures, including that other companies, including companies in our industry, may calculate free cash flow differently. Because of these limitations, you should consider free cash flow alongside other financial performance measures, including net cash provided by (used in) operating activities, capital expenditures and our other GAAP results.
The following table presents a reconciliation of free cash flow to net cash provided by (used in) operating activities for each of the periods indicated:
Year Ended | |||||||||||||||
December 29, 2013 | December 30, 2012 | January 1, 2012 | December 31, 2010 | ||||||||||||
(in thousands) | |||||||||||||||
Reconciliation of Free Cash Flow: | |||||||||||||||
Net cash provided by (used in) operating activities | $ | 73,120 | $ | 16,283 | $ | 8,864 | $ | (656 | ) | ||||||
Capital expenditures | (19,606 | ) | (7,858 | ) | (5,115 | ) | (508 | ) | |||||||
Free cash flow | $ | 53,514 | $ | 8,425 | $ | 3,749 | $ | (1,164 | ) | ||||||
Net cash used in investing activities | $ | (28,936 | ) | $ | (139 | ) | $ | (21,615 | ) | $ | (608 | ) | |||
Net cash provided by financing activities | $ | 148,931 | $ | 52,493 | $ | 31,955 | $ | 9,903 | |||||||
Diluted net income (loss) per share
To provide investors with additional information regarding our financial results, we have also disclosed in the table below and elsewhere in this Annual Report, a non-GAAP diluted net income (loss) per share financial measure which assumes the conversion of all outstanding shares of preferred stock at the beginning of the reporting period for periods prior to our IPO in November 2013. Our non-GAAP diluted net income (loss) per share also assumes all vesting of restricted stock occurred at the beginning of the applicable reporting periods. The numerator of the non-GAAP diluted net income (loss) per share calculation also excludes the effect of the deemed dividend which resulted from a preferred stock repurchase in Q4 2012. Assuming the conversion of preferred stock and the vesting of restricted stock at the beginning of the applicable reporting periods, as well as the exclusion of the deemed dividend, the result is the use of GAAP net income (loss) as the numerator and the denominator representing the weighted-average shares outstanding on an if-converted basis in the calculation of non-GAAP diluted net income (loss) per share for each period presented.
We have included non-GAAP diluted net income (loss) per share in this Annual Report because it is a key measure used by our management and board of directors, which we believe is an important indicator of our business performance as this measure is more comparable in understanding our past financial performance and future results. Accordingly, we believe that non-GAAP net income (loss) per share provides useful information to investors and others in understanding and evaluating our operating results in the same manner as our management and board of directors.
36
A reconciliation of non-GAAP net income (loss) attributable to common stockholders to GAAP income (loss) attributable to common stockholders, the most directly comparable GAAP financial measure, and non-GAAP dilutive shares to GAAP dilutive shares, the most directly comparable GAAP financial measure, in order to calculate non-GAAP dilutive net income (loss) per share, is as follows:
Year Ended | |||||||||||||||
December 29, 2013 | December 30, 2012 | January 1, 2012 | December 31, 2010 | ||||||||||||
(in thousands except share and per share amounts) | |||||||||||||||
GAAP net income (loss) attributable to common stockholders | $ | — | $ | (46,822 | ) | $ | (13,233 | ) | $ | (7,448 | ) | ||||
Add: Preferred stock deemed dividend | — | 32,112 | — | — | |||||||||||
Add: Accretion of convertible redeemable preferred stock | 8,974 | 4,375 | 1,919 | 445 | |||||||||||
Add: Undistributed earnings attributable to participating securities | 3,934 | — | — | — | |||||||||||
Non-GAAP net income (loss) attributable to common stockholders | $ | 12,908 | $ | (10,335 | ) | $ | (11,314 | ) | $ | (7,003 | ) | ||||
GAAP Weighted average shares used to compute diluted net income (loss) per Class A and Class B common share | 59,450,186 | 37,976,724 | 31,010,515 | 10,051,637 | |||||||||||
Add: Convertible preferred stock | 53,293,392 | 55,846,208 | 75,346,500 | 33,188,453 | |||||||||||
Add: Unvested restricted stock | 3,644,546 | 16,468,775 | 22,938,969 | 43,417,113 | |||||||||||
Add: Additional dilutive effect of stock options | 3,989,507 | — | — | — | |||||||||||
Non-GAAP Weighted average shares used to compute diluted net income (loss) per Class A and Class B common share | 120,377,631 | 110,291,707 | 129,295,984 | 86,657,203 | |||||||||||
Non-GAAP net income (loss) per share attributable to Class A and Class B common stockholders | $ | 0.11 | $ | (0.09 | ) | $ | (0.09 | ) | $ | (0.08 | ) | ||||
Item 7. Management's Discussion and Analysis of Financial Condition and Results of Operations
The following discussion and analysis of our financial condition and results of operations should be read in conjunction with our consolidated financial statements and related notes appearing elsewhere in this Annual Report. This discussion contains forward-looking statements that reflect our plans, estimates and beliefs, and involve risks and uncertainties. Our actual results and the timing of certain events could differ materially from those anticipated in these forward-looking statements as a result of several factors, including those discussed in the section titled “Risk Factors” included under Part I, Item 1A and elsewhere in this Annual Report. See “Special Note Regarding Forward-Looking Statements” in this Annual Report.
Overview
We launched the zulily website in January 2010 with the goal of revolutionizing the way moms shop. Today, we are one of the largest standalone e-commerce companies in the United States. Through our desktop and mobile websites and mobile applications, which we refer to as our “sites”, we help our customers discover new and unique products at great values that they would likely not find elsewhere. We provide our customers with a fun and entertaining shopping experience with a fresh selection of flash sales events with thousands of product styles offered on a typical day. We source these products from thousands of vendors, including emerging brands and smaller boutique vendors, as well as larger national brands. By bringing together millions of customers and a daily selection of products chosen from our vendor base, we have built a large-scale and uniquely curated marketplace.
We sell our products through a flash sales model, with offerings typically only available for 72 hours and in a limited quantity, creating an urgency to browse and purchase. We sell children’s apparel, women’s apparel and
37
other categories such as toys, infant gear, kitchen accessories and home décor. Children’s apparel is our largest merchandise category today; however, we have expanded our categories over time such that all non-children’s apparel categories combined accounted for 57% of our North American units ordered in the fiscal year ended December 29, 2013, up from 45% in the fiscal year ended December 30, 2012. We focus on providing significant value to consumers across all of our categories; the average item on our sites is offered for over 50% off the manufacturer’s suggested retail price.
We plan to further grow our customer base by cost-effectively acquiring new email subscribers and users of our mobile applications through targeted marketing campaigns and then converting them into active customers. In addition, we regularly introduce new categories, brands and products to our customers and work to maximize the relevance of the items we display, thereby improving customer satisfaction, increasing customer loyalty and driving repeat purchasing.
Mobile is a large and growing part of our business. We have invested heavily in our mobile platform to optimize our sites for use on iPhones, iPads and Android-based devices. In the fourth quarter of 2013, approximately 45% of our North American orders were placed from a mobile device, up from approximately 31% in the fourth quarter of 2012.
We have built a merchandising organization specifically designed to source, cultivate and manage relationships with thousands of vendors, including emerging brands and smaller boutique vendors as well as larger national brands. To identify and support our vendors and effectively tell their stories to our customers, we have built a merchandising team and in-house photography studios, supported by a substantial and talented photo editing, copyrighting and editorial team. By sourcing a large number of vendors and providing them with strong support, we are able to offer our customers a broad and unique selection of curated products that is refreshed on a daily basis. Our vendor base is highly diversified with our largest vendor in the fiscal year ended December 29, 2013 accounting for less than 2% of our net sales.
We typically receive customer orders before we purchase inventory from our vendors, greatly reducing our inventory risk. The result of this dynamic is that we are able to offer a much larger range of products to our customers and to generate greater sales for our vendors, who are able to match a broader range of their product supply to actual customer demand. To best serve our customers and vendors, we have in place a custom, fully integrated fulfillment infrastructure. Our proprietary supply chain system enables us to efficiently handle the unique features of our flash sales model, including small to medium lot sizes and high inventory turnover. This allows us to sell lower price point products cost-effectively, without needing to pre-stock substantial inventory. Our business model together with our fulfillment infrastructure has enabled us to conduct successful events of all sizes, including smaller ones. In the fiscal year ended December 29, 2013, 88% of our events generated less than $50,000 of North American product sales, and these smaller events accounted for approximately 53% of our North American product sales.
We had initially outsourced order fulfillment, but in October 2011 we elected to develop our own fulfillment operations. As of December 29, 2013, we had 1.1 million square feet of leased fulfillment space at facilities in Nevada and Ohio. Our fulfillment operations regularly handle thousands of items a day from product styles that change each day and require different handling processes. Because we have deliberately established an intermediary model in which we do not pre-purchase substantial inventory, our shipping times are generally slower than e-commerce retailers that hold inventory. We are continually investing in our systems and infrastructure to improve order-to-ship times for sales of products in the North America.
To date, we have primarily focused on expanding our North American business and are just beginning to focus on our international strategy. In April 2012, we launched our first international site, with a small team based in the United Kingdom. For the fiscal year ended December 29, 2013 and the fiscal year ended December 30, 2012, we generated $13.9 million and $4.9 million in net sales from our U.K.-based sites, or 2.0% and 1.5% of total net sales, respectively. In addition, customers in foreign countries have the ability to make purchases on our North America-based sites and have their orders fulfilled through a third-party service provider. These purchases are included in our North America net sales. Purchases made on our U.K.-based sites are included in U.K. net sales. We are gradually increasing our level of investment in international expansion and plan to continue to invest in and develop international markets, balanced with a continued focus on building the core North American business, which includes Canada.
For the fiscal years ended December 29, 2013 and December 30, 2012, we reported $695.7 million and $331.2 million in net sales, representing growth of 110.0% and 132.4% from the fiscal year ended December 30,
38
2012 and January 1, 2012, respectively. For the fiscal year ended December 29, 2013, we reported net income of $12.9 million, an improvement from net losses of $10.3 million in the fiscal year ended December 30, 2012 and $11.3 million in the fiscal year ended January 1, 2012. For the fiscal year ended December 29, 2013, we reported $27.0 million in Adjusted EBITDA, an improvement from $(5.9) million and $(8.9) million in the fiscal years ended December 30, 2012 and January 1, 2012, respectively. We have been free cash flow positive on an annual basis since the fiscal year ended January 1, 2012.
Factors Affecting Our Performance
Ability to Attract Site Visitors at Reasonable Cost
To increase our sales, expand our market presence and grow our business profitably, we must continue to acquire email subscribers, users of our mobile applications and customers at reasonable costs. We use a wide range of paid and unpaid marketing channels, including affiliate channels and partners, customer referrals, direct navigation, display advertising, key word search campaigns, search engine optimization, social media and television ads, to attract potential new customers to our sites. We must maintain reasonable costs for these marketing efforts relative to the net sales we expect to derive from these visitors, once we convert them to customers. Failure to effectively attract new visitors, email subscribers and users of our mobile applications and convert them into customers on a cost-efficient basis would adversely affect our sales growth and operating results.
Customer Activation and Repeat Behavior
Once we have attracted potential new customers to our sites, and enrolled them as email subscribers or users of our mobile applications, our goal is to convert them into active customers and then encourage repeat purchases. We do this through a combination of strategies, including email and mobile “push” communications, personalized retargeting email messaging and other broad-based advertising campaigns.
Product Mix
Our products and categories have a range of margin profiles. Historically, variations in product mix and product or category margins have not generally been a significant driver of our business results. Going forward, however, shifts in product mix due to seasonality, purchasing trends, results of individual events or changes in the product margins of certain categories could affect our overall operating results or growth rates in a positive or negative manner. Internationally, we have limited results to evaluate whether product mix and product or category margins will be similar to those in our North American business and to the extent they are different, we may see an impact to our operating results.
Growth of Mobile Commerce
We expect that our customers will increasingly access our sites using mobile devices. From inception through December 29, 2013, customers who access our sites through a mobile device have typically had a higher lifetime value. Due to the relative newness of smartphones, tablets and mobile shopping in general, we do not know if this trend will continue or whether it is a result of our mobile interface or simply indicative of a customer demographic that is an early adopter of mobile commerce. If we are unable to continue to attract customers who are predisposed to engage in mobile shopping or if over the longer term mobile shoppers are not more active than other customers, our sales growth rate and operating results could be negatively affected.
Investment in Growth
We have aggressively invested in the growth of our business, and we intend to continue to do so. We anticipate that our operating expenses will increase substantially as we continue to expand our organization size in general, and our merchandising, technology, studio and fulfillment operations in particular. These increased expenses will result primarily from hiring additional employees, further developing our technology and scaling our fulfillment centers as our business grows. In addition, we may invest in infrastructure or capabilities that we believe will yield returns in the long term but for which there is not a near-term return.
Key Financial and Operating Metrics
We measure our business using both financial and operating metrics. We use these metrics to assess the progress of our business, make decisions on where to allocate capital, time and technology investments and
39
assess the near-term and longer-term performance of our business. The key financial and operating metrics we use are:
Fiscal Years | |||||||||||||||
2013 | 2012 | 2011 | 2010 | ||||||||||||
(in thousands, except revenue per active customer and average order value) | |||||||||||||||
Adjusted EBITDA | $ | 27,046 | $ | (5,920 | ) | $ | (8,871 | ) | $ | (3,734 | ) | ||||
Free cash flow | $ | 53,514 | $ | 8,425 | $ | 3,749 | $ | (1,164 | ) | ||||||
Active customers | 3,172 | 1,580 | 791 | 157 | |||||||||||
Revenue per active customer | $ | 219 | $ | 210 | $ | 180 | $ | 117 | |||||||
Total orders placed | 14,144 | 6,950 | 2,998 | 384 | |||||||||||
Average order value | $ | 54.75 | $ | 53.37 | $ | 53.48 | $ | 52.52 | |||||||
Adjusted EBITDA
Adjusted EBITDA is a non-GAAP financial measure that we calculate as earnings (loss) before interest and other income and expense, taxes, depreciation, amortization and stock-based compensation expense. Adjusted EBITDA is a key measure used by management to evaluate our operating performance, generate future operating plans and make strategic decisions regarding the allocation of capital. In particular, the exclusion of certain expenses in calculating Adjusted EBITDA facilitates operating performance comparisons on a period-to-period basis and, in the case of exclusion of the impact of stock-based compensation, excludes an item that we do not consider to be indicative of our core operating performance. Adjusted EBITDA is not a measure calculated in accordance with GAAP. Please see the section of this Annual Report captioned “Selected Financial and Other Data—Non-GAAP Financial Measures—Adjusted EBITDA” for a discussion of the limitations of Adjusted EBITDA and a reconciliation of Adjusted EBITDA to net income (loss) the most comparable GAAP measurement, for the periods presented.
Free Cash Flow
Free cash flow is a non-GAAP financial measure that we calculate as net cash provided by (used in) operating activities less net cash used in capital expenditures. We believe free cash flow is an important indicator of our business performance because it measures the amount of cash we generate. Free cash flow also reflects changes in working capital. Please see the section of this report captioned “Selected Financial and Other Data—Non-GAAP Financial Measures—Free Cash Flow” for a discussion of the limitations of free cash flow and a reconciliation of free cash flow to net cash provided by (used in) operating activities, the most directly comparable GAAP financial measure.
Non-GAAP diluted net income (loss) per share
Non-GAAP diluted net income (loss) per share is a financial measure which assumes the conversion of all outstanding shares of preferred stock at the beginning of the reporting period for periods prior to our IPO in November 2013. Our non-GAAP diluted net income (loss) per share also assumes all vesting of restricted stock occurred at the beginning of the applicable reporting periods. The numerator of the non-GAAP diluted net income (loss) per share calculation also excludes the effect of the deemed dividend which resulted from a preferred stock repurchase in Q4 2012. Assuming the conversion of preferred stock and the vesting of restricted stock at the beginning of the applicable reporting periods, as well as the exclusion of the deemed dividend, the result is the use of GAAP net income (loss) as the numerator and the denominator representing the weighted-average shares outstanding on an if-converted basis in the calculation of non-GAAP diluted net income (loss) per share for each period presented. We believe this measure is more comparable in understanding our past financial performance and future results. Please see the section of this report captioned “Selected Financial and Other Data—Non-GAAP Financial Measures—Non-GAAP Diluted Net Income (Loss)” for a discussion of the limitations of non-GAAP diluted net income (loss) and a reconciliation of GAAP diluted net income (loss) per share, the most directly comparable GAAP financial measure, to non-GAAP diluted net income (loss) per share.
Active Customers
40
We define an active customer as an individual customer who has purchased from us at least once in the last year. In any particular period, we determine our number of active customers by counting the total number of customers who have made at least one purchase in the preceding 12 month period, measured from the last date of such period. We view the number of active customers as a key indicator of our growth, the reach of our sites, the value proposition and consumer awareness of our brand, the continued use of our sites by our customers and their desire to purchase our products. Our number of active customers drives both net sales and our appeal to vendors.
Revenue Per Active Customer
We define revenue per active customer as our total net sales divided by our total number of active customers in any particular period. We view revenue per active customer as a key indicator of our customers’ pattern of use of our sites to purchase our products and a measure of our customers’ demand. It is important to note that the sum of the quarterly revenue per active customer amounts does not match our annual revenue per active customer amount. Each quarter has a different number of active customers which makes the sum of the quarterly calculations result in a different amount than the annual calculation.
Total Orders Placed
We define total orders placed as the total number of customer orders placed by our customers in any period. We view total orders placed as a key indicator of the velocity of our business and an indication of the desirability of our products and sites to our customers. We recognize revenue when an order is delivered and therefore total orders placed, together with average order value, is an indicator of the net sales we expect to recognize in a given period. Total orders placed and total orders delivered in any given period may differ slightly due to orders that are in transit at the end of any particular period.
Average Order Value
We define average order value as the sum of the total order values (including shipping and handling charges) in a given period divided by the total orders placed in that period. We view average order value as a key indicator of the desirability of our products and sites to our customers.
Components of Our Results of Operations
Net Sales
Net sales consist primarily of sales of children’s apparel, women’s apparel and other product categories, such as toys, infant gear, kitchen accessories and home décor. We recognize product sales at the time title transfers to the customer, which is generally at delivery. Net sales represent the sales of these items plus shipping and handling charges to customers, net of estimated returns and promotional discounts. Net sales are primarily driven by growth in our active customers, the frequency with which customers purchase and average order value. Net sales also include sales generated from the sale of services events, which are primarily electronic vouchers or access codes for our customers to redeem directly with the vendor. Net sales of services events have not been material to date.
Cost of Sales
Cost of sales consists of our purchase price for merchandise sold to customers, inbound and outbound shipping and handling costs, shipping supplies and fulfillment costs. Fulfillment costs represent those costs incurred in operating and staffing the fulfillment centers, including costs attributed to receiving, inspecting, picking, packaging and preparing customer orders for shipment. Cost of sales also includes direct and indirect labor costs for fulfillment center oversight, including payroll and related benefit costs and stock-based compensation expense. Cost of sales are primarily driven by growth in orders placed by customers, the mix of the product available for sale on our sites and transportation costs related to delivering orders to our customers.
Marketing Expenses
Marketing expenses consist primarily of targeted online marketing costs, such as display advertising, key word search campaigns, search engine optimization and social media, and offline marketing costs, such as print, radio and television advertising. Marketing expenses also include payroll and related benefit costs and stock-based compensation expense for our employees involved in marketing activities. Marketing expenses are primarily driven
41
by investments to grow and retain our customer base. In the longer term, we expect marketing expenses to decline as a percentage of net sales.
Selling, General and Administrative Expenses
Selling, general and administrative expenses consist primarily of payroll and related benefit costs and stock-based compensation expense for our employees involved in general corporate functions including customer service, merchandising, studio and technology, as well as costs associated with the use by these functions of facilities and equipment, including depreciation and rent. Selling, general and administrative expenses are primarily driven by increases in headcount required to support business growth. In the longer term, we expect selling, general and administrative expenses to decline as a percentage of net sales.
Interest Income (Expense)—Net
Interest income (expense)—net consists primarily of interest earned on cash, cash equivalents and short-term investments held by us.
Other Income (Expense)—Net
Other income (expense)—net consists primarily of income earned from our corporate purchasing card and foreign currency gains (losses).
RESULTS OF OPERATIONS
We have organized our operations into two principal segments: North America and the U.K. We present our segment information along the same lines that our Chief Executive Officer reviews our operating results in assessing performance and allocating resources.
Net Sales
Fiscal Years | Change | ||||||||||||||||||||||
2013 | 2012 | 2011 | 2013 to 2012 | 2012 to 2011 | |||||||||||||||||||
(dollars in thousands) | |||||||||||||||||||||||
Net sales: | |||||||||||||||||||||||
North America | $ | 681,826 | $ | 326,349 | $ | 142,545 | $ | 355,477 | 108.9% | $ | 183,804 | 128.9% | |||||||||||
U.K. | 13,883 | 4,891 | — | 8,992 | 183.8% | 4,891 | 100.0% | ||||||||||||||||
Consolidated | $ | 695,709 | $ | 331,240 | $ | 142,545 | $ | 364,469 | 110.0% | $ | 188,695 | 132.4% | |||||||||||
2013 Compared to 2012
The increase in North America net sales for the fiscal year ended December 29, 2013 compared to the fiscal year ended December 30, 2012 was primarily driven by an increase of 1.5 million active customers, or a 100.0% increase, and a 4.2% increase in revenue per active customer.
The U.K. segment launched in April of 2012 and operated for eight months in fiscal year 2012 versus twelve months in fiscal year 2013. For the fiscal year ended December 29, 2013 compared to the fiscal year ended December 30, 2012, the increase in revenue was primarily driven by the additional four months of operating activities as well as an increase in active customers of 0.1 million, or a 126.2% increase, and an increase in revenue per active customer of 26.0%.
2012 Compared to 2011
The increase in North America net sales for the fiscal year ended December 30, 2012 compared to the fiscal year ended January 1, 2012 was primarily driven by an increase of 0.7 million active customers, or a 93.9% increase, and a 18.3% increase in revenue per active customer.
42
We launched the U.K. segment during the fiscal year ended December 30, 2012 and thus the increase in sales as compared to the fiscal year ended January 1, 2012 relates to new customer acquisition where the U.K. segment ended the year with 0.05 million active customers.
Cost of Sales
Fiscal Years | Change | ||||||||||||||||||||||
2013 | 2012 | 2011 | 2013 to 2012 | 2012 to 2011 | |||||||||||||||||||
(dollars in thousands) | |||||||||||||||||||||||
Cost of sales | $ | 502,318 | $ | 240,943 | $ | 104,949 | $ | 261,375 | 108.5% | $ | 135,994 | 129.6% | |||||||||||
Percentage of net sales | 72.2 | % | 72.7 | % | 73.6 | % | |||||||||||||||||
2013 Compared to 2012
Of the increase in cost of sales, $188.8 million was due to the increase in products sold to our larger customer base. In addition, shipping and fulfillment costs increased $72.6 million as a result of the increase in products sold during the period.
2012 Compared to 2011
Of the increase in cost of sales, $101.3 million was due to the increase in products sold to our larger customer base. In addition, shipping and fulfillment costs increased $34.7 million as a result of higher overall level of net sales and the opening of our own fulfillment operations. In November 2011 and January 2012, we opened our fulfillment operations in Nevada and Ohio and discontinued our relationship with a third-party fulfillment company in April 2012. This allowed us to gain better control over our fulfillment operations and costs, which increased during the first part of the year as a result of operating three fulfillment centers during this transition to our own fulfillment operations.
Marketing Expenses
Fiscal Years | Change | ||||||||||||||||||||||
2013 | 2012 | 2011 | 2013 to 2012 | 2012 to 2011 | |||||||||||||||||||
(dollars in thousands) | |||||||||||||||||||||||
Marketing expenses | $ | 59,667 | $ | 37,780 | $ | 20,228 | $ | 21,887 | 57.9% | $ | 17,552 | 86.8% | |||||||||||
Percentage of net sales | 8.6 | % | 11.4 | % | 14.2 | % | |||||||||||||||||
The increase in marketing expenses for each period was primarily due to the increased number of new email subscribers acquired through paid online marketing channels, including display advertising, key word search campaigns, search engine optimization and social media, partially offset by a decrease in the average cost to acquire a new subscriber.
Selling, General and Administrative Expenses
Fiscal Years | Change | ||||||||||||||||||||||
2013 | 2012 | 2011 | 2013 to 2012 | 2012 to 2011 | |||||||||||||||||||
(dollars in thousands) | |||||||||||||||||||||||
Selling, general and administrative expenses | $ | 120,695 | $ | 63,071 | $ | 28,905 | $ | 57,624 | 91.4% | $ | 34,166 | 118.2% | |||||||||||
Percentage of net sales | 17.3 | % | 19.0 | % | 20.3 | % | |||||||||||||||||
2013 Compared to 2012
43
Of the increase in selling, general and administrative expenses, $30.9 million was due to the increase in salaries and related benefits and stock-based compensation expense as we continued to increase our headcount across functions to support business growth. To a lesser extent, this increase was attributable to a $8.6 million increase in our professional services costs as a result of business growth and a related increase in business complexity, a $6.0 million increase in our rent, depreciation and other facilities expense as a result of our business and headcount growth, and a $8.6 million increase in our merchant processing fees, which increase in total dollars as sales increase.
2012 Compared to 2011
Of the increase in selling, general and administrative expenses, $19.6 million was due to the increase in salaries and related benefits and stock-based compensation expense as we continued to increase our headcount as a result of business growth. To a lesser extent, this increase was attributable to a $4.0 million increase in our merchant processing fees, which increase in total dollars as sales increase, a $3.4 million increase in our professional services and contract labor costs as a result of business growth and a $3.2 million increase in our rent and related facilities costs as a result of our added fulfillment operations in Nevada and Ohio.
Interest Income (Expense)—Net
Interest income (expense)—net is primarily derived from interest income related to the investment of our cash and cash equivalents. Interest income (expense)—net for the fiscal year ended December 29, 2013, the fiscal year ended December 30, 2012 and the fiscal year ended January 1, 2012 totaled $0.1 million, $0.0 million and $0.0 million, respectively.
Other Income (Expense)—Net
Other income (expense)—net consists of income earned from our corporate purchasing card and foreign currency gains (losses). Other income (expense)—net for the fiscal year ended December 29, 2013, the fiscal year ended December 30, 2012 and the fiscal year ended January 1, 2012 totaled $0.1 million, $0.2 million and $0.2 million, respectively.
Income Taxes
We use the asset and liability method of accounting for income taxes. Under this method, deferred tax assets and liabilities are recognized by applying the statutory tax rates in effect in the years in which the differences between the financial reporting and tax filing bases of existing assets and liabilities are expected to reverse. We have considered past operating results, zulily's limited operating history and ongoing prudent and feasible tax planning strategies in assessing the need for a valuation allowance against our deferred tax assets. For all periods presented, we recorded a valuation allowance based on the amount of tax assets and loss carryforwards that we believe are more likely than not to go unused.
Quarterly Results of Operations and Other Financial and Operations Data
The following tables set forth selected unaudited quarterly results of operations and other financial and operations data for the eight quarters ended December 29, 2013, as well as the percentage that each line item represents of net sales. The information for each of these quarters has been prepared on the same basis as the audited annual financial statements included elsewhere in this Annual Report and in the opinion of management, includes all adjustments, which include only normal recurring adjustments, necessary for the fair statement of our consolidated results of operations for these periods. This data should be read in conjunction with our consolidated financial statements and related notes included elsewhere in this Annual Report. Our quarterly results of operations will vary in the future. These quarterly operating results are not necessarily indicative of our operating results for any future period.
44
Quarters Ended | |||||||||||||||||||||||||||||||
Dec. 29, 2013 | Sept. 29, 2013 | Jun. 30, 2013 | Mar. 31, 2013 | Dec. 30, 2012 | Sept. 30, 2012 | Jul. 1, 2012 | Apr. 1, 2012 | ||||||||||||||||||||||||
(in thousands, except per share amounts) | |||||||||||||||||||||||||||||||
Net sales | $ | 257,033 | $ | 166,655 | $ | 145,009 | $ | 127,012 | $ | 128,479 | $ | 75,767 | $ | 68,430 | $ | 58,564 | |||||||||||||||
Cost of sales | 188,658 | 122,154 | 101,106 | 90,400 | 93,887 | 55,804 | 49,014 | 42,238 | |||||||||||||||||||||||
Gross profit | 68,375 | 44,501 | 43,903 | 36,612 | 34,592 | 19,963 | 19,416 | 16,326 | |||||||||||||||||||||||
Operating expenses: | |||||||||||||||||||||||||||||||
Marketing expenses | 16,960 | 14,651 | 12,617 | 15,439 | 11,059 | 11,120 | 7,613 | 7,988 | |||||||||||||||||||||||
Selling, general and administrative expenses | 38,493 | 32,133 | 27,283 | 22,786 | 20,301 | 16,272 | 14,260 | 12,238 | |||||||||||||||||||||||
Total operating expenses | 55,453 | 46,784 | 39,900 | 38,225 | 31,360 | 27,392 | 21,873 | 20,226 | |||||||||||||||||||||||
Income (loss) from operations | 12,922 | (2,283 | ) | 4,003 | (1,613 | ) | 3,232 | (7,429 | ) | (2,457 | ) | (3,900 | ) | ||||||||||||||||||
Interest income (expense)—net | 50 | 22 | 32 | 32 | 21 | 6 | 9 | 7 | |||||||||||||||||||||||
Other income (expense)—net | 137 | 10 | (34 | ) | (14 | ) | (9 | ) | 5 | 134 | 46 | ||||||||||||||||||||
Net income (loss) before provision for income taxes | 13,109 | (2,251 | ) | 4,001 | (1,595 | ) | 3,244 | (7,418 | ) | (2,314 | ) | (3,847 | ) | ||||||||||||||||||
Provision for income taxes | (356 | ) | — | — | — | — | — | — | — | ||||||||||||||||||||||
Net income (loss) | $ | 12,753 | $ | (2,251 | ) | $ | 4,001 | $ | (1,595 | ) | $ | 3,244 | $ | (7,418 | ) | $ | (2,314 | ) | $ | (3,847 | ) | ||||||||||
Net income (loss) attributable to Class A and Class B common stockholders | $ | 4,526 | $ | (4,819 | ) | $ | — | $ | (4,126 | ) | $ | (30,724 | ) | $ | (8,216 | ) | $ | (3,175 | ) | $ | (4,708 | ) | |||||||||
Net income (loss) per share attributable to Class A and Class B common stockholders: | |||||||||||||||||||||||||||||||
Basic | $ | 0.05 | $ | (0.09 | ) | $ | — | $ | (0.09 | ) | $ | (0.71 | ) | $ | (0.21 | ) | $ | (0.09 | ) | $ | (0.14 | ) | |||||||||
Diluted | $ | 0.05 | $ | (0.09 | ) | $ | — | $ | (0.09 | ) | $ | (0.71 | ) | $ | (0.21 | ) | $ | (0.09 | ) | $ | (0.14 | ) | |||||||||
Quarters Ended | |||||||||||||||||||||||
Dec. 29, 2013 | Sept. 29, 2013 | Jun. 30, 2013 | Mar. 31, 2013 | Dec. 30, 2012 | Sept. 30, 2012 | Jul. 1, 2012 | Apr. 1, 2012 | ||||||||||||||||
Net sales | 100.0 | % | 100.0 | % | 100.0 | % | 100.0 | % | 100.0 | % | 100.0 | % | 100.0 | % | 100.0 | % | |||||||
Cost of sales | 73.4 | 73.3 | 69.7 | 71.2 | 73.1 | 73.7 | 71.6 | 72.1 | |||||||||||||||
Gross profit | 26.6 | 26.7 | 30.3 | 28.8 | 26.9 | 26.3 | 28.4 | 27.9 | |||||||||||||||
Operating expenses: | |||||||||||||||||||||||
Marketing expenses | 6.6 | 8.8 | 8.7 | 12.2 | 8.6 | 14.7 | 11.1 | 13.6 | |||||||||||||||
Selling, general and administrative expenses | 15.0 | 19.3 | 18.8 | 17.9 | 15.8 | 21.5 | 20.8 | 20.9 | |||||||||||||||
Total operating expenses | 21.6 | 28.1 | 27.5 | 30.1 | 24.4 | 36.2 | 31.9 | 34.5 | |||||||||||||||
Income (loss) from operations | 5.0 | (1.4 | ) | 2.8 | (1.3 | ) | 2.5 | (9.9 | ) | (3.5 | ) | (6.7 | ) | ||||||||||
Interest income (expense)—net | — | — | — | — | — | — | — | — | |||||||||||||||
Other income (expense)—net | 0.1 | — | — | — | — | — | 0.2 | 0.1 | |||||||||||||||
Net income (loss) before provision for income taxes | 5.1 | (1.4 | ) | 2.8 | (1.3 | ) | 2.5 | (9.9 | ) | (3.3 | ) | (6.6 | ) | ||||||||||
Provision for income taxes | (0.1 | ) | — | — | — | — | — | — | — | ||||||||||||||
Net income (loss) | 5.0 | % | (1.4 | )% | 2.8 | % | (1.3 | )% | 2.5 | % | (9.9 | )% | (3.3 | )% | (6.6 | )% | |||||||
45
Quarters Ended | |||||||||||||||||||||||||||||||
Dec. 29, 2013 | Sept. 29, 2013 | Jun. 30, 2013 | Mar. 31, 2013 | Dec. 30, 2012 | Sept. 30, 2012 | Jul. 1, 2012 | Apr. 1, 2012 | ||||||||||||||||||||||||
(in thousands, except revenue per active customer and average order value) | |||||||||||||||||||||||||||||||
Other Financial and Operations Data | |||||||||||||||||||||||||||||||
Adjusted EBITDA(1) | $ | 17,786 | $ | 1,791 | $ | 7,017 | $ | 452 | $ | 4,719 | $ | (6,190 | ) | $ | (1,337 | ) | $ | (3,112 | ) | ||||||||||||
Free cash flow(2) | $ | 36,990 | $ | 20,764 | $ | (4,844 | ) | $ | 604 | $ | 13,038 | $ | 5,463 | $ | (5,691 | ) | $ | (4,385 | ) | ||||||||||||
Active customers | 3,172 | 2,632 | 2,229 | 1,906 | 1,580 | 1,344 | 1,154 | 1,018 | |||||||||||||||||||||||
Revenue per active customer | $ | 81 | $ | 63 | $ | 65 | $ | 67 | $ | 81 | $ | 56 | $ | 59 | $ | 58 | |||||||||||||||
Total orders placed | 4,796 | 3,652 | 2,815 | 2,881 | 2,328 | 1,843 | 1,369 | 1,410 | |||||||||||||||||||||||
Average order value | $ | 56.23 | $ | 55.16 | $ | 53.42 | $ | 53.05 | $ | 54.61 | $ | 53.57 | $ | 52.32 | $ | 52.07 | |||||||||||||||
(1) | Adjusted EBITDA is a non-GAAP financial measure that we calculate as earnings (loss) before interest and other income and expense, taxes, depreciation, amortization and stock-based compensation expense. Please see the section of this Annual Report captioned “Selected Financial and Other Data—Non-GAAP Financial Measures—Adjusted EBITDA” for more information. |
The following table reflects the reconciliation of net income (loss) to Adjusted EBITDA:
Quarters Ended | |||||||||||||||||||||||||||||||
Dec. 29, 2013 | Sept. 29, 2013 | Jun. 30, 2013 | Mar. 31, 2013 | Dec. 30, 2012 | Sept. 30, 2012 | Jul. 1, 2012 | Apr. 1, 2012 | ||||||||||||||||||||||||
(in thousands) | |||||||||||||||||||||||||||||||
Net income (loss) | $ | 12,753 | $ | (2,251 | ) | $ | 4,001 | $ | (1,595 | ) | $ | 3,244 | $ | (7,418 | ) | $ | (2,314 | ) | $ | (3,847 | ) | ||||||||||
Excluding: | |||||||||||||||||||||||||||||||
Interest (income) expense—net | (50 | ) | (22 | ) | (32 | ) | (32 | ) | (21 | ) | (6 | ) | (9 | ) | (7 | ) | |||||||||||||||
Other (income) expense—net | (137 | ) | (10 | ) | 34 | 14 | 9 | (5 | ) | (134 | ) | (46 | ) | ||||||||||||||||||
Taxes | 356 | — | — | — | — | — | — | — | |||||||||||||||||||||||
Depreciation and amortization | 1,983 | 1,778 | 1,312 | 1,167 | 1,039 | 889 | 799 | 642 | |||||||||||||||||||||||
Stock-based compensation expense | 2,881 | 2,296 | 1,702 | 898 | 448 | 350 | 321 | 146 | |||||||||||||||||||||||
Adjusted EBITDA | $ | 17,786 | $ | 1,791 | $ | 7,017 | $ | 452 | $ | 4,719 | $ | (6,190 | ) | $ | (1,337 | ) | $ | (3,112 | ) | ||||||||||||
(2) | Free cash flow is a non-GAAP financial measure that we calculate as net cash provided by (used in) operating activities less net cash used in capital expenditures. Please see the section of this Annual Report captioned “Selected Financial and Other Data—Non-GAAP Financial Measures—Free Cash Flow” for more information. |
The following table reflects the reconciliation of net cash provided by (used in) operating activities to free cash flow:
Quarters Ended | |||||||||||||||||||||||||||||||
Dec. 29, 2013 | Sept. 29, 2013 | Jun. 30, 2013 | Mar. 31, 2013 | Dec. 30, 2012 | Sept. 30, 2012 | Jul. 1, 2012 | Apr. 1, 2012 | ||||||||||||||||||||||||
(in thousands) | |||||||||||||||||||||||||||||||
Net cash provided by operating activities | $ | 43,876 | $ | 25,241 | $ | 494 | $ | 3,509 | $ | 15,332 | $ | 6,998 | $ | (4,676 | ) | $ | (1,371 | ) | |||||||||||||
Capital expenditures | (6,886 | ) | (4,477 | ) | (5,338 | ) | (2,905 | ) | (2,294 | ) | (1,535 | ) | (1,015 | ) | (3,014 | ) | |||||||||||||||
Free cash flow | $ | 36,990 | $ | 20,764 | $ | (4,844 | ) | $ | 604 | $ | 13,038 | $ | 5,463 | $ | (5,691 | ) | $ | (4,385 | ) | ||||||||||||
Net cash used in investing activities | $ | (6,297 | ) | $ | (4,477 | ) | $ | (15,338 | ) | $ | (2,824 | ) | $ | (2,413 | ) | $ | 303 | $ | 685 | $ | 1,286 | ||||||||||
Net cash provided by financing activities | $ | 149,974 | $ | (1,201 | ) | $ | 113 | $ | 45 | $ | 52,445 | $ | 3 | $ | 13 | $ | 32 | ||||||||||||||
A reconciliation of non-GAAP net income (loss) attributable to common stockholders to GAAP income (loss) attributable to common stockholders, the most directly comparable GAAP financial measure, and non-GAAP dilutive shares to GAAP dilutive shares, the most directly comparable GAAP financial measure, in order to calculate non-GAAP dilutive net income (loss) per share for each period presented, is as follows:
46
Quarters Ended | |||||||||||||||
Dec. 29, 2013 | Sept. 29, 2013 | Jun. 30, 2013 | Mar. 31, 2013 | ||||||||||||
(in thousands, except share and per share amounts) | |||||||||||||||
GAAP net income (loss) attributable to common stockholders | $ | 4,526 | $ | (4,819 | ) | $ | — | $ | (4,126 | ) | |||||
Add: Preferred stock deemed dividend | — | — | — | — | |||||||||||
Add: Accretion of convertible redeemable preferred stock | 1,344 | 2,568 | 2,531 | 2,531 | |||||||||||
Add: Undistributed earnings attributable to participating securities | 5,267 | — | 1,470 | — | |||||||||||
Add: Allocation of undistributed earnings to preferred stock | 1,616 | — | — | — | |||||||||||
Non-GAAP net income (loss) attributable to common stockholders | 12,753 | (2,251 | ) | 4,001 | (1,595 | ) | |||||||||
GAAP Weighted average shares used to compute diluted net income (loss) per Class A and Class B common share | 96,193,651 | 53,495,263 | 49,891,357 | 46,422,029 | |||||||||||
Add: Convertible preferred stock | 31,309,868 | 60,621,233 | 60,621,233 | 60,621,233 | |||||||||||
Add: Unvested restricted stock | 163,404 | 1,471,290 | 4,788,605 | 8,154,884 | |||||||||||
Add: Additional dilutive effect of stock options | — | — | 1,260,253 | — | |||||||||||
Non-GAAP Weighted average shares used to compute diluted net income (loss) per Class A and Class B common share | 127,666,923 | 115,587,786 | 116,561,448 | 115,198,146 | |||||||||||
Non-GAAP net income (loss) per share attributable to Class A and Class B common stockholders | $ | 0.10 | $ | (0.02 | ) | $ | 0.03 | $ | (0.01 | ) | |||||
47
Quarters Ended | |||||||||||||||
Dec. 30, 2012 | Sept. 30, 2012 | Jul. 1, 2012 | Apr. 1, 2012 | ||||||||||||
(in thousands, except share and per share amounts) | |||||||||||||||
GAAP net income (loss) attributable to common stockholders | $ | (30,724 | ) | $ | (8,216 | ) | $ | (3,175 | ) | $ | (4,708 | ) | |||
Add: Preferred stock deemed dividend | 32,112 | — | — | — | |||||||||||
Add: Accretion of convertible redeemable preferred stock | 1,856 | 796 | 861 | 862 | |||||||||||
Add: Undistributed earnings attributable to participating securities | — | — | — | — | |||||||||||
Add: Allocation of undistributed earnings to preferred stock | — | — | — | — | |||||||||||
Non-GAAP net income (loss) attributable to common stockholders | 3,244 | (7,420 | ) | (2,314 | ) | (3,846 | ) | ||||||||
GAAP Weighted average shares used to compute diluted net income (loss) per Class A and Class B common share | 43,051,652 | 39,654,007 | 36,299,501 | 32,901,671 | |||||||||||
Add: Convertible preferred stock | 58,798,629 | 54,862,068 | 54,862,068 | 54,862,068 | |||||||||||
Add: Unvested restricted stock | 11,484,439 | 14,801,754 | 18,122,503 | 21,466,403 | |||||||||||
Add: Additional dilutive effect of stock options | 3,605,666 | — | — | — | |||||||||||
Non-GAAP Weighted average shares used to compute diluted net income (loss) per Class A and Class B common share | 116,940,386 | 109,317,829 | 109,284,072 | 109,230,142 | |||||||||||
Non-GAAP net income (loss) per share attributable to Class A and Class B common stockholders | $ | 0.03 | $ | (0.07 | ) | $ | (0.02 | ) | $ | (0.04 | ) | ||||
Liquidity and Capital Resources
We believe that our existing cash and cash equivalents, together with cash generated from operations and the revolving credit facility entered into during January 2014, will provide sufficient liquidity to meet our operational needs for the foreseeable future. However, our liquidity assumptions may prove to be incorrect, and we could exhaust our available financial resources sooner than we currently expect. In addition, we may elect to raise additional funds at any time through equity, equity-linked or debt financing arrangements. Our future capital requirements and the adequacy of available funds will depend on many factors, including those described in the section of the report captioned “Risk Factors.” We may not be able to secure additional financing to meet our operating requirements on acceptable terms, or at all.
At December 29, 2013, our cash and cash equivalents balance was $290.1 million, with an additional $18.0 million held in short-term investments. Cash and cash equivalents primarily consist of cash deposits and money market funds. Cash held internationally as of December 29, 2013 was not material.
Prior to our IPO, we financed our operations and capital expenditures through private sales of preferred stock and cash flows from our operations. On November 20, 2013, we closed our IPO, in which 13,225,000 shares of Class A common stock were sold to the public (inclusive of 7,334,125 shares of Class A common stock sold by us). The public offering price of the shares sold in the IPO was $22.00 per share. We did not receive any proceeds from the sale of shares by the selling stockholders in the IPO. The total net proceeds from the offering to us were $147.5 million after deducting the underwriting discount with respect to the shares offered by us of approximately $10.5 million and offering expenses totaling $3.3 million.
Cash flow information is as follows:
48
Fiscal Years | |||||||||||
2013 | 2012 | 2011 | |||||||||
(in thousands) | |||||||||||
Cash provided by (used in): | |||||||||||
Operating activities | $ | 73,120 | $ | 16,283 | $ | 8,864 | |||||
Investing activities | (28,936 | ) | (139 | ) | (21,615 | ) | |||||
Financing activities | 148,931 | 52,493 | 31,955 | ||||||||
Net Cash Provided by Operating Activities
Our cash flow provided by operating activities is significantly impacted by volume of customer orders from an increased active customer base as compared to prior periods. The impact of the higher volume of orders results in net sales growth year-over-year, where we have experienced greater than 100% growth in each of the past three fiscal years. The increased order volumes drive increased inventory purchases, increased fulfillment activities and a greater investment in infrastructure including human capital. The below noted timing differences are a result of the significant increase in order volumes and net sales experienced year-over-year.
During each period presented, the increase in deferred revenue was primarily due to an increase in customer orders during the period which had not been delivered as of the end of the period. The changes in inventory were primarily due to changes in the number of items sold, which were either in the fulfillment centers awaiting shipment to customers or in-transit to customers. The increase in accounts payable and accrued expenses in each of the periods was primarily due to the growth in the business during the periods presented, which primarily relate to amounts owed to vendors for products sold on our sites, transportation expenses for products being shipped into and out of our fulfillment centers and member and customer acquisition marketing expenses.
Net cash provided by operating activities was $73.1 million for the fiscal year ended December 29, 2013, as a result of net income of $12.9 million, adding back non-cash charges of $14.1 million and changes in our operating assets and liabilities that provided $46.1 million in positive cash flow. Non-cash charges primarily consisted of stock-based compensation expense of $7.8 million and depreciation and amortization of $6.2 million. The net changes in our operating assets and liabilities was a result of increased deferred revenue of $13.6 million, accounts payable of $20.8 million and accrued expenses of $21.1 million, offset by increases in inventory of $5.4 million, accounts receivable of $2.1 million and prepaid expenses of $2.3 million. The increases in accounts receivable, inventory, deferred revenue, accounts payable and accrued expenses were primarily due to growth in events, orders and net sales during the period.
Net cash provided by operating activities was $16.3 million for the fiscal year ended December 30, 2012, as a result of a net loss of $10.3 million, adding back non-cash charges of $4.7 million and changes in our operating assets and liabilities that provided $21.9 million in positive cash flow. Non-cash charges primarily consisted of stock-based compensation expense of $1.3 million and depreciation and amortization of $3.4 million. The net changes in our operating assets and liabilities was a result of increased accounts payable of $14.2 million, accrued expenses of $8.3 million, and deferred revenue of $6.1 million, partially offset by a $3.0 million increase in inventory and a $2.4 million increase in accounts receivable. The increase in accounts payable and accrued expenses was primarily due to the growth in the business during the period. The increase in accounts receivable represented funds collected from our credit card processor, which were in-transit to us.
Net cash provided by operating activities was $8.9 million for the fiscal year ended January 1, 2012, as a result of net loss of $11.3 million, adding back non-cash charges of $2.7 million and changes in our operating assets and liabilities that provided $17.5 million in positive cash flow. Non-cash charges primarily consisted of stock-based compensation expense of $2.1 million and depreciation and amortization expense of $0.6 million. The net changes in our operating assets and liabilities was a result of increased accounts payable of $16.3 million, accrued expenses of $4.6 million and deferred revenue of $2.5 million, partially offset by a $4.0 million increase in inventory.
Net Cash Used in Investing Activities
Our investing activities have consisted of purchases of property and equipment to support our fulfillment centers and our overall business growth as well as short-term investments of our excess cash. Purchases of property and equipment may vary from period-to-period due to timing of our expansion of our operations. Additionally, we have invested some of our excess cash balances in money market funds and commercial paper.
49
Net cash used in investing activities was $28.9 million in the fiscal year ended December 29, 2013. This was primarily attributable to purchases of short-term investments related to excess cash of $36.0 million and $19.6 million in capital expenditures, which related to additional equipment for our fulfillment centers as well as software purchases and internally developed software offset by proceeds from maturities of securities of $26.0 million, which were transferred to cash.
Net cash used in investing activities was $0.1 million in the fiscal year ended December 30, 2012. This was primarily attributable to $7.9 million in capital expenditures, which related to equipment for our fulfillment centers, software purchases, internally developed software and hardware purchases for employees and general operations offset by $5.8 million in proceeds from available for sale investments, which were transferred to cash.
Net cash used in investing activities was $21.6 million in the fiscal year ended January 1, 2012. This was primarily attributable to cash transferred into short-term investments of $14.0 million, in addition to $5.1 million in capital expenditures, which related to software purchases, internally developed software and hardware purchases for employees and general operations.
Capital expenditures are expected to range between $45.0 million to $55.0 million in fiscal 2014, primarily for our fulfillment centers to support our growth as we continue to scale.
Net Cash Provided by Financing Activities
Net cash provided by financing activities was $148.9 million in the fiscal year ended December 29, 2013. This was primarily attributable to the receipt of $150.9 million in proceeds from our IPO, net of $10.5 million of underwriter discount associated with sales of shares by us in the transaction and $1.0 million in proceeds from the exercise of stock options. Offsetting this is $2.9 million of offering expenses paid related to the IPO.
Net cash provided by financing activities was $52.5 million in the fiscal year ended December 30, 2012. This was primarily attributable to net proceeds from preferred stock financing of $85.0 million offset by the repurchase of preferred stock from existing investors of $32.5 million.
Net cash provided by financing activities was $32.0 million in the fiscal year ended January 1, 2012. This was primarily attributable to net proceeds from preferred stock financing of $31.9 million and from common stock financing of $11.0 million offset by the repurchase of common stock from existing employees of $11.0 million.
Credit Facility
On January 23, 2014, we entered into a $50 million revolving credit facility pursuant to a Credit Agreement with certain lenders. Loans under the Credit Agreement will mature on January 23, 2016. The Credit Agreement includes a letter of credit sub-limit of up to $15 million.
Amounts drawn down under the Credit Agreement bear interest, at our option, in an amount equal to (i) in the case of base rate loans, 1.50% plus the highest of (a) the Federal Funds Rate plus one-half of one percent (0.50%), (b) the prime rate, and (c) the eurodollar rate plus two percent (2.00%), or (ii) in the case of eurodollar loans, for any interest period, LIBOR plus 2.50%. An undrawn commitment fee shall be payable to the lenders in an amount equal to 0.175% times the actual daily amount by which the aggregate commitments exceed the sum of the outstanding amount of loans and the outstanding amount of letter of credit obligations, calculated on a quarterly basis in arrears.
We are permitted to make voluntary prepayments at any time without payment of a premium, provided that we will be subject to a breakage indemnity in the case of prepayments of LIBOR loans.
The Credit Agreement contains customary representations and warranties and customary affirmative and negative covenants, in each case applicable to us and our subsidiaries. The negative covenants include restrictions on, among other things, indebtedness, liens, investments, mergers, dispositions, dividends and other distributions. The Credit Agreement contains certain financial covenants that require us and our subsidiaries to, among other things, maintain a minimum fixed charge coverage ratio of 1.35 to 1.0 and minimum quick ratio of 1.1 to 1.0, and requires us to maintain a senior leverage ratio not in excess of 2.0 to 1.0.
The Credit Agreement includes customary events of default, including a change of control and a cross-default on our or any subsidiary’s material indebtedness. Our obligations under the Credit Agreement are secured
50
by substantially all of our and our subsidiaries’ assets, and the Company’s obligations under the Credit Agreement will be guaranteed by certain of our subsequently acquired or organized direct and indirect domestic subsidiaries.
As of the filing date of this Annual Report, no amounts have been drawn down under the revolving credit facility.
Off Balance Sheet Arrangements
We did not have any off balance sheet arrangements in the fiscal year ended December 29, 2013, December 30, 2012 or January 1, 2012, except for operating leases as discussed below.
Contractual Obligations
We lease various office and fulfillment facilities, including our corporate headquarters in Seattle, Washington under operating lease agreements that expire from 2014 to 2024. The terms of the lease agreements provide for rental payments on a graduated basis. We recognize rent expense on a straight-line basis over the lease periods. We do not have any debt or material capital lease obligations and all of our property, equipment and software have been purchased with cash. We have no material long-term purchase obligations outstanding with any vendors or third parties. Our future minimum payments under non-cancelable operating leases for equipment and office facilities are as follows as of December 29, 2013:
Payments Due by Period | |||||||||||||||||||
Total | Less Than 1 Year | 1 - 3 Years | 3 - 5 Years | More Than 5 Years | |||||||||||||||
(in thousands) | |||||||||||||||||||
Operating lease obligations(1) | $ | 84,863 | $ | 8,059 | $ | 17,626 | $ | 16,078 | $ | 43,100 | |||||||||
(1) | The contractual obligation amounts in the table above exclude our lease agreement for a new Nevada fulfillment center, executed on January 24, 2014 and more fully described below. |
On January 24, 2014, we entered into a lease agreement for a new Nevada fulfillment center. The 12-year lease is for approximately 48 acres of land, including a warehouse/distribution building containing approximately 707,010 square feet of ground floor, to be constructed by the landlord. The property is located in McCarran, Nevada.
The initial term of this lease is estimated to commence on the earlier of completion of the warehouse/distribution building or the date we commence business operations from the leased property. We will be obligated to pay approximately $1.3 million in annual base rent in the first year, which shall increase by 1.75% each year. We will also be obligated to pay operating expenses, including property management fees, and to deliver a letter of credit in the amount of $3 million.
Pursuant to this lease, if we provide at least six (6) months' notice prior to the expiration of the then-current term, we have the option to extend this lease for three (3) additional five-year terms, with certain increases in base rent.
The contractual commitment amounts in the table above are associated with agreements that are enforceable and legally binding. Obligations under contracts that we can cancel without a significant penalty are not included in the table above.
Critical Accounting Policies and Estimates
Our management’s discussion and analysis of our financial condition and results of operations is based on our consolidated financial statements, which have been prepared in accordance with GAAP. The preparation of these consolidated financial statements requires us to make estimates and assumptions that affect the reported amounts of assets, liabilities, net sales, expenses and related disclosures. We evaluate our estimates and assumptions on an ongoing basis. Our estimates are based on historical experience and various other assumptions that we believe to be reasonable under the circumstances. Our actual results could differ from these estimates.
51
We believe that the assumptions and estimates associated with revenue recognition, inventories, income taxes and stock-based compensation have the greatest potential impact on our consolidated financial statements. Therefore, we consider these to be our critical accounting policies and estimates. For further information on all of our significant accounting policies, please see Note 2: "Summary of Significant Accounting Policies" within the Notes to the Consolidated Financial Statements within Item 8 of Part II of this Annual Report.
Revenue Recognition
We generate net sales from sales of children’s apparel, women’s apparel and other categories, such as toys, infant gear, kitchen accessories and home décor. We generate net sales from shipping and handling charges to our customers. We also generate net sales from the sale of services events, which are primarily electronic vouchers or access codes for our customers to redeem directly with the vendor.
We recognize revenue when the following criteria are met: (1) persuasive evidence of an arrangement exists; (2) delivery has occurred; (3) the selling price is fixed or determinable; and (4) collectability is reasonably assured. For product sales, these criteria are met when the customer orders an item through our sites via the electronic shopping cart, funds are collected from the customer and the item is fulfilled in one of our or third-party fulfillment centers, shipped and delivered to the customer. Revenue from product sales is generally recorded at the gross amount as we are the primary obligor in the arrangement with the customer, have latitude in establishing the products available for sale and the price to the customer, are responsible for ensuring the delivery of the product to the customer and assume inventory and credit risk. For services sales, these criteria are met when the customer orders an item through our sites via the electronic shopping cart, funds are collected from the customer and the voucher or access code is downloaded from our sites. Revenue from services sales is generally recorded at the net amount, or the commission earned on the voucher, as we are acting as an agent on behalf of the vendor. The vendor is ultimately responsible for fulfilling the customer order directly with the customer and assumes the inventory risk. To date, services revenues have not been material. We defer revenue when cash is collected from our customer prior to the satisfaction of the revenue recognition criteria.
To encourage customers to purchase our products and services, we periodically provide incentive offers. Generally, these promotions include dollar-off and percentage-off discounts to be applied against current purchases. We also grant merchandise credits to participants in our referral program when the customer referral results in a sale. Merchandise credits issued through the referral program typically expire in 18 months. We record these discounts and merchandise credits as reductions of sales price at the date the promotion is redeemed. Additionally, we provide customers merchandise credits to be applied against future purchases in instances in which the customer is unsatisfied with an order. In these instances, we have established a sales return reserve based on our historical experience. To date, these reserves have not been significant.
Income Taxes
We use the asset and liability method of accounting for income taxes. Under this method, deferred tax assets and liabilities are recognized by applying the statutory tax rates in effect in the years in which the differences between the financial reporting and tax filing bases of existing assets and liabilities are expected to reverse. We have considered past operating results, our limited operating history, and ongoing prudent and feasible tax planning strategies in assessing the need for a valuation allowance against our deferred tax assets.
Stock-Based Compensation
Stock-based compensation is measured at the grant date based on the fair value of the award and is recognized as expense, net of estimated forfeitures, over the requisite service period, which is generally the vesting period of the award.
Prior to the IPO, all of our stock-based awards were for Class B common stock whereas stock-based awards granted subsequent to the IPO were for Class A common stock. All references to common stock in this “Stock-Based Compensation” section are to our Class A common stock and Class B common stock, as applicable.
Determining the fair value of stock-based awards at the grant date represents management’s best estimates, but the estimates involve inherent uncertainties and the application of management’s judgment. We use the Black-Scholes option pricing model to determine the fair value of stock options. The determination of the grant date fair value of options using an option pricing model is affected by our estimated common stock fair value, prior to the IPO, as well as assumptions regarding a number of other complex and subjective variables. These variables
52
include the fair value of our common stock, our expected stock price volatility over the expected term of the options, stock option exercise and cancellation behaviors, risk-free interest rates and expected dividends, which are estimated as follows:
• | Fair Value of Our Common Stock. Prior to the IPO our common stock was not publicly traded and we estimated the fair value of the common stock as discussed in "Pre-IPO Common Stock Valuations" below. Following our IPO, we established a policy of using the closing sale price per share of our common stock as quoted on the NASDAQ Global Select Market on the date of grant for purposes of determining the exercise price per share of our options to purchase common stock. |
• | Expected Term. The expected term for stock options granted to employees (including members of our board of directors) was estimated using the simplified method allowed under SEC guidance. For grants to nonemployees, the expected term is equal to the contractual term, which is generally ten years. |
• | Expected Volatility. Given the limited trading history for our common stock, the expected stock price volatility for our common stock was estimated by taking the average historical price volatility for industry peers, which we have designated, based on daily price observations over a period equivalent to the expected term of the stock option grants. Industry peers, which we have designated, consist of several public companies in the industry similar in size, stage of life cycle and financial leverage. We intend to continue to consistently apply this process using the same or similar public companies until a sufficient amount of historical information regarding the volatility of our own common stock share price becomes available, or unless circumstances change such that the identified companies are no longer similar to us, in which case more suitable companies whose share prices are publicly available would be used in the calculation. |
• | Risk-free Interest Rate. The risk-free interest rate is based on the yields of U.S. Treasury securities with maturities similar to the expected term of the options for each option group. |
• | Expected Dividend Yield. We have never declared or paid any cash dividends to common stockholders and do not presently plan to pay cash dividends in the foreseeable future. Consequently, we used an expected dividend yield of zero. |
Pre-IPO Common Stock Valuations
Prior to the IPO, the fair value of the common stock underlying our stock options was approved by our board of directors, which intended all options granted to be exercisable at a price per share equal to the per-share fair value of our common stock underlying those options on the date of grant. The valuations of our common stock were determined in accordance with the guidelines outlined in the American Institute of Certified Public Accountants Practice Aid, Valuation of Privately-Held-Company Equity Securities Issued as Compensation. Because there had been no public market for our common stock, the board of directors with input from management exercised significant judgment and considered numerous objective and subjective factors to determine the fair value of common stock as of the date of each option grant, including the following factors:
• | contemporaneous third-party valuations of our common stock; |
• | the prices, rights, preferences and privileges of preferred stock relative to the common stock; |
• | the prices of preferred stock sold to third-party investors in arms-length transactions; |
• | the prices of common stock sold to third-party investors in secondary transactions or repurchased by us in arms-length transactions; |
• | our operating and financial performance; |
• | current business conditions and projections; |
• | our stage of development; |
53
• | the likelihood of achieving a liquidity event for the shares of common stock underlying these stock options, such as an initial public offering or sale of the company, given prevailing market conditions; |
• | any adjustment necessary to recognize a lack of marketability for common stock; |
• | the market performance of comparable publicly traded companies; and |
• | the U.S. and global capital market conditions. |
In order to determine the fair value of our common stock underlying option grants issued, we determined the enterprise value, added net cash, then allocated the equity value to each class of equity securities outstanding (preferred stock, common stock and options).
Item 7A. Quantitative and Qualitative Disclosures about Market Risk
We have operations both within the United States and internationally, and we are exposed to market risks in the ordinary course of our business, including the effects of foreign currency fluctuations, interest rate changes and inflation. Information relating to quantitative and qualitative disclosures about these market risks is set forth below.
Interest Rate Sensitivity
Cash and cash equivalents and short-term investments were held primarily in cash deposits and money market funds. The fair value of our cash, cash equivalents and short-term investments would not be significantly affected by either an increase or decrease in interest rates due mainly to the short-term nature of these instruments. Interest on any revolver borrowings incurred pursuant to the credit facility described above would accrue at a floating rate based on a formula tied to certain market rates at the time of incurrence, as described above; however, we do not expect that any change in prevailing interest rates will have a material impact on our results of operations.
Foreign Currency Risk
Most of our sales are denominated in U.S. dollars, and therefore, our revenues are not currently subject to significant foreign currency risk. Our operating expenses are denominated in the currencies of the countries in which our operations are located, and may be subject to fluctuations due to changes in foreign currency exchange rates, particularly changes in the British Pound and European Euro. Fluctuations in foreign currency exchange rates may cause us to recognize transaction gains and losses in our statements of operations. To date, foreign currency transaction gains and losses have not been material to our financial statements, and we have not engaged in any foreign currency hedging transactions.
Inflation
We do not believe that inflation has had a material effect on our business, financial condition or results of operations. We continue to monitor the impact of inflation in order to minimize its effects through pricing strategies, productivity improvements and cost reductions. If our costs were to become subject to significant inflationary pressures, we may not be able to fully offset such higher costs through price increases. Our inability or failure to do so could harm our business, financial condition and results of operations.
54
Item 8. Financial Statements and Supplementary Data.
ZULILY, INC.
INDEX TO CONSOLIDATED FINANCIAL STATEMENTS
Page | |
55
REPORT OF INDEPENDENT REGISTERED PUBLIC ACCOUNTING FIRM
To the Board of Directors and Stockholders of
zulily, inc.
Seattle, Washington
We have audited the accompanying consolidated balance sheets of zulily, inc. and subsidiary (the “Company”) as of December 29, 2013 and December 30, 2012, and the related consolidated statements of operations, comprehensive operations, convertible redeemable preferred stock and stockholders’ equity (deficit), and cash flows for each of the three years in the period ended December 29, 2013. These financial statements are the responsibility of the Company’s management. Our responsibility is to express an opinion on these financial statements based on our audits.
We conducted our audits in accordance with the standards of the Public Company Accounting Oversight Board (United States). Those standards require that we plan and perform the audit to obtain reasonable assurance about whether the financial statements are free of material misstatement. The Company is not required to have, nor were we engaged to perform, an audit of its internal control over financial reporting. Our audits included consideration of internal control over financial reporting as a basis for designing audit procedures that are appropriate in the circumstances, but not for the purpose of expressing an opinion on the effectiveness of the Company’s internal control over financial reporting. Accordingly, we express no such opinion. An audit also includes examining, on a test basis, evidence supporting the amounts and disclosures in the financial statements, assessing the accounting principles used and significant estimates made by management, as well as evaluating the overall financial statement presentation. We believe that our audits provide a reasonable basis for our opinion.
In our opinion, such consolidated financial statements present fairly, in all material respects, the financial position of zulily, inc. and subsidiary as of December 29, 2013 and December 30, 2012, and the results of their operations and their cash flows for each of the three years in the period ended December 29, 2013 in conformity with accounting principles generally accepted in the United States of America.
/s/ Deloitte & Touche LLP
Seattle, Washington
February 28, 2014
56
ZULILY, INC.
CONSOLIDATED BALANCE SHEETS
(in thousands, except share and per share amounts)
December 29, 2013 | December 30, 2012 | ||||||
ASSETS | |||||||
CURRENT ASSETS: | |||||||
Cash and cash equivalents | $ | 290,089 | $ | 96,998 | |||
Short-term investments | 18,014 | 8,000 | |||||
Restricted cash | — | 681 | |||||
Accounts receivable | 5,176 | 3,043 | |||||
Inventories | 12,979 | 7,571 | |||||
Prepaid expenses and other current assets | 3,720 | 1,700 | |||||
Merchandise deposits | 472 | 946 | |||||
Total current assets | 330,450 | 118,939 | |||||
PROPERTY AND EQUIPMENT — Net | 24,613 | 11,191 | |||||
OTHER NON-CURRENT ASSETS | 1,024 | 607 | |||||
Total assets | $ | 356,087 | $ | 130,737 | |||
LIABILITIES, CONVERTIBLE REDEEMABLE PREFERRED STOCK AND STOCKHOLDERS’ EQUITY (DEFICIT) | |||||||
CURRENT LIABILITIES: | |||||||
Accounts payable | $ | 55,607 | $ | 34,198 | |||
Accrued expenses | 30,773 | 12,483 | |||||
Deferred revenue | 23,250 | 9,653 | |||||
Total current liabilities | 109,630 | 56,334 | |||||
NON-CURRENT LIABILITIES | 4,254 | 1,439 | |||||
Total liabilities | 113,884 | 57,773 | |||||
COMMITMENTS AND CONTINGENCIES (Note 6) | |||||||
CONVERTIBLE REDEEMABLE PREFERRED STOCK | |||||||
Convertible redeemable preferred stock, $0.0001 par value—zero and 26,569,403 shares authorized as of December 29, 2013 and December 30, 2012, respectively; zero and 26,569,392 shares issued and outstanding as of December 29, 2013 and December 30, 2012, respectively | — | 128,714 | |||||
STOCKHOLDERS’ EQUITY (DEFICIT) | |||||||
Convertible preferred stock, $0.0001 par value—zero shares and 38,536,600 shares authorized as of December 29, 2013 and December 30, 2012, respectively; zero and 33,928,492 shares issued and outstanding as of December 29, 2013 and December 30, 2012, respectively | — | 2 | |||||
Preferred stock, $0.0001 par value—2,000,000 and zero shares authorized as of December 29, 2013 and December 30, 2012, respectively; zero issued and outstanding as of December 29, 2013 and December 30, 2012 | — | — | |||||
Class A common stock, $0.0001 par value—500,000,000 and zero shares authorized as of December 29, 2013 and December 30, 2012, respectively; 13,225,000 and zero shares issued and outstanding as of December 29, 2013 and December 30, 2012, respectively | 1 | — | |||||
Class B common stock, $0.0001 par value—275,000,000 and 132,125,000 shares authorized as of December 29, 2013 and December 30, 2012, respectively; 110,159,235 and 54,561,740 shares issued and outstanding as of December 29, 2013 and December 30, 2012, respectively; including 82,682 and 10,285,807 shares subject to repurchase as of December 29, 2013 and December 30, 2012, respectively | 11 | 5 | |||||
Additional paid-in capital | 287,385 | — | |||||
Accumulated other comprehensive loss | (58 | ) | (6 | ) | |||
Accumulated deficit | (45,136 | ) | (55,751 | ) | |||
Total stockholders’ equity (deficit) | 242,203 | (55,750 | ) | ||||
Total liabilities, convertible redeemable preferred stock, and stockholders' equity (deficit) | $ | 356,087 | $ | 130,737 | |||
See notes to consolidated financial statements.
57
ZULILY, INC.
CONSOLIDATED STATEMENTS OF OPERATIONS
(in thousands, except share and per share amounts)
Year Ended | |||||||||||
December 29, 2013 | December 30, 2012 | January 1, 2012 | |||||||||
NET SALES | $ | 695,709 | $ | 331,240 | $ | 142,545 | |||||
COST OF SALES | 502,318 | 240,943 | 104,949 | ||||||||
GROSS PROFIT | 193,391 | 90,297 | 37,596 | ||||||||
OPERATING EXPENSES: | |||||||||||
Marketing | 59,667 | 37,780 | 20,228 | ||||||||
Selling, general, and administrative | 120,695 | 63,071 | 28,905 | ||||||||
TOTAL OPERATING EXPENSES | 180,362 | 100,851 | 49,133 | ||||||||
INCOME (LOSS) FROM OPERATIONS | 13,029 | (10,554 | ) | (11,537 | ) | ||||||
INTEREST INCOME (EXPENSE)—Net | 136 | 43 | 20 | ||||||||
OTHER INCOME (EXPENSE)—Net | 99 | 176 | 203 | ||||||||
NET INCOME (LOSS) BEFORE PROVISION FOR INCOME TAXES | 13,264 | (10,335 | ) | (11,314 | ) | ||||||
PROVISION FOR INCOME TAXES | (356 | ) | — | — | |||||||
NET INCOME (LOSS) | $ | 12,908 | $ | (10,335 | ) | $ | (11,314 | ) | |||
Net income (loss) attributable to Class A and Class B common stockholders | $ | — | $ | (46,822 | ) | $ | (13,233 | ) | |||
Net income (loss) per share attributable to Class A and Class B common stockholders: | |||||||||||
Basic | $ | — | (1.23 | ) | (0.55 | ) | |||||
Diluted | $ | — | (1.23 | ) | (0.55 | ) | |||||
Weighted average shares outstanding used to compute net income (loss) per share attributable to Class A and Class B common stockholders: | |||||||||||
Basic | 59,450,186 | 37,976,724 | 24,102,780 | ||||||||
Diluted | 59,450,186 | 37,976,724 | 24,102,780 | ||||||||
See notes to consolidated financial statements.
58
ZULILY, INC.
CONSOLIDATED STATEMENTS OF COMPREHENSIVE OPERATIONS
(in thousands)
Year Ended | |||||||||||
December 29, 2013 | December 30, 2012 | January 1, 2012 | |||||||||
NET INCOME (LOSS) | $ | 12,908 | $ | (10,335 | ) | $ | (11,314 | ) | |||
OTHER COMPREHENSIVE INCOME (LOSS): | |||||||||||
Unrealized holding (losses) gains on available-for-sale securities | (3 | ) | 5 | — | |||||||
Foreign currency translation adjustment | (49 | ) | (11 | ) | — | ||||||
OTHER COMPREHENSIVE LOSS, NET | (52 | ) | (6 | ) | — | ||||||
TOTAL COMPREHENSIVE INCOME (LOSS) | $ | 12,856 | $ | (10,341 | ) | $ | (11,314 | ) | |||
See notes to consolidated financial statements.
59
ZULILY, INC.
CONSOLIDATED STATEMENTS OF CONVERTIBLE REDEEMABLE PREFERRED STOCK AND STOCKHOLDERS’ EQUITY (DEFICIT)
(in thousands, except share amounts)
Convertible Redeemable Preferred Stock | Convertible Preferred Stock | Class A and Class B Common Stock | Additional Paid-In Capital | Accumulated Other Comprehensive Loss | Accumulated Deficit | Total Stockholders’ Equity (Deficit) | |||||||||||||||||||||||||||||||
Shares | Amount | Shares | Amount | Shares | Amount | ||||||||||||||||||||||||||||||||
BALANCES- December 31, 2010 | 49,767,499 | $ | 11,709 | — | $ | — | 52,812,493 | $ | 4 | 1,969 | $ | — | $ | (7,087 | ) | $ | (5,114 | ) | |||||||||||||||||||
Net loss | — | — | — | — | — | — | — | — | (11,314 | ) | (11,314 | ) | |||||||||||||||||||||||||
Issuance of convertible redeemable preferred stock—net of issuance costs of $109 | 5,094,566 | 31,891 | — | — | — | — | — | — | — | — | |||||||||||||||||||||||||||
Accretion of convertible redeemable preferred stock | — | 1,919 | — | — | — | — | (1,919 | ) | — | — | (1,919 | ) | |||||||||||||||||||||||||
Issuance of common stock | — | — | — | — | 3,392,945 | — | 11,031 | — | — | 11,031 | |||||||||||||||||||||||||||
Issuance of common stock for services | — | — | — | — | 80,127 | — | 246 | — | — | 246 | |||||||||||||||||||||||||||
Repurchase and retirement of common stock | — | — | — | — | (1,953,318 | ) | — | (11,000 | ) | — | — | (11,000 | ) | ||||||||||||||||||||||||
Stock-based compensation | — | — | — | — | — | — | 1,902 | — | — | 1,902 | |||||||||||||||||||||||||||
BALANCES- January 1, 2012 | 54,862,065 | 45,519 | — | — | 54,332,247 | 4 | 2,229 | — | (18,401 | ) | (16,168 | ) | |||||||||||||||||||||||||
Net loss | — | — | — | — | — | — | — | — | (10,335 | ) | (10,335 | ) | |||||||||||||||||||||||||
Other comprehensive loss, net | — | — | — | — | — | — | — | (6 | ) | — | (6 | ) | |||||||||||||||||||||||||
Issuance of convertible redeemable preferred stock—net of issuance costs of $85 | 10,243,920 | 84,916 | — | — | — | — | — | — | — | — | |||||||||||||||||||||||||||
Transfer of convertible redeemable preferred stock to convertible preferred stock | (38,536,593 | ) | (6,096 | ) | 38,536,593 | 2 | — | — | 6,094 | — | — | 6,096 | |||||||||||||||||||||||||
Repurchase of convertible preferred stock | — | — | (4,608,101 | ) | — | — | — | (6,557 | ) | — | (25,943 | ) | (32,500 | ) | |||||||||||||||||||||||
Accretion of convertible redeemable preferred stock | — | 4,375 | — | — | — | — | (3,303 | ) | — | (1,072 | ) | (4,375 | ) | ||||||||||||||||||||||||
Issuance of common stock | — | — | — | — | 229,493 | 1 | 91 | — | — | 92 | |||||||||||||||||||||||||||
Stock-based compensation | — | — | — | — | — | — | 1,446 | — | — | 1,446 | |||||||||||||||||||||||||||
BALANCES- December 30, 2012 | 26,569,392 | 128,714 | 33,928,492 | 2 | 54,561,740 | 5 | — | (6 | ) | (55,751 | ) | (55,750 | ) | ||||||||||||||||||||||||
Net income | — | — | — | — | — | — | — | — | 12,908 | 12,908 | |||||||||||||||||||||||||||
Other comprehensive loss, net | — | — | — | — | — | — | — | (52 | ) | — | (52 | ) | |||||||||||||||||||||||||
Accretion of convertible redeemable preferred stock | — | 8,974 | — | — | — | — | (6,681 | ) | — | (2,293 | ) | (8,974 | ) | ||||||||||||||||||||||||
Conversion of convertible preferred stock to common stock | (26,569,392 | ) | (137,688 | ) | (33,928,492 | ) | (2 | ) | 60,621,233 | 6 | 137,684 | — | — | 137,688 | |||||||||||||||||||||||
Issuance of Class B common stock | — | — | — | — | 867,137 | — | 1,039 | — | — | 1,039 | |||||||||||||||||||||||||||
Issuance of Class A common stock—net of issuance costs of $3,318 | — | — | — | — | 7,334,125 | 1 | 147,544 | — | — | 147,545 | |||||||||||||||||||||||||||
Stock-based compensation | — | — | — | — | — | — | 7,801 | — | — | 7,801 | |||||||||||||||||||||||||||
BALANCES- December 29, 2013 | — | $ | — | — | $ | — | 123,384,235 | $ | 12 | $ | 287,387 | $ | (58 | ) | $ | (45,136 | ) | $ | 242,205 | ||||||||||||||||||
See notes to consolidated financial statements.
60
ZULILY, INC.
CONSOLIDATED STATEMENTS OF CASH FLOWS
(in thousands)
Year Ended | |||||||||||
December 29, 2013 | December 30, 2012 | January 1, 2012 | |||||||||
CASH FLOWS FROM OPERATING ACTIVITIES: | |||||||||||
Net income (loss) | $ | 12,908 | $ | (10,335 | ) | $ | (11,314 | ) | |||
Adjustments to reconcile net income (loss) to net cash provided by operating activities: | |||||||||||
Depreciation and amortization | 6,240 | 3,369 | 587 | ||||||||
Stock-based compensation | 7,777 | 1,265 | 2,079 | ||||||||
Loss on disposal of assets | 49 | 74 | 50 | ||||||||
Changes in operating assets and liabilities: | |||||||||||
Accounts receivable | (2,131 | ) | (2,422 | ) | (409 | ) | |||||
Inventories | (5,399 | ) | (2,968 | ) | (4,027 | ) | |||||
Prepaid expenses and other assets | (2,302 | ) | (910 | ) | (915 | ) | |||||
Merchandise deposits | 475 | (355 | ) | (567 | ) | ||||||
Accounts payable | 20,820 | 14,150 | 16,300 | ||||||||
Accrued expenses and other liabilities | 21,092 | 8,329 | 4,602 | ||||||||
Deferred revenue | 13,591 | 6,086 | 2,478 | ||||||||
Net cash provided by operating activities | 73,120 | 16,283 | 8,864 | ||||||||
CASH FLOWS FROM INVESTING ACTIVITIES: | |||||||||||
Capital expenditures | (19,606 | ) | (7,858 | ) | (5,115 | ) | |||||
Purchases of short-term and other investments | (36,012 | ) | (10,200 | ) | (14,000 | ) | |||||
Proceeds from sale of available-for-sale securities | — | 6,000 | — | ||||||||
Proceeds from maturity of available-for-sale securities | 26,000 | 10,000 | — | ||||||||
Purchases of restricted cash | (6,000 | ) | (9,281 | ) | (8,600 | ) | |||||
Proceeds from maturity of restricted cash | 6,682 | 11,200 | 6,100 | ||||||||
Net cash used in investing activities | (28,936 | ) | (139 | ) | (21,615 | ) | |||||
CASH FLOWS FROM FINANCING ACTIVITIES: | |||||||||||
Proceeds from issuance of convertible redeemable preferred stock | — | 85,000 | 32,000 | ||||||||
Convertible redeemable preferred stock issuance costs | — | (85 | ) | (109 | ) | ||||||
Proceeds from initial public offering, net of underwriter fees | 150,863 | — | — | ||||||||
Payments for deferred offering costs | (2,933 | ) | — | — | |||||||
Proceeds from issuance of common stock | 1,029 | 78 | 11,031 | ||||||||
Repurchase and retirement of common stock | — | — | (11,000 | ) | |||||||
Proceeds from early exercise of stock options | — | — | 33 | ||||||||
Repurchase and retirement of preferred stock | — | (32,500 | ) | — | |||||||
Debt issuance costs | (28 | ) | — | — | |||||||
Net cash provided by financing activities | 148,931 | 52,493 | 31,955 | ||||||||
Effect of exchange rate changes on cash and cash equivalents | (24 | ) | — | — | |||||||
NET INCREASE IN CASH AND CASH EQUIVALENTS | 193,091 | 68,637 | 19,204 | ||||||||
CASH AND CASH EQUIVALENTS—Beginning of period | 96,998 | 28,361 | 9,157 | ||||||||
CASH AND CASH EQUIVALENTS—End of period | $ | 290,089 | $ | 96,998 | $ | 28,361 | |||||
SUPPLEMENTAL DISCLOSURE OF NONCASH INVESTING ACTIVITIES: | |||||||||||
Payable for capital purchases | $ | 84 | $ | 205 | $ | 1,414 | |||||
Investment in common stock warrant | — | 47 | — | ||||||||
Stock-based compensation capitalized | 24 | 181 | 68 | ||||||||
SUPPLEMENTAL DISCLOSURE OF NONCASH FINANCING ACTIVITIES: | |||||||||||
Vesting of early exercised shares | 10 | 13 | — | ||||||||
Accretion of redeemable convertible preferred stock | 8,974 | 4,375 | 1,919 | ||||||||
Unpaid offering costs in additional paid-in capital | 385 | — | — | ||||||||
Deferred debt issuance costs | 102 | — | — | ||||||||
See notes to consolidated financial statements.
61
ZULILY, INC.
NOTES TO CONSOLIDATED FINANCIAL STATEMENTS
NOTE 1. THE COMPANY AND BASIS OF PRESENTATION
The Company—zulily, inc. (the “Company”) is an online retailer offering customers a fun and entertaining shopping experience with a fresh selection of new product styles launched each day. Through the Company’s desktop and mobile sites and mobile applications, the Company helps its customers discover new and unique products at great values that they would likely not find elsewhere. The Company, a Delaware corporation formed in 2009, primarily conducts its buying, marketing and administrative functions in Seattle, Washington. The Company also operates a buying and studio office in Columbus, Ohio with fulfillment centers in McCarran, Nevada and Lockbourne, Ohio.
Zulily UK Ltd. was incorporated in the United Kingdom in October 2011 and is a wholly owned subsidiary of zulily, inc. The principal corporate offices are located in London, England.
Principles of Consolidation—The accompanying consolidated financial statements include the accounts of the Company and its wholly owned subsidiary, Zulily UK Ltd. All intercompany transactions and balances are eliminated in consolidation.
Fiscal Year—In 2011, the Company adopted a retail calendar whereby the fiscal year ends on the Sunday closest to December 31. Each fiscal year consists of four 13-week quarters, with one extra week added in the fourth quarter every five to six years.
NOTE 2. SUMMARY OF SIGNIFICANT ACCOUNTING POLICIES
Accounting Estimates—The preparation of consolidated financial statements in conformity with accounting principles generally accepted in the United States of America (“GAAP”) requires management to make estimates and assumptions that affect the reported amounts of assets and liabilities, the disclosure of contingent assets and liabilities at the date of the consolidated financial statements and the reported amounts of revenues and expenses during the reporting period. Some of the more significant estimates include assumptions related to: the valuation of common shares and determination of the grant date fair value of stock-based awards; the recoverability of long-lived assets; and the determination of deferred income taxes, including related valuation allowances. Actual results could differ materially from those estimates.
Foreign Currency Translation—The functional currency of the Company’s foreign subsidiary is the British Pound Sterling. Assets and liabilities of the subsidiary are translated at the exchange rate in effect at each period-end. Income statement amounts are translated at the average rate of exchange prevailing during the period. Translation adjustments arising from the use of differing exchange rates from period to period are included in accumulated other comprehensive loss within stockholders’ equity (deficit).
Cash and Cash Equivalents—Cash and cash equivalents include cash and highly-liquid investments with maturities of three months or less from the date of purchase, which are carried at amortized cost.
Short-Term Investments—The Company classifies highly-liquid investments with maturities greater than three months but less than one year as short-term investments. Short-term investments are comprised of available-for-sale securities. Available-for-sale securities are recorded at fair value, and unrealized holding gains and losses are recorded as a component of accumulated other comprehensive loss in stockholders' equity (deficit), while realized gains and losses, and other-than-temporary impairments are reported as a component of net income. For the periods presented, realized and unrealized gains and losses on investments were not material. An impairment charge is recorded in the consolidated statements of operations for declines in fair value below the cost of an individual investment that are deemed to be other-than-temporary. The Company assesses whether a decline in value is temporary based on the length of time that the fair market value has been below cost, the severity of the decline, as well as the intent and ability to hold, or plans to sell, the investment. We did not identify any of our short-term investments as other-than-temporarily impaired for the fiscal years ended December 29, 2013 and December 30, 2012.
Restricted Cash—In November 2011, the Company entered into a lease agreement for warehouse space in Ohio that required a security deposit in the form of an irrevocable standby letter of credit ("LOC") totaling $0.6 million. The Company was required to maintain with the issuing bank a compensating balance, restricted as to use,
62
of not less than the sum of the available amount of the LOC. The LOC was not drawn against and was terminated in November 2013.
Accounts Receivable—The majority of sales are conducted with credit cards and accounts receivable are composed primarily of amounts due from financial institutions related to those credit card sales. The Company does not maintain an allowance for doubtful accounts as payment is typically received within a few business days after the sale.
Inventories—The Company’s inventories, which consist primarily of apparel, infant gear, and toys are stated at the lower of cost or market and valued on an average cost basis. Inventory costs primarily consist of product costs from suppliers, as well as inbound shipping and handling fees. The majority of the Company’s inventories are not purchased until the Company receives a customer order and is subsequently relieved from inventories when it is delivered to the customer.
Merchandise Deposits—Merchandise deposits represent advance payments to vendors for products for which the Company has placed a purchase order but does not have title to the inventory.
Property and Equipment—Property and equipment are stated at cost, less accumulated depreciation. Maintenance and repairs are expensed as incurred. Depreciation is calculated on a straight-line basis over the estimated useful lives of the following asset categories:
Asset Category | Depreciation Period |
Computer equipment and capitalized software | 1 to 3 years |
Leasehold improvements | Lesser of 5 years or lease term |
Furniture and other equipment | 3 to 5 years |
Capitalized Software—The Company capitalizes costs to develop its websites and internal-use software and amortizes such costs on a straight-line basis over the estimated useful life of the software once it is available for use. Capitalization of such costs begins when the preliminary project stage is completed, management with the relevant authority authorizes and commits to the funding of the software project, and it is probable that the project will be completed and the software will be used to perform the function intended.
Capitalized software costs, net of accumulated amortization, totaled $2.7 million and $1.9 million as of December 29, 2013 and December 30, 2012, respectively, and are included in property and equipment—net in the accompanying consolidated balance sheets. Amortization expense related to capitalized software costs was $1.0 million, $0.6 million, and $0.2 million for the years ended December 29, 2013, December 30, 2012, and January 1, 2012, respectively, and is included in selling, general, and administrative expenses in the accompanying consolidated statements of operations.
Impairment of Long-Lived Assets—The Company reviews the carrying value of its long-lived assets, including property and equipment and definite-lived intangible assets, whenever events or changes in circumstances indicate that the carrying value may not be recoverable. To the extent the estimated future cash inflows attributable to the assets, less estimated future cash outflows, are less than the carrying amount, an impairment loss would be recognized. No impairment losses were recorded in the periods presented.
Other Investments—On November 6, 2012, the Company acquired a non-controlling stake through a cash purchase of convertible preferred shares in a privately held company. In conjunction with the purchase of the convertible preferred shares, the Company also received a fully-earned, nonforfeitable common stock warrant in the privately held company. These investments are accounted for using the cost method of accounting as the Company does not have the ability to exercise significant influence. These investments totaled $0.2 million as of December 29, 2013 and December 30, 2012 and are included in noncurrent assets in the accompanying consolidated balance sheets. There was no impairment recognized on these investments in the periods presented.
Fair Value of Financial Instruments—The carrying amounts for the Company’s cash, cash equivalents, short-term investments, restricted cash, accounts receivable, accounts payable and accrued liabilities approximate fair value due to their short maturities.
Income Taxes—The Company uses the asset and liability method of accounting for income taxes. Under this method, deferred tax assets and liabilities are recognized by applying the statutory tax rates in effect in the
63
years in which the differences between the financial reporting and tax filing bases of existing assets and liabilities are expected to reverse. Valuation allowances are established when necessary to reduce deferred tax assets to the amounts expected to be realized.
The Company utilizes a two-step approach to recognizing and measuring uncertain income tax positions (tax contingencies). The first step is to evaluate the tax position for recognition by determining if the weight of available evidence indicates it is more likely than not that the position will be sustained on audit, including resolution of related appeals or litigation processes. The second step is to measure the tax benefit as the largest amount which is more than 50% likely of being realized upon ultimate settlement. The Company considers many factors when evaluating and estimating its tax positions and tax benefits, which may require periodic adjustments and which may not accurately forecast actual outcomes.
The Company’s policy is to recognize interest and/or penalties related to all tax positions in income tax expense. To the extent that accrued interest and penalties do not ultimately become payable, amounts accrued will be reduced and reflected as a reduction of the overall income tax provision in the period that such determination is made. No interest and penalties were accrued as of December 29, 2013 and December 30, 2012.
Reverse Stock Split—On October 17, 2013, the Company's board of directors and stockholders approved a one-for-four reverse stock split of the Company’s common stock and preferred stock and such stock split was effected on such date. All share numbers, share prices and exercise prices have been adjusted to reflect the stock split on a retroactive basis within these consolidated financial statements.
Par Value—On October 17, 2013 and in connection with the reverse stock split, the Company's board of directors approved an adjusted par value of $0.0001 for each class of the Company's common and preferred stock. Par value has been adjusted and disclosed on a retroactive basis within these consolidated financial statements.
Certain Risks and Concentrations—The Company maintains the majority of its cash and cash equivalents in accounts with major financial institutions within the United States, generally in the form of demand and money market accounts. Deposits in these institutions may exceed federally insured limits. The Company has not experienced any losses on its deposits of cash and cash equivalents.
The Company is subject to certain risks and concentrations, including dependence on third-party technology providers and hosting services, exposure to risks associated with online commerce security, consumer credit risk, and credit card fraud, as well as the interpretation of state and local laws and regulations in regards to the collection and remittance of sales and use taxes and occupancy taxes. The Company also depends upon third-party service providers for processing customer orders.
Revenue Recognition—The Company generates net sales from sales of children’s apparel, women’s apparel and other categories, such as toys, infant gear, kitchen accessories and home décor, and from shipping and handling charges to the Company’s customers. The Company also generates net sales from the sale of services events, which are primarily electronic vouchers or access codes for the Company’s customers to redeem directly with the vendor.
The Company recognizes revenue when the following criteria are met: (1) persuasive evidence of an arrangement exists; (2) delivery has occurred; (3) the selling price is fixed or determinable; and (4) collectability is reasonably assured. For product sales, these criteria are met when the customer orders an item through the Company’s sites via the electronic shopping cart, funds are collected from the customer and the item is fulfilled in one of the Company or third-party fulfillment centers, shipped and delivered to the customer. Revenue from product sales is generally recorded at the gross amount as the Company is the primary obligor in the arrangement with the customer, has latitude in establishing the products available for sale and the price to the customer, is responsible for ensuring the delivery of the product to the customer and assume inventory and credit risk. For services sales, these criteria are met when the customer orders an item through the Company’s sites via the electronic shopping cart, funds are collected from the customer and the voucher or access code is downloaded from the Company’s sites. Revenue from services sales is generally recorded at the net amount, or the commission earned on the voucher, as the Company is acting as an agent on behalf of the vendor. The vendor is ultimately responsible for fulfilling the customer order directly with the customer and assumes the inventory risk. To date, services revenue has not been material. The Company defers revenue when cash is collected from the customer prior to the satisfaction of the revenue recognition criteria.
64
To encourage customers to purchase the Company’s products and services, the Company periodically provides incentive offers. Generally, these promotions include dollar-off and percentage-off discounts to be applied against current purchases. The Company also grants merchandise credits to participants in the Company’s referral program when the customer referral results in a sale. Merchandise credits issued through the referral program typically expire in 18 months. The Company records these discounts and merchandise credits as reductions of the sales price at the date the promotion is redeemed. Additionally, the Company provides customers merchandise credits to be applied against future purchases in instances in which the customer is unsatisfied with an order. In these instances, the Company has established a sales return reserve based on the Company’s historical experience. To date, these reserves have not been significant.
Gift cards and merchandise credits issued in lieu of a cash refund are recorded as a liability upon purchase of the gift card or issuance of the merchandise credit and do not expire. The Company reduces the liability for gift cards and merchandise credits when redeemed by a customer. If a gift card or merchandise credit is not redeemed, the Company recognizes revenue when the likelihood of its redemption becomes remote. The Company has not recognized revenue related to unredeemed gift cards and merchandise credits.
The Company has procedures in place to detect and prevent credit card fraud as the Company has exposure to losses from fraudulent charges. Due to the insignificant losses related to chargebacks, the Company records such losses as incurred.
Taxes collected from customers are accounted for on a net basis and are excluded from net sales.
Cost of Sales—Cost of sales consists of the purchase price of merchandise sold to customers, inbound and outbound shipping and handling costs, shipping supplies and fulfillment costs. Fulfillment costs represent those costs incurred in operating and staffing the fulfillment centers, including costs attributed to receiving, inspecting, picking, packaging and preparing customer orders for shipment. Cost of sales also includes direct and indirect labor for fulfillment center oversight, including payroll and related benefit costs and stock-based compensation expense.
Marketing—Marketing expenses are expensed as incurred and consist primarily of targeted online marketing costs, such as display advertising, key word search campaigns, search engine optimization and social media and offline marketing costs such as television, radio and print advertising. Marketing expenses also include payroll and related benefit costs and stock-based compensation expense for employees involved in marketing activities. Marketing expenses are primarily related to growing and retaining the customer base.
Selling, General and Administrative Expenses—Selling, general and administrative expenses (“SG&A”) consist primarily of payroll and related benefit costs and stock-based compensation expense for employees involved in general corporate functions including merchandising, studio, technology and customer service, as well as costs associated with the use by these functions of facilities and equipment, including depreciation, rent and occupancy. Also included in SG&A is rent and depreciation related to fulfillment centers.
The Company generally does not extend credit to customers. The majority of sales are through credit cards, and accounts receivable are composed primarily of amounts due from financial institutions related to credit card sales.
Stock-Based Compensation—The Company measures compensation cost for all stock options and restricted stock awards granted at their grant date estimated fair value. Stock-based compensation expense, net of estimated forfeitures, is recognized on a straight-line basis over the vesting period for each award. The fair value of stock option awards is estimated on the grant date using the Black-Scholes option valuation model. The fair value of each restricted stock award is based on the estimated fair market value of the Company’s common stock on the date of the award. See Note 7: "Stockholders' Equity (Deficit)" for additional details.
Employee Benefit Plan—The Company sponsors a qualified 401(k) defined contribution plan covering eligible employees. Participants may contribute a percentage of their pretax earnings annually, subject to limitations imposed by the Internal Revenue Service. The Company has the ability to make discretionary contributions to the 401(k) plan but has not done so to date.
Recent Accounting Pronouncements Adopted—In May 2011, the Financial Accounting Standards Board (“FASB”) issued guidance to amend the fair value measurement and disclosure requirements. The new authoritative guidance requires entities to provide information about valuation techniques and unobservable inputs used in Level 3 fair value measurements and provide a narrative description of the sensitivity of Level 3 measurements to
65
changes in unobservable inputs. This amendment became effective for the Company beginning on January 2, 2012. The adoption of this new guidance did not have a material impact on the Company’s financial statements.
In 2011, the FASB issued two Accounting Standards Updates (“ASU”), ASU 2011-05 and ASU 2011-12, which amend the guidance for the presentation of comprehensive income. The amended guidance requires an entity to present components of net income and other comprehensive income in one continuous statement, referred to as the statement of comprehensive income, or in two separate, but consecutive statements. The option to report other comprehensive income and its components in the statement of stockholders’ equity will be eliminated. Although the new guidance changes the presentation of comprehensive income, there are no changes to the components that are recognized in net income or other comprehensive income under existing guidance. The Company adopted these ASUs at the beginning of fiscal year 2012. Adoption of these ASUs changed the Company’s presentation of comprehensive income but did not impact the Company’s net income, financial position or cash flows.
NOTE 3. FAIR VALUE MEASUREMENTS
Fair value is defined as the price that would be received to sell an asset or paid to transfer a liability in an orderly transaction between market participants at the measurement date. To increase the comparability of fair value measures, the following hierarchy prioritizes the inputs to valuation methodologies used to measure fair value:
Level 1—Quoted prices for identical assets and liabilities in active markets. The Company classifies cash equivalents as Level 1 in the fair value hierarchy. Cash equivalents are comprised of highly-liquid investments, including money market funds with original maturities of less than six months. The fair value measurement of these assets is based on quoted market prices in active markets and, therefore, these assets are recorded at fair value on a recurring basis.
Level 2—Assets and liabilities valued based on observable market data for similar instruments, such as quoted prices for similar assets or liabilities or other inputs that are observable or can be corroborated by observable market data. The Company classifies restricted cash and short-term investments as Level 2 in the fair value hierarchy. Restricted cash is comprised of certificates of deposit funds with original maturities of less than three months. Short-term investments consist of commercial paper. The fair value measurement of these assets is based on observable market-based inputs or inputs that are derived principally from or corroborated by observable market data by correlation or other means.
Level 3—Unobservable inputs reflecting the Company’s assumptions, consistent with reasonably available assumptions made by other market participants. These valuations require significant judgment. The Company does not have assets classified as Level 3 in the fair value hierarchy.
The following tables summarize the Company's assets that are measured at fair value on a recurring basis, by level, within the fair value hierarchy as of December 29, 2013 and December 30, 2012:
December 29, 2013 | |||||||||||||||
Total | Level 1 | Level 2 | Level 3 | ||||||||||||
(in thousands) | |||||||||||||||
Cash equivalents: | |||||||||||||||
Money market funds | $ | 18,019 | $ | 18,019 | $ | — | $ | — | |||||||
Short-term investments: | |||||||||||||||
Commercial paper | 18,014 | — | 18,014 | — | |||||||||||
Total | $ | 36,033 | $ | 18,019 | $ | 18,014 | $ | — | |||||||
66
December 30, 2012 | |||||||||||||||
Total | Level 1 | Level 2 | Level 3 | ||||||||||||
(in thousands) | |||||||||||||||
Cash equivalents: | |||||||||||||||
Money market funds | $ | 18,018 | $ | 18,018 | $ | — | $ | — | |||||||
Short-term investments: | |||||||||||||||
Commercial paper | 8,000 | — | 8,000 | — | |||||||||||
Restricted cash: | |||||||||||||||
Certificate of deposit | 600 | — | 600 | — | |||||||||||
Demand deposit | 81 | — | 81 | — | |||||||||||
$ | 26,699 | $ | 18,018 | $ | 8,681 | $ | — | ||||||||
NOTE 4. ACCRUED EXPENSES
Accrued expenses consist of the following:
December 29, 2013 | December 30, 2012 | ||||||
(in thousands) | |||||||
Accrued payroll | $ | 5,327 | $ | 2,531 | |||
Accrued marketing | 3,595 | 5,223 | |||||
Accrued shipping | 15,186 | 2,075 | |||||
Other accrued expenses | 6,665 | 2,654 | |||||
Total accrued expenses | $ | 30,773 | $ | 12,483 | |||
NOTE 5. PROPERTY AND EQUIPMENT
The balance of property and equipment—net is as follows:
December 29, 2013 | December 30, 2012 | ||||||
(in thousands) | |||||||
Computer equipment and capitalized software | $ | 15,963 | $ | 10,027 | |||
Leasehold improvements | 1,272 | 623 | |||||
Furniture and other equipment | 12,224 | 4,123 | |||||
Work in progress | 5,228 | 327 | |||||
Less: accumulated depreciation and amortization | (10,074 | ) | (3,909 | ) | |||
Total property and equipment, net | $ | 24,613 | $ | 11,191 | |||
Depreciation and amortization expense of property and equipment totaled $6.2 million, $3.4 million, and $0.6 million during the fiscal years ended December 29, 2013, December 30, 2012, and January 1, 2012, respectively.
NOTE 6. COMMITMENTS AND CONTINGENCIES
Leases—The Company leases office and warehouse space and equipment used in connection with its operations under various operating leases, some of which provide for rental payments on a graduated basis, rent holidays and other incentives. At the inception of the lease, the Company evaluates each agreement to determine whether the lease will be accounted for as an operating or capital lease. The Company records rent expense on a straight-line basis over the lease period. Any lease incentives are recognized as reductions of rental expense on a straight-line basis over the term of the lease.
Rental expense was $5.9 million, $4.6 million and $1.4 million for the fiscal years ended December 29, 2013, December 30, 2012 and January 1, 2012, respectively.
67
Future minimum payments under noncancelable operating leases as of December 29, 2013 are as follows:
Fiscal Years Ending | Amount | ||
(in thousands) | |||
2014 | $ | 8,059 | |
2015 | 8,158 | ||
2016 | 9,468 | ||
2017 | 8,377 | ||
2018 | 7,701 | ||
Thereafter | 43,100 | ||
Total | $ | 84,863 | |
Sales Taxes—The Company believes that the likelihood of incurring a liability as a result of sales tax nexus being asserted by certain states where it doesn’t currently collect sales tax reaches the threshold for reasonably possible; however, the Company is unable to estimate a potential outcome.
Legal Proceedings—In the ordinary course of business, the Company may be involved in various legal proceedings, lawsuits, disputes, or claims, related to alleged infringement of third party patents and other intellectual property rights, commercial, employment, wage and hour, and other claims. We have been, and may in the future, be put on notice and/or sued by third parties for alleged infringement of their proprietary rights, including patent, trademark, and copyright infringement. The outcome of any such claim or litigation is inherently uncertain. Any claims against us, whether meritorious or not, could be time-consuming, result in costly litigation, damage our reputation, require significant amounts of management time and divert significant resources. Although the Company cannot predict the outcome of any such claims or litigation, it does not believe there are currently any such claims or litigation that, if resolved unfavorably, would have a material impact on the Company's financial condition, results of operations or cash flows.
NOTE 7. STOCKHOLDERS’ EQUITY (DEFICIT)
Initial Public Offering
In November 2013, the Company completed its IPO in which it issued and sold 7,334,125 shares of Class A common stock at a public offering price of $22.00 per share and the selling stockholders sold 5,890,875 shares of Class A common stock. The Company did not receive any proceeds from the sale of shares by the selling stockholders. The total net proceeds from the offering to the Company were $147.5 million after deducting the underwriting discounts and offering expenses totaling $3.3 million.
Convertible Preferred Stock and Convertible Redeemable Preferred Stock
Upon closing of the Company's IPO, all shares of the Company’s then-outstanding convertible preferred stock and convertible redeemable preferred stock automatically converted into an aggregate of 60,621,233 shares of Class B common stock.
The following table summarizes the convertible preferred stock and convertible redeemable preferred stock outstanding prior to the conversion into Class B common stock, and the rights and preferences of the respective series as of December 30, 2012:
68
Shares | ||||||||||||||||
Dividend | Conversion | |||||||||||||||
Shares | Issued and | Liquidation | Per Share | Ratio | ||||||||||||
Authorized | Outstanding | Preference | Per Annum | Per Share | ||||||||||||
(in thousands, except share and per share amounts) | ||||||||||||||||
Series Seed | 9,660,950 | 5,540,769 | $ | 344,000 | $ | 0.005 | 1.00 | |||||||||
Series A | 28,875,650 | 28,387,723 | 4,139,000 | 0.012 | 1.00 | |||||||||||
Series B | 11,230,908 | 11,230,906 | 6,000,000 | 0.043 | 1.00 | |||||||||||
Series C | 5,094,569 | 5,094,566 | 32,000,000 | 0.502 | 1.00 | |||||||||||
Series D | 10,243,926 | 10,243,920 | 85,000,000 | 0.664 | 1.01 | |||||||||||
Total | 65,106,003 | 60,497,884 | $ | 127,483,000 | ||||||||||||
Redemption—Prior to the conversion of convertible preferred stock and convertible redeemable preferred stock into Class B common stock at the closing of the Company's IPO in November 2013, each share of Series B, Series C, and Series D preferred stock had redemption rights equal to the sum of the original issue price, plus 8%, per share per annum, compounded annually. The redemption feature required a 70% vote of the aggregate preferred stock with redemption rights. No redemption notice was received through the date of conversion to Class B common stock. Until July 12, 2012 the Series Seed and Series A preferred stock had the same redemption rights as the Series B, Series C, and Series D preferred stock, however, the Company amended its Certificate of Incorporation on July 13, 2012 to remove the redemption rights on the Series Seed and Series A preferred stock. Subsequent to this, these shares were no longer redeemable at the option of the holders. Accordingly, the Series Seed and Series A preferred stock were reclassified from convertible redeemable preferred stock to stockholders’ equity (deficit) within the consolidated balance sheets and the consolidated statements of convertible redeemable preferred stock and stockholders’ equity (deficit).
The following table presents the accretion of the preferred stock to its redemption value recorded within the consolidated statements of convertible redeemable preferred stock and stockholders’ equity (deficit) during the periods presented:
Year Ended | |||||||||||
December 29, 2013 | December 30, 2012 | January 1, 2012 | |||||||||
(in thousands) | |||||||||||
Series Seed | $ | — | $ | 31 | $ | 58 | |||||
Series A | — | 150 | 295 | ||||||||
Series B | 505 | 537 | 497 | ||||||||
Series C | 2,479 | 2,630 | 1,069 | ||||||||
Series D | 5,991 | 1,027 | — | ||||||||
Total preferred stock accretion | $ | 8,975 | $ | 4,375 | $ | 1,919 | |||||
Liquidation Preferences—Prior to conversion into Class B common stock, and upon the liquidation, dissolution, or winding up of the Company, whether voluntary or involuntary, holders of Series Seed, Series A, Series B, Series C, and Series D preferred stock had liquidation preferences for all assets of the Company available for distribution to its stockholders ratably, in proportion to the number of shares held by them, plus all declared but unpaid dividends.
Voting Rights—Prior to conversion into Class B common stock, each share of preferred stock was entitled to the number of votes equal to the number of shares of common stock into which such shares of preferred stock could be converted. Voting rights were equal to the holders of common stock.
69
Repurchase of Convertible Preferred Stock
On November 14, 2012, in conjunction with the Series D preferred stock financing, the Company repurchased an aggregate 4,608,101 shares of Series Seed preferred stock and Series A preferred stock from an existing investor, for a total purchase price of $32.5 million. As a result, the amount paid in excess of the original proceeds of $32.1 million is considered a deemed dividend and is reflected as distributed earnings attributable to participating securities in the calculation of net loss per common share.
Preferred Stock
The Company has 2,000,000 shares of undesignated preferred stock authorized for future issuance. Shares of preferred stock may be issued from time to time in one or more series with rights, preferences and privileges established by the Company's board of directors.
Common Stock
Since October 17, 2013, the Company has had two classes of authorized common stock outstanding; Class A common stock and Class B common stock at a maximum aggregate number of shares authorized of 500,000,000 and 275,000,000, respectively. As of December 29, 2013, the Company had outstanding 13,225,000 shares of Class A common stock and 110,159,235 shares of Class B common stock. The rights of the holders of Class A common stock and Class B common stock are identical, except with respect to voting and conversion. The holders of Class A common stock are entitled to one vote per share, and the holders of Class B common stock are entitled to ten votes per share, on all matters that are subject to stockholder vote. Each share of Class B common stock may be converted into one share of Class A common stock at the option of its holder and will be automatically converted into one share of Class A common stock upon transfer, with certain limited exceptions.
Restricted Common Stock
On October 26, 2009, the Company signed a Restricted Stock Purchase Agreement with its founders wherein each founder purchased shares of Class B common stock at a price of $0.0004 per share and granted the Company an option to acquire shares of Class B common stock owned by the respective founders at a repurchase right equal to the lesser of the original price paid for each share or the fair market value on the date of repurchase of said shares. Common stock under the Restricted Stock Purchase Agreement provides for monthly vesting over four years, some of which provide for 25% vesting on the first anniversary from the date of issuance or hire date with the remainder vesting monthly over the subsequent three years. The repurchase right is exercisable on unvested shares during the 90-day period following the date a founder ceases for any reason to provide service to the Company. As of December 29, 2013 and December 30, 2012, 52,792,969 shares have vested and 19,531 shares are expected to vest and 42,753,906 shares have vested and 10,058,594 are expected to vest, respectively. No amount of compensation expense has been recognized in connection with these shares, as they were deemed to have nominal value at the date of issuance.
Repurchase of Common Stock
In August 2011, the Company issued 1,953,318 shares of Class B common stock to a new investor. Simultaneously, the Company repurchased the same number shares of Class B common stock from four of the Company's employees, at a price that exceeded the estimated fair value of $10.5 million on that date. The fair value of the shares was determined using the option pricing method. The option pricing method treats the rights of the holders of preferred and common shares as equivalent to that of call options on any value of the enterprise above certain break points of value based upon the liquidation preferences of the holders of preferred shares, as well as their rights to participation and conversion. The resulting value of the common stock can be determined by estimating the value of its portion of each of these call option rights. The option pricing method uses the Black-Scholes option pricing model to price the call option. As a result, the Company recorded stock-based compensation expense and a corresponding capital contribution equal to the difference between the repurchase price and the estimated fair market value of the shares. Such expense totaled $0.5 million and is included in SG&A expenses as of January 1, 2012.
Equity Incentive Plans
The Company has two equity incentive plans: the 2009 Equity Incentive Plan (the "2009 Plan") and the 2013 Equity Plan (the "2013 Plan"). Under the 2009 Plan, 18,105,313 shares of Class B common stock were reserved for issuance of incentive stock options ("ISOs"), nonstatutory stock options ("NSOs"), stock appreciation rights,
70
restricted stock awards, restricted stock unit awards and other stock-based payment awards to employees, directors and consultants. Upon the IPO, 11,795,185 shares of Class A common stock were initially reserved under the 2013 Plan and 1,627,200 shares of Class B common stock that were reserved under the 2009 Plan but not issued were assumed by the 2013 Plan for future issuance as Class A common stock awards. The 2013 Plan will also assume the maximum number of shares subject to stock options or other awards granted under the 2009 Plan that may be returned to the 2009 Plan, such as upon expiration or termination of a stock award prior to vesting. The maximum number of shares of Class A common stock issuable under the 2013 Plan is 27,610,562. The 2013 Plan provides for an annual increase, for a period of ten years, in the number of shares available for issuance on the first day of each fiscal year beginning in 2014. As of December 29, 2013, the total number of shares available under the 2013 Plan was 13,345,624 shares. No new awards will be issued under the 2009 Plan. Under the 2013 Plan, the Company has the ability to issues ISOs, NSOs, stock appreciation rights, restricted stock awards, restricted stock unit awards and other stock awards. The ISOs and NSOs will be granted at a price per share not less than the fair value at the date of grant. Options granted to date generally provide for 25% vesting on the first anniversary from the date of grant with the remainder vesting monthly over the subsequent three years and expire 10 years from the date of grant.
Stock-Based Compensation Expense
The fair value of options granted to employees is estimated on the grant date using the Black-Scholes option pricing model. The assumptions used to calculate the fair value of options granted are evaluated and revised, as necessary, to reflect market conditions and the Company’s experience. The Black-Scholes option pricing model requires inputs such as expected term, expected volatility and risk-free interest rate. These inputs are subjective and generally require significant analysis and judgment to develop. Due to the limited period of time the Company’s equity shares have been publicly traded, the Company uses the simplified method provided by the Securities and Exchange Commission in estimating the expected term. This represents the average period from vesting to the expiration of the stock option. For grants to nonemployees, the expected term is equal to the contractual term, which is generally ten years. The expected volatility was estimated by taking the average historical price volatility for industry peers, which the Company has designated, based on daily price observations over a period equivalent to the expected term of the stock option grants. The dividend yield is 0%, since the Company has not paid, and does not expect to pay, dividends. The risk-free interest rate is based on the implied yield available on U.S. Treasury issues with an equivalent remaining term.
The fair value of each stock option is estimated on the grant date with the following weighted-average assumptions:
Year Ended | |||||||||||
December 29, 2013 | December 30, 2012 | January 1, 2012 | |||||||||
Expected term (years) | 6.66 | 5.98 | 5.69 | ||||||||
Expected volatility | 50.9 | % | 61.7 | % | 61.7 | % | |||||
Expected dividend yield | — | % | — | % | — | % | |||||
Risk-free interest rate | 1.3 | % | 1.0 | % | 1.6 | % | |||||
Weighted average grant-date fair value of stock options granted | $ | 6.75 | $ | 4.10 | $ | 2.15 | |||||
The following table presents the effects of stock-based compensation on the consolidated statements of operations during the periods presented:
Year Ended | |||||||||||
December 29, 2013 | December 30, 2012 | January 1, 2012 | |||||||||
(in thousands) | |||||||||||
Cost of sales | $ | 70 | $ | 26 | $ | 2 | |||||
Marketing expenses | 327 | 142 | 62 | ||||||||
Selling, general and administrative expenses | 7,380 | 1,097 | 2,015 | ||||||||
Total stock-based compensation expense | $ | 7,777 | $ | 1,265 | $ | 2,079 | |||||
71
The Company recognizes compensation expense on a straight-line basis over the requisite service period for each stock option, with forfeitures estimated at the date of grant based on the Company’s historical experience and future expectations.
In November 2011, the Company issued 80,127 shares of Class B common stock to a third party in exchange for executive recruiting services. As a result, the Company recorded stock-based compensation expense and a corresponding capital contribution equal to the estimated fair market value of the shares on the date when the service obligation was met. Such expense totaled $0.3 million and is included in SG&A expenses for the fiscal year ended January 1, 2012.
During the fiscal years ended December 30, 2012 and January 1, 2012, stock options were modified in connection with terminations, which accelerated the vesting of the stock options. The Company recorded stock-based compensation expense for the incremental fair value of the modified awards. Such amount totaled $0.1 million and $0.2 million, and is included in SG&A expenses for the fiscal years ended December 30, 2012 and January 1, 2012, respectively.
The Company recognized and capitalized $0.0 million and $0.2 million, respectively, of stock-based compensation as capitalized software costs included within property and equipment—net on the accompanying consolidated balance sheets as of December 29, 2013 and December 30, 2012, respectively.
As of December 29, 2013 and December 30, 2012, the Company had total unrecognized compensation costs related to unvested stock options of $52.6 million and $11.0 million, respectively. The Company expects to recognize this cost over a weighted-average period of 5.8 years.
The following table summarizes additional information about stock options outstanding as of December 29, 2013:
Outstanding | Outstanding and Vested | |||||||||||||||
Weighted Average | ||||||||||||||||
Range of Exercise Price | Options | Exercise Price | Remaining Contractual Life (in Years) | Options | Weighted Average Exercise Price | |||||||||||
$0.028—$0.24 | 2,109,442 | $ | 0.11 | 6.45 | 1,960,996 | $ | 0.10 | |||||||||
$0.312—$0.728 | 1,595,205 | $ | 0.44 | 7.27 | 1,040,456 | $ | 0.43 | |||||||||
$5.40 - $10.28 | 9,118,385 | $ | 9.20 | 9.13 | 1,076,398 | $ | 7.14 | |||||||||
$13.44 - $22.00 | 1,051,277 | $ | 15.33 | 9.69 | 16,255 | $ | 13.44 | |||||||||
$35.14 - $35.14 | 64,178 | $ | 35.14 | 9.93 | — | $ | — | |||||||||
Total | 13,938,487 | $ | 7.40 | 8.56 | 4,094,105 | $ | 2.09 | |||||||||
72
The table summarizes stock option activity as follows:
Number of Shares Underlying Options | Weighted Average Exercise Price | Weighted Average Remaining Contractual Term (in Years) | Total Intrinsic Value | ||||||||||
(in thousands, except price, shares and years) | |||||||||||||
Outstanding at December 30, 2012 | 7,430,518 | $ | 2.85 | 8.46 | $ | 34,417 | |||||||
Granted | 7,827,576 | 10.97 | |||||||||||
Exercised | (867,137 | ) | 1.19 | ||||||||||
Canceled | (452,470 | ) | 6.33 | ||||||||||
Outstanding at December 29, 2013 | 13,938,487 | 7.40 | 8.56 | 462,558 | |||||||||
Vested and expected to vest at December 30, 2012 | 7,179,810 | 2.76 | 8.44 | 33,881 | |||||||||
Exercisable at December 30, 2012 | 3,860,453 | 0.70 | 7.85 | 27,101 | |||||||||
Vested and expected to vest at December 29, 2013 | 13,564,513 | 7.32 | 8.54 | 451,261 | |||||||||
Exercisable at December 29, 2013 | 9,556,766 | 6.42 | 8.36 | 326,567 | |||||||||
During the fiscal year ended January 1, 2012, the Company issued 1,439,627 Class B common shares for the exercise of stock options. Of this amount, 473,958 Class B common shares were early exercised and are subject to repurchase in accordance with the provision of the 2009 Plan. The unvested portion of the early exercised shares as of December 29, 2013 and December 30, 2012, was 63,151 and 227,213 shares, respectively. No repurchases have been made by the Company.
Exercisable stock options as of December 29, 2013 and December 30, 2012 include 5,462,661 and 2,226,828 options that are early exercisable, respectively.
NOTE 8. NET INCOME (LOSS) PER SHARE
Net income (loss) per common share is presented using the two-class method required for participating securities. Concurrent with the closing of the IPO in November 2013, all shares of outstanding preferred stock automatically converted into 60,621,233 shares of the Company's Class B common stock. Prior to the IPO, the Company considered all holders of preferred stock to be participating securities as they were entitled to receive non-cumulative dividends. Additionally, the Company considers holders of unvested restricted common stock to be participating securities because of their non-forfeitable rights to dividends, in the event dividends are declared and paid.
Following the completion of the Company's IPO in November 2013, Class A and Class B common stock are the only outstanding equity in the Company. The rights of the holders of Class A and Class B common stock are identical, except with respect to voting and conversion. Each share of Class A common stock is entitled to one vote per share and each share of Class B common stock is entitled to ten votes per share, on all matters that are subject to stockholder vote. Shares of Class B common stock may be converted into Class A common stock at any time at the option of the stockholder, and are automatically converted upon transfer to Class A common stock, subject to certain limited exceptions.
Undistributed earnings allocated to the participating securities are subtracted from net income in determining net income attributable to Class A and Class B common stockholders. Net losses are not allocated to the participating securities as holders of preferred stock and unvested restricted common stock do not have a contractual obligation to share in the losses of the Company. Undistributed earnings are calculated as net income (loss) less distributed earnings, accretion of convertible preferred stock, and current period convertible preferred stock non-cumulative dividends, whether or not declared. Basic net income (loss) per share is computed by dividing net income attributable to Class A and Class B common stockholders by the weighted-average number of shares of Class A and Class B common stock outstanding during the period, adjusted for unvested restricted common shares subject to repurchase.
For the calculation of diluted net income (loss), net income attributable to Class A and Class B common stockholders for basic net income is adjusted by the effect of dilutive securities, including awards under our equity
73
compensation plans. Diluted EPS attributable to Class A and Class B common stockholders is computed by dividing the resulting net income attributable to Class A and Class B common stockholders by the weighted-average number of fully diluted Class A and Class B common shares outstanding.
Any undistributed earnings attributable to Class A and Class B common stockholders are allocated based on the contractual participation rights of the Class A and Class B common shares as if the earnings for the year have been distributed. As the liquidation and dividend rights are identical, undistributed earnings are allocated on a proportionate basis.
For the fiscal year ended December 29, 2013, the computation of basic and diluted net income (loss) per share is presented on a combined basis for Class A and Class B common stock because the results are identical.
The following table presents the calculation of basic and diluted net income (loss) per common share:
Year Ended | |||||||||||
December 29, 2013 | December 30, 2012 | January 1, 2012 | |||||||||
(in thousands, except share and per share amounts) | |||||||||||
Numerator | |||||||||||
Net income (loss) | $ | 12,908 | $ | (10,335 | ) | $ | (11,314 | ) | |||
Less: Accretion of convertible redeemable preferred stock | (8,975 | ) | (4,375 | ) | (1,919 | ) | |||||
Less: Distributed earnings attributable to participating securities | — | (32,112 | ) | — | |||||||
Less: Undistributed earnings attributable to participating securities | (3,933 | ) | — | — | |||||||
Net income (loss) attributable to Class A and Class B common stockholders | $ | — | $ | (46,822 | ) | $ | (13,233 | ) | |||
Denominator | |||||||||||
Weighted average shares used to compute basic net income (loss) per Class A and Class B common share | 59,450,186 | 37,976,724 | 24,102,780 | ||||||||
Effect of potentially dilutive securities: | |||||||||||
Stock options | — | — | — | ||||||||
Unvested restricted common shares | — | — | — | ||||||||
Convertible preferred shares | — | — | — | ||||||||
Weighted average shares used to compute diluted net income (loss) per Class A and Class B common share | 59,450,186 | 37,976,724 | 24,102,780 | ||||||||
Net income (loss) per share attributable to Class A and Class B common stockholders—basic | $ | — | $ | (1.23 | ) | $ | (0.55 | ) | |||
Net income (loss) per share attributable to Class A and Class B common stockholders—diluted | $ | — | $ | (1.23 | ) | $ | (0.55 | ) | |||
The following have been excluded from the computation of basic and diluted net income (loss) per share attributable to Class A and Class B common stockholders as their effect would have been antidilutive:
Year Ended | ||||||||
December 29, 2013 | December 30, 2012 | January 1, 2012 | ||||||
Convertible preferred shares | 53,184,953 | 55,827,571 | 51,883,278 | |||||
Unvested restricted common shares | 3,644,546 | 16,468,775 | 29,846,681 | |||||
Stock options | 13,938,487 | 7,430,501 | 8,200,929 | |||||
Total | 70,767,986 | 79,726,847 | 89,930,888 | |||||
74
NOTE 9. SEGMENT INFORMATION
The Company has two reportable segments: North America and U.K. The Company’s reportable segments have been identified based on how the Company’s chief operating decision maker manages the Company’s businesses, makes operating decisions, and evaluates operating performance. The Company’s chief operating decision maker is its chief executive officer. The Company evaluates the performance of its reportable segments based on net sales and loss from operations. The accounting policies of the reportable segments are the same as those described in the summary of significant accounting policies in Note 2, "Summary of Significant Accounting Policies". Loss from operations represents net loss before interest income (expense), net, other income (expense), net and provision for income taxes. Management does not evaluate the performance of its reportable segments using asset measures.
North America—The North America segment consists of amounts earned from retail and services sales through the Company’s North America-focused sites, including sales from the sites to customers in the United States, Canada and other foreign countries fulfilled through a third-party service provider.
U.K.—The U.K. segment consists of amounts earned from retail and services sales through the Company’s U.K.-focused sites, including sales from the sites to customers in the United Kingdom and throughout Europe.
Certain U.S. corporate-level activities are not allocated to the U.K. segment, including costs of marketing, human resources, legal, finance and technology.
The Company accounts for intersegment sales in accordance with the underlying transfer pricing agreement between zulily, inc. and Zulily UK Ltd.
Information on reportable segments and reconciliation to consolidated net income (loss) before provision for income taxes is as follows:
Year Ended | |||||||||||
December 29, 2013 | December 30, 2012 | January 1, 2012 | |||||||||
(in thousands) | |||||||||||
North America | |||||||||||
Net sales | $ | 681,826 | $ | 326,349 | $ | 142,545 | |||||
Operating income (loss) | 17,173 | (6,072 | ) | (11,455 | ) | ||||||
Intersegment expense | (4,093 | ) | (4,571 | ) | — | ||||||
Total segment operating income (loss) | 13,080 | (10,643 | ) | (11,455 | ) | ||||||
U.K. | |||||||||||
Net sales | 13,883 | 4,891 | — | ||||||||
Intersegment sales | 4,093 | 4,571 | — | ||||||||
Total net sales | 17,976 | 9,462 | — | ||||||||
Segment operating (loss) income | $ | (51 | ) | $ | 89 | $ | (82 | ) | |||
Consolidated | |||||||||||
Net sales | |||||||||||
Total sales for reportable segments | $ | 699,802 | $ | 335,811 | $ | 142,545 | |||||
Elimination of intersegment sales | (4,093 | ) | (4,571 | ) | — | ||||||
Total consolidated net sales | $ | 695,709 | $ | 331,240 | $ | 142,545 | |||||
Net income (loss) before provision for income taxes | |||||||||||
Total operating income (loss) for reportable segments | $ | 13,029 | $ | (10,554 | ) | $ | (11,537 | ) | |||
Interest income (expense)—net | 136 | 43 | 20 | ||||||||
Other income (expense)—net | 99 | 176 | 203 | ||||||||
Net income (loss) before provision for income taxes | $ | 13,264 | $ | (10,335 | ) | $ | (11,314 | ) | |||
75
The Company’s assets are primarily located in the United States as of the fiscal years ended December 29, 2013 and December 30, 2012. Revenue from external customers for each group of similar products and services are not reported to the Company’s chief operating decision maker. The separate identification of this information for purposes of segment disclosure is impracticable, as it is not readily available and the cost to develop it would be excessive.
NOTE 10. INCOME TAXES
The components of income (loss) before provision for income taxes are as follows:
Year Ended | |||||||||||
December 29, 2013 | December 30, 2012 | January 1, 2012 | |||||||||
(in thousands) | |||||||||||
U.S. | $ | 13,266 | $ | (10,401 | ) | $ | (11,232 | ) | |||
Foreign | (2 | ) | 66 | (82 | ) | ||||||
Income before income taxes | $ | 13,264 | $ | (10,335 | ) | $ | (11,314 | ) | |||
For the fiscal years ended December 29, 2013 and December 30, 2012, the Company recorded tax provisions of $0.4 million and zero, respectively. The Company currently has tax benefits relating to prior year net operating losses that are being utilized to reduce the Company's U.S. taxable income. Income taxes have been provided as follows:
Year Ended | |||||||||||
December 29, 2013 | December 30, 2012 | January 1, 2012 | |||||||||
(in thousands) | |||||||||||
Current tax expense: | |||||||||||
Federal | $ | 356 | $ | — | $ | — | |||||
State | — | — | — | ||||||||
Foreign | — | — | — | ||||||||
Current tax expense | 356 | — | — | ||||||||
Deferred tax expense: | |||||||||||
Federal | — | — | — | ||||||||
State | — | — | — | ||||||||
Foreign | — | — | — | ||||||||
Deferred tax expense | — | — | — | ||||||||
Provision for income taxes | $ | 356 | $ | — | $ | — | |||||
Reconciliation of income tax computed at federal statutory rates to the reported provisions for income taxes is as follows:
76
Year ended | ||||||||
December 29, 2013 | December 30, 2012 | January 1, 2012 | ||||||
Federal statutory rate | 35.0 | % | (34.0 | )% | (34.0 | )% | ||
Effect of: | ||||||||
State income tax | — | (1.0 | ) | (1.1 | ) | |||
Non-deductible expenses | 0.2 | (0.1 | ) | 0.1 | ||||
R&D tax credit generated in current year | (2.3 | ) | (4.6 | ) | — | |||
Stock-based compensation | 5.6 | 4.2 | 2.0 | |||||
Other | 0.1 | 0.4 | — | |||||
Valuation allowance | (35.9 | ) | 35.1 | 33.0 | ||||
Total | 2.7 | % | — | % | — | % | ||
The Company's effective tax rate for the fiscal years ended December 29, 2013 and December 30, 2012, was lower than the 35% U.S. federal statutory rate primarily due to the research and development credit, stock-based compensation plans, and change in the Company's valuation allowance. The largest driver of the Company's decreased tax rate for the fiscal year ended December 29, 2013 relates to the $4.7 million decrease in its valuation allowance for the year. The decrease in the valuation allowance comes as a result of the Company's ability to utilize a portion of its tax loss carryforwards in the current year. For all other losses which the Company may not realize a related tax benefit, the Company has recorded a valuation allowance against the deferred tax assets associated with those losses.
Deferred tax assets and liabilities are summarized as follows:
As Of | |||||||
December 29, 2013 | December 30, 2012 | ||||||
(in thousands) | |||||||
Deferred tax assets: | |||||||
Tax loss carryforwards | $ | 2,402 | $ | 9,359 | |||
Returns and accruals | 1,305 | 496 | |||||
Deferred rent | 817 | 582 | |||||
Inventories | 746 | 373 | |||||
Stock-based compensation | 2,027 | 125 | |||||
Tax-credit carryforwards | 1,236 | 572 | |||||
Deferred tax assets | 8,533 | 11,507 | |||||
Deferred tax liabilities: | |||||||
Property and equipment | (4,115 | ) | (2,538 | ) | |||
Prepaid expenses and other current assets | (400 | ) | (268 | ) | |||
Unrealized foreign exchange gain | (34 | ) | — | ||||
Deferred tax liabilities | (4,549 | ) | (2,806 | ) | |||
Valuation allowance | (3,984 | ) | (8,701 | ) | |||
Deferred tax asset (liability), net | $ | — | $ | — | |||
Current asset (liability), net | $ | 2,675 | $ | 87 | |||
Noncurrent asset (liability), net | (2,675 | ) | (87 | ) | |||
Deferred tax asset (liability), net | $ | — | $ | — | |||
The Company records a valuation allowance based on the amount of tax assets and loss carryforwards that it believes will more likely than not go unused. As of December 29, 2013, all of the Company's valuation allowance relates to deferred tax assets which, if subsequently recognized, will reduce income tax expense. For the fiscal year ended December 29, 2013, the valuation allowance decreased by $4.7 million.
77
At December 29, 2013, the Company had federal and non-U.S. net operating loss carryforwards of $8.9 million and $0.3 million, respectively. Use of the carryforwards is limited based on the future income of the Company and its U.K. subsidiary. The federal net operating loss carryforwards will begin to expire in 2032. The Company also had $1.3 million of federal research and development tax credit carryforwards as of December 29, 2013, which begin to expire in 2031, and $0.4 million in alternative tax credits that do not expire.
Approximately $2.3 million of the net operating loss carryforwards relate to tax deductible stock-based compensation in excess of amounts recognized for financial statement purposes. To the extent that net operating loss carryforwards, if realized, relate to excess stock-based compensation, the resulting tax benefits will be recorded to stockholders' equity (deficit), rather than to results of operations.
Under section 382 of the Internal Revenue Code, the Company’s ability to utilize net operating loss carryforwards or other tax attributes, such as research tax credits, in any taxable year may be limited if it experiences an “ownership change.” A section 382 “ownership change” generally occurs if one or more stockholders or groups of stockholders who own at least 5% of the Company’s stock increase their ownership by more than 50 percentage points over their lowest ownership percentage within a rolling three-year period or since the date of a prior ownership change, if within three years. Similar rules may apply under state tax laws.
A reconciliation of the change in amount of gross unrecognized income tax benefits for the prior three years is as follows:
Year Ended | |||||||||||
December 29, 2013 | December 30, 2012 | January 1, 2012 | |||||||||
(in thousands) | |||||||||||
Balance at the beginning of the year | $ | — | $ | — | $ | — | |||||
Increase related to prior period tax positions | 172 | — | — | ||||||||
Increase related to current period tax positions | 205 | — | — | ||||||||
Balance at the end of the year | $ | 377 | $ | — | $ | — | |||||
As of December 29, 2013, the Company had $0.4 million in tax contingencies, of which the entire amount, if fully recognized, would decrease the Company's effective tax rate.
The Company does not have any penalties or interest. Further, the Company is not under examination or audit by any taxing authority or jurisdictions for any tax year.
Tax benefits for uncertain tax positions are based upon management's evaluation of the information available at the reporting date. To be recognized in the financial statements, a tax benefit must be at least more likely than not of being sustained based on technical merits. The benefit for positions meeting the recognition threshold is measured as the largest benefit more likely than not of being realized upon settlement with a taxing authority that has full knowledge of all relevant information. The Company has established a reserve for uncertain tax positions in regards to a portion of its federal research and development credits carryforwards.
To the extent that the research & development tax credits, if realized, relate to stock-based compensation, the resulting tax benefits will be recorded to the results of operations rather than stockholders' equity (deficit).
NOTE 11. RELATED-PARTY TRANSACTIONS
Mark Vadon, the Chairman of the Board of Directors of the Company, was a director of Blue Nile, Inc. during the fiscal years ended December 30, 2012 and January 1, 2012 and part of the fiscal year ended December 29, 2013 and owns a significant number of shares of Blue Nile, Inc. In addition, Michael Potter and W. Eric Carlborg, members of the Company’s Board of Directors are also directors of Blue Nile, Inc. an online retailer of high-quality diamonds and fine jewelry.
The Company purchased products from Blue Nile, Inc., totaling approximately $0.0 million, $0.0 million, and $0.1 million for fiscal years ended December 29, 2013, December 30, 2012 and January 1, 2012 respectively. As of December 29, 2013 and December 30, 2012, the Company had no amounts recorded in accounts payable.
78
NOTE 12. SUBSEQUENT EVENTS
Credit Facility
On January 23, 2014, the Company entered into a $50 million revolving credit facility pursuant to a Credit Agreement with certain lenders. Loans under the Credit Agreement will mature on January 23, 2016. The Credit Agreement includes a letter of credit sub-limit of up to $15 million.
Amounts drawn down under the Credit Agreement bear interest, at the Company's option, in an amount equal to (i) in the case of base rate loans, 1.50% plus the highest of (a) the Federal Funds Rate plus one-half of one percent (0.50%), (b) the prime rate, and (c) the eurodollar rate plus two percent (2.00%), or (ii) in the case of eurodollar loans, for any interest period, LIBOR plus 2.50%. An undrawn commitment fee shall be payable to the lenders in an amount equal to 0.175% times the actual daily amount by which the aggregate commitments exceed the sum of the outstanding amount of loans and the outstanding amount of letter of credit obligations, calculated on a quarterly basis in arrears.
The Company is permitted to make voluntary prepayments at any time without payment of a premium, provided that it will be subject to a breakage indemnity in the case of prepayments of LIBOR loans.
The Credit Agreement contains customary representations and warranties and customary affirmative and negative covenants, in each case applicable to the Company and its subsidiaries. The negative covenants include restrictions on, among other things, indebtedness, liens, investments, mergers, dispositions, dividends and other distributions. The Credit Agreement contains certain financial covenants that require the Company and its subsidiaries to, among other things, maintain a minimum fixed charge coverage ratio of 1.35 to 1.0 and minimum quick ratio of 1.1 to 1.0, and requires the Company to maintain a senior leverage ratio not in excess of 2.0 to 1.0.
The Credit Agreement includes customary events of default, including a change of control and a cross-default on the Company's or any subsidiary’s material indebtedness. Our obligations under the Credit Agreement are secured by substantially all of the Company's and its subsidiaries’ assets, and the Company’s obligations under the Credit Agreement will be guaranteed by certain of its subsequently acquired or organized direct and indirect domestic subsidiaries.
Fulfillment Center Lease
In January 2014, the Company entered into a lease agreement for a fulfillment center being constructed in McCarran, Nevada. The initial term of the lease expires 12 years from the earlier of completion of the fulfillment center or the date we commence business operations from the leased property. As part of the agreement, the Company issued a security deposit in the form of an irrevocable standby letter of credit totaling $3.0 million and expiring in 2026. The standby letter of credit may be drawn if certain conditions occur, including default on payments, losses incurred due to breach or termination of the agreement.
* * * * * *
79
Item 9. Changes in and Disagreements With Accountants on Accounting and Financial Disclosure
None.
Item 9A. Controls and Procedures
Evaluation of Disclosure Controls and Procedures
We carried out an evaluation required by the Exchange Act, under the supervision and with the participation of our principal executive officer and principal financial officer, of the effectiveness of the design and operation of our disclosure controls and procedures, as defined in Rule 13a-15(e) of the Exchange Act, as of December 29, 2013. Based on this evaluation, and due to the presence of a material weakness in our internal control over financial reporting, which is described below and was previously disclosed in our registration statement on Form S-1, as amended (File No. 333-191617), our principal executive officer and principal financial officer concluded that, as of December 29, 2013, our disclosure controls and procedures were not effective to provide reasonable assurance that information required to be disclosed by us in the reports that we file or submit under the Exchange Act is recorded, processed, summarized, and reported within the time periods specified in the SEC’s rules and forms and to provide reasonable assurance that such information is accumulated and communicated to our management, including our principal executive officer and principal financial officer, as appropriate to allow timely decisions regarding required disclosures.
We and our independent registered public accounting firm previously identified a material weakness in our internal control over financial reporting, subsequent to the issuance of our consolidated financial statements for the fiscal years ended December 30, 2012 and January 1, 2012. The material weakness identified related to the lack of sufficient technical accounting skills within our accounting and finance organization.
We have taken steps to remediate the material weakness, including increasing the size, depth and experience within our accounting and finance organization, as well as designing and implementing improved processes and internal controls.
Management’s Report on Internal Control over Financial Reporting
This Annual Report does not include a report of management’s assessment regarding internal control over financial reporting or an attestation report of our independent registered public accounting firm due to a transition period established by the rules of the SEC for newly public companies.
Changes in Internal Control Over Financial Reporting
There were no changes in our internal control over financial reporting identified in connection with the evaluation required by Rule 13a-15(d) and 15d-15(d) of the Exchange Act during the fourth quarter of 2013 that materially affected, or are reasonably likely to materially affect, our internal control over financial reporting.
Limitations on Controls
Our disclosure controls and procedures and internal control over financial reporting are designed to provide reasonable assurance of achieving their objectives as specified above. Management does not expect, however, that our disclosure controls and procedures or our internal control over financial reporting will prevent or detect all error and fraud. Any control system, no matter how well designed and operated, is based upon certain assumptions and can provide only reasonable, not absolute, assurance that its objectives will be met. Further, no evaluation of controls can provide absolute assurance that misstatements due to error or fraud will not occur or that all control issues and instances of fraud, if any, within the Company have been detected.
Item 9B. Other Information
None.
Item 10. Directors, Executive Officers and Corporate Governance
80
Information required by this Item is incorporated herein by reference to the sections entitled "Executive Officers," "Proposal No. 1- Election of Directors," "Information Regarding the Board of Directors and Corporate Governance," "Information Regarding Committees of the Board of Directors" and "Executive Officers" in our Proxy Statement with respect to our 2014 Annual Meeting of Stockholders to be filed with the SEC within 120 days after the end of the fiscal year covered by this Annual Report.
Item 11. Executive Compensation
Information required by this Item is incorporated herein by reference to the sections entitled "Executive Compensation", "Director Compensation", and "Equity Compensation Plan Information" in our Proxy Statement with respect to our 2014 Annual Meeting of Stockholders to be filed with the SEC within 120 days of the end of the fiscal year covered by this Annual Report.
Item 12. Security Ownership of Certain Beneficial Owners and Management and Related Stockholder Matters
Information required by this Item is incorporated herein by reference to the section entitled “Security Ownership of Certain Beneficial Owners and Management” in our Proxy Statement with respect to our 2014 Annual Meeting of Stockholders to be filed with the SEC within 120 days of the end of the fiscal year covered by this Annual Report.
Item 13. Certain Relationships and Related Transactions and Director Independence
Information required by this Item is incorporated herein by reference to the sections entitled "Transactions with Related Persons" and "Information Regarding Committees of the Board of Directors" in our Proxy Statement with respect to our 2014 Annual Meeting of Stockholders to be filed with the SEC within 120 days of the end of the fiscal year covered by this Annual Report.
Item 14. Principal Accounting Fees and Services
Information required by this Item is incorporated herein by reference to the section entitled "Proposal No. 2 - Ratification of Selection of Independent Registered Public Accounting Firm" in our Proxy Statement with respect to our 2014 Annual Meeting of Stockholders to be filed with the SEC within 120 days after the end of the fiscal year covered by this Annual Report.
Item 15. Exhibits, Financial Statement Schedules
a) The following documents are filed as part of this Annual Report on Form 10-K:
1. Financial Statements: Our consolidated financial statements and the Report of Independent Registered Public Accounting Firm are included herein on the pages indicated:
Page | |
81
2. Financial Statement Schedules: None. All financial statement schedules are omitted because they are not applicable, not required under the instructions, or the requested information is included in the consolidated financial statements or notes thereto.
3. Exhibits: A list of exhibits filed with this report or incorporated herein by reference is found in the Exhibit Index immediately following the Signatures page of this Annual Report.
82
SIGNATURES
Pursuant to the requirements of Section 13 or 15(d) of the Securities Exchange Act of 1934, the registrant has duly caused this Annual Report on Form 10-K to be signed on its behalf by the undersigned, thereunto duly authorized.
zulily, inc. | ||
(Registrant) | ||
Date: February 28, 2014 | By: | /s/ Darrell Cavens |
Darrell Cavens | ||
President and Chief Executive Officer | ||
POWER OF ATTORNEY
KNOW ALL PERSONS BY THESE PRESENTS, that each person whose signature appears below constitutes and appoints Darrell Cavens and Marc Stolzman, and each or any one of them, his or her true and lawful attorney-in-fact and agent, with full power of substitution and resubstitution, for him or her and in his or her name, place and stead, in any and all capacities, to sign any and all amendments (including posting effective amendments) to this Annual Report on Form 10-K, and to file the same, with all exhibits thereto, and other documents in connection therewith, with the Securities and Exchange Commission, granting unto said attorneys-in-facts and agents, and each of them, full power and authority to do and perform each and every act and thing requisite and necessary to be done in connection therewith, as fully to all intents and purposes as he or she might or could do in person, hereby ratifying and confirming all that said attorneys-in-fact and agents, or any of them, or their or his or her substitutes or substitutes, may lawfully do or cause to be done by virtue hereof.
This Annual Report on Form 10-K has been signed below by the following persons on behalf of the registrant and in the capacities and on the dates indicated, pursuant to the requirements of the Securities Exchange Act of 1934.
83
Signature | Title | Date | |
By | /s/ Darrell Cavens | February 28, 2014 | |
Darrell Cavens | President, Chief Executive Officer and Director (Principal Executive Officer) | ||
By | /s/ Marc Stolzman | February 28, 2014 | |
Marc Stolzman | Chief Financial Officer (Principal Financial and Accounting Officer) | ||
By | /s/ Mark Vadon | February 28, 2014 | |
Mark Vadon | Chairman of the Board | ||
By | /s/ W. Eric Carlborg | February 28, 2014 | |
W. Eric Carlborg | Director | ||
By | /s/ Dan Levitan | February 28, 2014 | |
Dan Levitan | Director | ||
By | /s/ Youngme Moon | February 28, 2014 | |
Youngme Moon | Director | ||
By | /s/ Michael Potter | February 28, 2014 | |
Michael Potter | Director | ||
By | /s/ Spencer Rascoff | February 28, 2014 | |
Spencer Rascoff | Director | ||
By | /s/ John Geschke | February 28, 2014 | |
John Geschke | Director | ||
84
EXHIBIT INDEX
The following exhibits are filed as part of this Annual Report on Form 10-K or are incorporated herein by reference. Where an exhibit is incorporated by reference, the number in parentheses indicates the document to which cross-reference is made. See the end of this exhibit index for a listing of cross-reference documents.
Incorporated by Reference | |||||||||||||||
Exhibit No. | Description of Exhibit | Form | File No. | Exhibit | Filing Date | Filed Herewith | |||||||||
3.1 | Amended and Restated Certificate of Incorporation of zulily, inc. | 8-K | 001-36188 | 3.1 | 11/21/2013 | ||||||||||
3.2 | Amended and Restated Bylaws of zulily, inc. | S-1/A | 333-191617 | 4.2 | 10/25/2013 | ||||||||||
4.1 | Form of Class B Common Stock Certificate | X | |||||||||||||
4.2 | Third Amended and Restated Investor Rights Agreement, dated November 5, 2012 | S-1 | 333-191617 | 4.1 | 10/8/2013 | ||||||||||
4.3 | Amendment No. 1 to Third Amended and Restated Investor Rights Agreement, dated October 17, 2013 | ||||||||||||||
10.1 | † | zulily, inc. 2009 Equity Incentive Plan, as amended | S-1 | 333-191617 | 10.1 | 10/8/2013 | |||||||||
10.2 | † | Forms of Option Agreement and Option Grant Notice under the zulily, inc. 2009 Equity Incentive Plan. | S-1 | 333-191617 | 10.2 | 10/8/2013 | |||||||||
10.3 | † | zulily, inc. 2013 Equity Plan. | S-1/A | 333-191617 | 10.3 | 10/17/2013 | |||||||||
10.4 | † | Forms of Option Agreement and Option Grant Notice under the zulily, inc. 2013 Equity Plan. | S-1/A | 333-191617 | 10.4 | 10/17/2013 | |||||||||
10.5 | † | Form of Indemnity Agreement entered into between zulily, inc. and each of its directors and its executive officers | S-1 | 333-191617 | 10.5 | 10/8/2013 | |||||||||
10.6 | † | Employment Offer Letter by and between zulily, inc. and Marc Stolzman, dated August 16, 2012 | S-1 | 333-191617 | 10.6 | 10/8/2013 | |||||||||
10.7 | † | Employment Offer Letter by and between zulily, inc. and Bob Spieth, dated December 10, 2012 | S-1 | 333-191617 | 10.7 | 10/8/2013 | |||||||||
10.8 | † | 2014 Executive Incentive Program | 8-K | 001-36188 | 10.2 | 2/27/2014 | |||||||||
10.9 | Cobalt Building Lease by and between zulily, inc. and UCM/FPI-Cobalt, LLC, dated May 18, 2011. | S-1 | 333-191617 | 10.8 | 10/8/2013 | ||||||||||
10.10 | Amendment No. 1 of Lease by and between zulily, inc. and UCM/FPI-Cobalt, LLC, dated October 5, 2011. | S-1 | 333-191617 | 10.9 | 10/8/2013 | ||||||||||
10.11 | Amendment No. 2 of Lease by and between zulily, inc. and UCM/FPI-Cobalt, LLC, dated February 8, 2012. | S-1 | 333-191617 | 10.10 | 10/8/2013 | ||||||||||
10.12 | Amendment No. 3 of Lease by and between zulily, inc. and UCM/FPI-Cobalt, LLC, dated June 15, 2012. | S-1 | 333-191617 | 10.11 | 10/8/2013 | ||||||||||
10.13 | Office Lease Agreement by and between zulily, inc. and SRI-WR Elliott Avenue LLC, dated May 2, 2013. | S-1 | 333-191617 | 10.12 | 10/8/2013 | ||||||||||
85
10.14 | Amendment No. 1 of Office Lease Agreement by and between zulily, inc. and SRI-WR Elliott Avenue LLC, dated November 21, 2013. | X | |||||||||||||
10.15 | Amended and Restated Lease by and between zulily, inc. and Eagle CPT, LLC, dated November 1, 2011 | S-1 | 333-191617 | 10.13 | 10/8/2013 | ||||||||||
10.16 | Agreement of Lease by and between zulily, inc. and KTR Ohio LLC, dated November, 2011 | S-1 | 333-191617 | 10.14 | 10/8/2013 | ||||||||||
10.17 | * | Service Agreement by and between zulily, inc. and IntelliSource, LLC, dated September 29, 2011. | S-1 | 333-191617 | 10.15 | 10/8/2013 | |||||||||
10.18 | * | Contractor Agreement by and between zulily, inc. and IntelliSource, LLC, dated December 19, 2011. | S-1 | 333-191617 | 10.16 | 10/8/2013 | |||||||||
10.19 | Lease Agreement (USA Parkway Distribution Center/McCarran, NV) dated as of January 24, 2014, by and between US Real Estate Limited Partnership and zulily, inc. | 8-K | 001-36188 | 10.1 | 1/29/2014 | ||||||||||
10.20 | Credit Agreement, dated as of January 23, 2014, among zulily, inc., the Lenders party thereto, Citibank, N.A., as Administrative Agent, Lead Arranger, Sole Book Runner, Collateral Agent and L/C Issuer and Merrill Lynch, Pierce, Fenner & Smith, as Syndication Agent. | 8-K | 001-36188 | 10.2 | 1/29/2014 | ||||||||||
21.1 | List of subsidiaries. | S-1 | 333-191617 | 21.1 | 10/8/2013 | ||||||||||
23.1 | Consent of Deloitte & Touche LLP, independent registered public accounting firm. | X | |||||||||||||
24.1 | Power of Attorney (included on the Signatures page of this Annual Report on Form 10-K) | X | |||||||||||||
31.1 | Certification of the Chief Executive Officer pursuant to Rule 13a-14 under the Securities Exchange Act of 1934 | X | |||||||||||||
31.2 | Certification of the Chief Financial Officer pursuant to Rule 13a-14 under the Securities Exchange Act of 1934. | X | |||||||||||||
32.1 | ** | Certification of the Chief Executive Officer and Chief Financial Officer pursuant to 18 U.S.C. Section 1350 as Adopted Pursuant to Section 906 of the Sarbanes-Oxley Act of 2002 | X | ||||||||||||
† Indicates management contract or compensatory plan or arrangement.
* Confidential treatment for portions of this exhibit has been granted by the Securities and Exchange Commission.
** Document has been furnished, is not deemed filed and is not to be incorporated by reference into any of the Company's filings under the Securities Act of 1933, as amended, or the Securities Exchange Act of 1934, as amended, irrespective of any general incorporation language contained in any such filing.
** In accordance with Rule 406T of Regulation S-T, the information in these exhibits is furnished and deemed not filed or part of a registration statement or prospectus for purposes of Sections 11 or 12 of the Securities Act of 1933, as amended, is deemed not filed for purposes of Section 18 of the Exchange Act of 1934, irrespective of any general incorporation language contained in any such filing, and otherwise is not subject to liability under these sections.
86