Attached files
| file | filename |
|---|---|
| 8-K - FORM 8-K - PEPCO HOLDINGS LLC | t78467_8k.htm |
Exhibit 99.1
 |
Morgan Stanley Utilities Conference
Investing Today for a Brighter Tomorrow
March 3, 2014 New York, NY
|
 |
Safe Harbor Statement/Regulation G Information
Some of the statements contained in today’s presentation with respect to Pepco Holdings, Pepco, Delmarva Power and Atlantic City Electric, including each of their respective subsidiaries, are forward-looking statements within the meaning of the U.S. federal securities laws and are subject to the safe harbor created thereby under the Private Securities Litigation Reform Act of 1995. These statements include declarations regarding the intents, beliefs and current expectations of one or more of PHI, Pepco, DPL or ACE (each, a Reporting Company) or their subsidiaries. In some cases you can identify forward-looking statements by terminology such as “may,” “might,” “will,” “should,” “could,” “expects,” “intends,” “assumes,” “seeks to,” “plans,” “anticipates,” “believes,” “projects,” “estimates,” “predicts,” “potential,” “future,” “goal,” “objective,” or “continue”, the negative or other variations of such terms, or comparable terminology, or by discussions of strategy that involve risks and uncertainties. Forward-looking statements involve estimates, assumptions, known and unknown risks, uncertainties and other factors that may cause one or more Reporting Companies’ or their subsidiaries’ actual results, levels of activity, performance or achievements to be materially different from any future results, levels of activity, performance or achievements expressed or implied by such forward-looking statements. Therefore, forward-looking statements are not guarantees or assurances of future performance, and actual results could differ materially from those indicated by the forward-looking statements. These forward-looking statements are qualified in their entirety by, and should be read together with, the risk factors included in the “Risk Factors” section and other statements in each Reporting Company’s annual report on Form 10-K for the year ended December 31, 2013 filed on February 28, 2014 and in other Securities and Exchange Commission (SEC) filings, and investors should refer to these risk factor sections and such other statements. All such factors are difficult to predict, contain uncertainties, are beyond each Reporting Company’s or its subsidiaries’ control and may cause actual results to differ materially from those contained in the forward-looking statements. Any forward-looking statements speak only as of the date of this presentation and none of the Reporting Companies undertakes any obligation to update any forward-looking statements to reflect events or circumstances after the date on which such statements are made or to reflect the occurrence of unanticipated events. New factors emerge from time to time, and it is not possible for a Reporting Company to predict all such factors. Furthermore, it may not be possible to assess the impact of any such factor on such Reporting Company’s or its subsidiaries’ business (viewed independently or together with the business or businesses of some or all of the other Reporting Companies or their subsidiaries) or the extent to which any factor, or combination of factors, may cause results to differ materially from those contained in any forward-looking statement. Any specific factors that may be provided should not be construed as exhaustive.
PHI routinely makes available important information with respect to each Reporting Company, including copies of each Reporting Company’s annual, quarterly and current reports filed with or furnished to the SEC under the Securities Exchange Act of 1934, on PHI’s website at http://www.pepcoholdings.com/investors. PHI recognizes its website as a key channel of distribution to reach public investors and as a means of disclosing material non-public information to comply with each Reporting Company’s disclosure obligations under SEC Regulation FD.
PHI discloses net income from continuing operations and related per share data (both as historical information and earnings guidance) excluding certain items (non-GAAP financial information) because management believes that these items are not representative of PHI’s ongoing business operations. Management uses this information, and believes that such information is useful to investors, in evaluating PHI’s period-over-period performance. The inclusion of this disclosure is intended to complement, and should not be considered as an alternative to, PHI’s reported net income from continuing operations and related per share data in accordance with accounting principles generally accepted in the United States (GAAP).
1
|
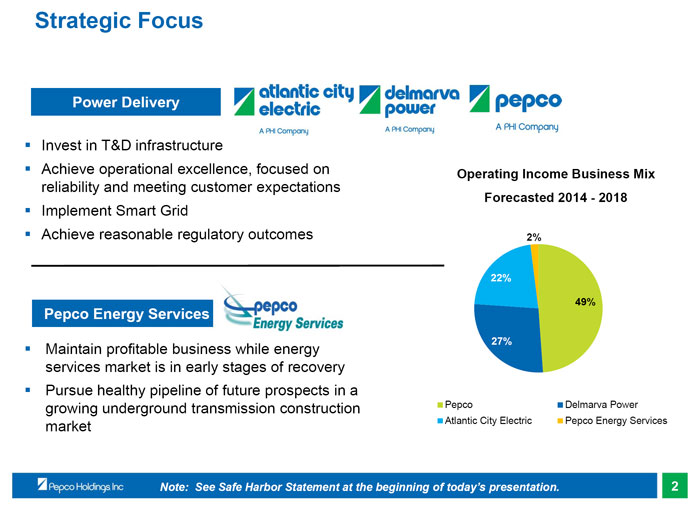 |
Strategic Focus
Power Delivery
Invest in T&D infrastructure
Achieve operational excellence, focused on reliability and meeting customer expectations
Implement Smart Grid
Achieve reasonable regulatory outcomes
Pepco Energy Services
Maintain profitable business while energy services market is in early stages of recovery
Pursue healthy pipeline of future prospects in a growing underground transmission construction market
Operating Income Business Mix Forecasted 2014 - 2018
2%
22%
49%
27%
Pepco
Atlantic City Electric
Delmarva Power Pepco Energy Services
Note: See Safe Harbor Statement at the beginning of today’s presentation.
2
|
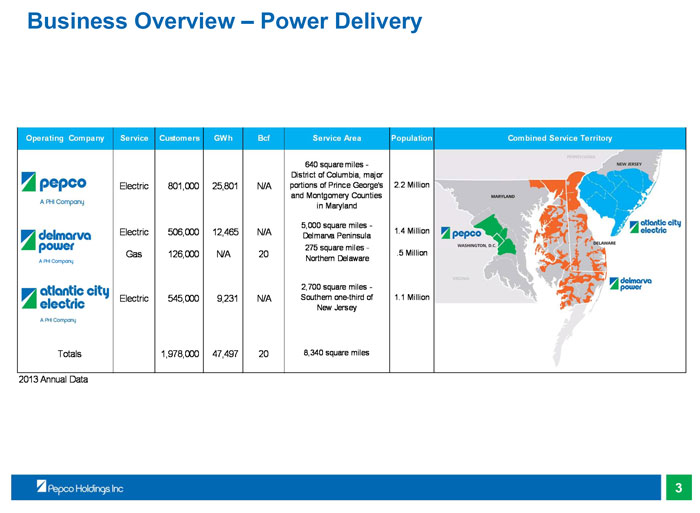 |
Business Overview – Power Delivery
Operating Company
Totals
Service
Electric
Electric
Gas
Electric
Customers
801000
506000
126000
545000
1,978,000
GWh
25,801
12,465
N/A
9,231
47,497
Bcf
N/A
N/A
20
N/A
20
Service Area
640 square miles - District of Columbia, major portions of Prince George’s and Montgomery Counties in Maryland
5,000 square miles - Delmarva Peninsula
275 square miles - Northern Delaware
2,700 square miles - Southern one-third of New Jersey
8,340 square miles
Population
2.2 Million
1.4 Million
.5 Million
1.1 Million
Combined Service Territory
2013 Annual Data
3
|
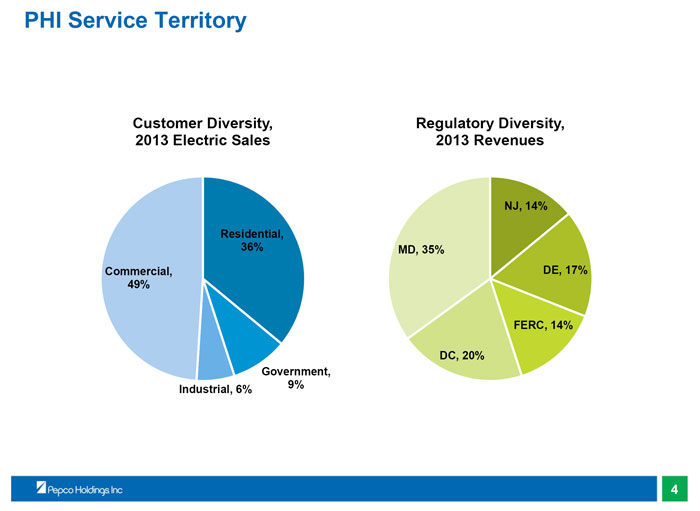 |
PHI Service Territory
Customer Diversity, 2013 Electric Sales
Residential, 36%
Commercial, 49%
Commercial 47%
Government, Industrial, 6%
9%
Regulatory Diversity, 2013 Revenues
NJ, 14%
MD, 35%
DE, 17%
FERC, 14%
DC, 20%
4
|
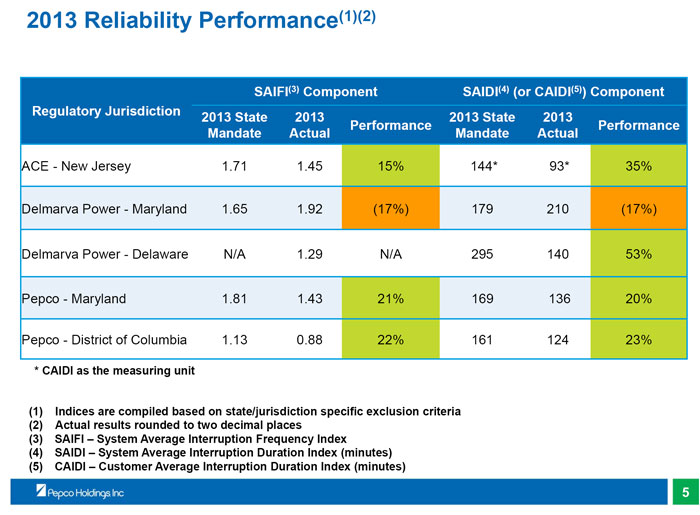 |
2013 Reliability Performance(1)(2)
SAIFI(3) Component
SAIDI(4) (or CAIDI(5)) Component Regulatory Jurisdiction
2013 State
2013
2013 State
2013 Performance
Performance Mandate
Actual
Mandate
Actual
ACE - New Jersey
1.71
1.45
15%
144*
93*
35% Delmarva Power - Maryland
1.65
1.92
(17%)
179
210
(17%) Delmarva Power - Delaware
N/A
1.29
N/A
295
140
53% Pepco - Maryland
1.81
1.43
21%
169
136
20%
Pepco - District of Columbia
1.13
0.88
22%
161
124
23%
* CAIDI as the measuring unit
(1) Indices are compiled based on state/jurisdiction specific exclusion criteria (2) Actual results rounded to two decimal places (3) SAIFI – System Average Interruption Frequency Index (4) SAIDI – System Average Interruption Duration Index (minutes) (5) CAIDI – Customer Average Interruption Duration Index (minutes)
5
|
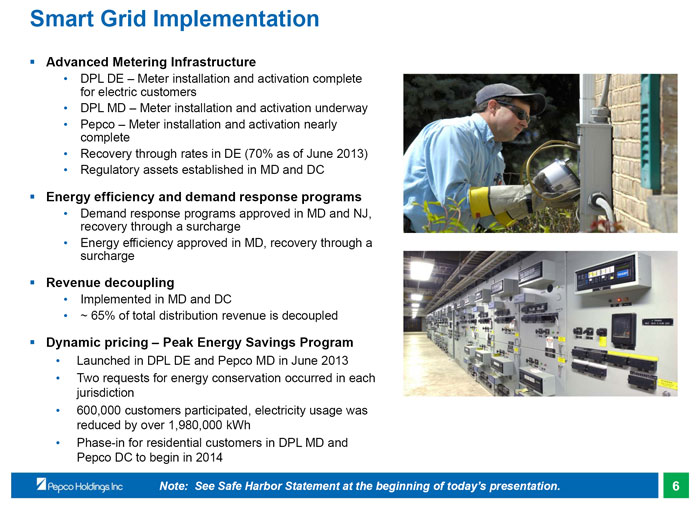 |
Smart Grid Implementation
▪ Advanced Metering Infrastructure
• DPL DE – Meter installation and activation complete for electric customers
• DPL MD – Meter installation and activation underway
• Pepco – Meter installation and activation nearly complete
• Recovery through rates in DE (70% as of June 2013)
• Regulatory assets established in MD and DC
▪ Energy efficiency and demand response programs
• Demand response programs approved in MD and NJ, recovery through a surcharge
• Energy efficiency approved in MD, recovery through a surcharge
▪ Revenue decoupling
• Implemented in MD and DC
• ~ 65% of total distribution revenue is decoupled
▪ Dynamic pricing – Peak Energy Savings Program
• Launched in DPL DE and Pepco MD in June 2013
• Two requests for energy conservation occurred in each jurisdiction
• 600,000 customers participated, electricity usage was reduced by over 1,980,000 kWh
• Phase-in for residential customers in DPL MD and Pepco DC to begin in 2014
Note: See Safe Harbor Statement at the beginning of today’s presentation.
6
|
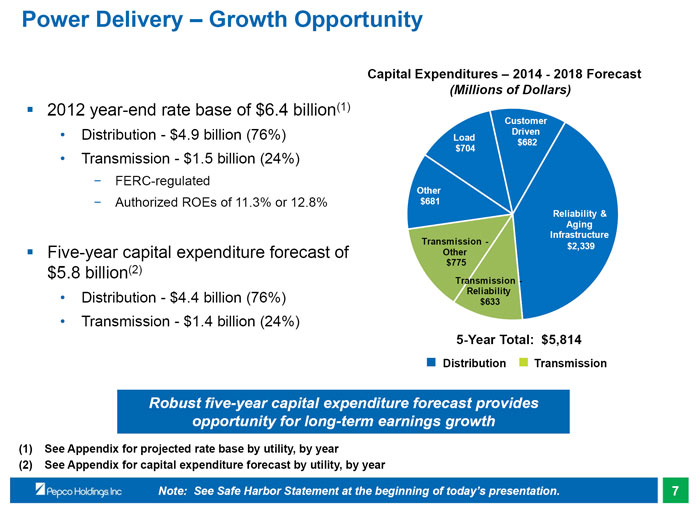 |
Power Delivery – Growth Opportunity
▪ 2012 year-end rate base of $6.4 billion(1)
• Distribution - $4.9 billion (76%)
• Transmission - $1.5 billion (24%)
– FERC-regulated
– Authorized ROEs of 11.3% or 12.8%
▪ Five-year capital expenditure forecast of $5.8 billion(2)
• Distribution - $4.4 billion (76%)
• Transmission - $1.4 billion (24%)
Capital Expenditures – 2014 - 2018 Forecast
(Millions of Dollars)
Customer Driven $682
Load $704
Other $681
Reliability & Aging Infrastructure Transmission -$2,339
Other $775 Transmission -Reliability $633
5-Year Total: $5,814
■ Distribution ■ Transmission
Robust five-year capital expenditure forecast provides opportunity for long-term earnings growth
(1) See Appendix for projected rate base by utility, by year
(2) See Appendix for capital expenditure forecast by utility, by year
Note: See Safe Harbor Statement at the beginning of today’s presentation.
7
|
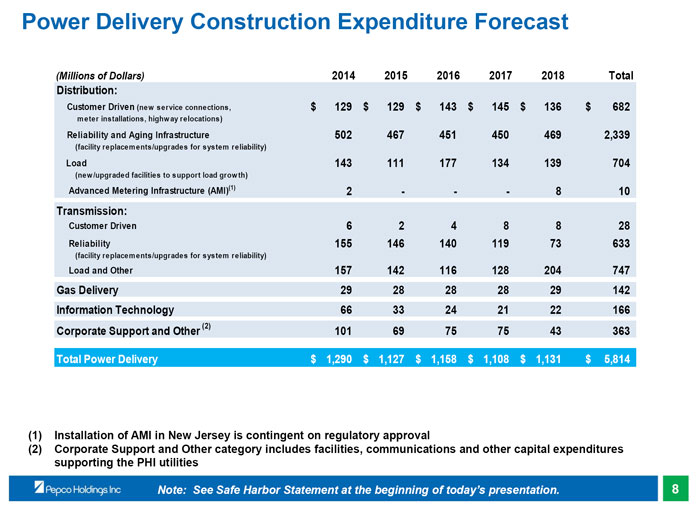 |
Power Delivery Construction Expenditure Forecast
(Millions of Dollars)
2014
2015
2016
2017
2018
Total Distribution:
Customer Driven (new service connections, meter installations, highway relocations)
$ 129 $ 129 $ 143 $ 145 $ 136 $ 682
Reliability and Aging Infrastructure
502 467 451 450 469 2,339
(facility replacements/upgrades for system reliability) Load
143 111 177 134 139 704
(new/upgraded facilities to support load growth)
Advanced Metering Infrastructure (AMI)(1)
2 - - - 8 10
Transmission:
Customer Driven
6 2 4 8 8 28
Reliability
(facility replacements/upgrades for system reliability)
155 146 140 119 73 633
Load and Other
157 142 116 128 204 747 Gas Delivery
29 28 28 28 29 142
Information Technology
66 33 24 21 22 166
Corporate Support and Other (2)
101 69 75 75 43 363
Total Power Delivery
$ 1,290 $ 1,127 $ 1,158 $ 1,108 $ 1,131 $ 5,814
(1) Installation of AMI in New Jersey is contingent on regulatory approval
(2) Corporate Support and Other category includes facilities, communications and other capital expenditures supporting the PHI utilities
Note: See Safe Harbor Statement at the beginning of today’s presentation.
8
|
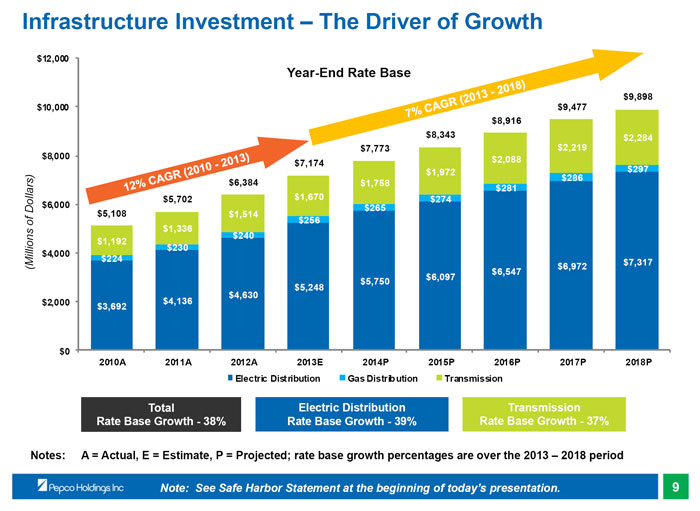 |
Infrastructure Investment – The Driver of Growth
$12,000
Year-End Rate Base
12% CAGR (2010 - 2013)
7% CAGR (2013 - 2018)
$9,898
$10,000
$9,477
$8,916
$8,343
$2,284
$7,773
$2,219
$8,000
$2,088
$7,174
$1,972
$297
$286
$6,384
$1,758
$281
$5,702
$1,670
$274
$6,000
$265
$5,108
$1,514
$256
$1,336
$240
$1,192
$230
$4,000
$224
$7,317
(Millions of Dollars)
$6,972 $6,547 $5,750
$6,097 $5,248 $4,630 $2,000
$4,136 $3,692
$0
2010A
2011A
2012A
2013E
2014P
2015P
2016P
2017P
2018P
Electric Distribution
Gas Distribution
Transmission
Total
Electric Distribution
Transmission Rate Base Growth - 38%
Rate Base Growth - 39%
Rate Base Growth - 37%
Notes: A = Actual, E = Estimate, P = Projected; rate base growth percentages are over the 2013 – 2018 period
Note: See Safe Harbor Statement at the beginning of today’s presentation.
9
|
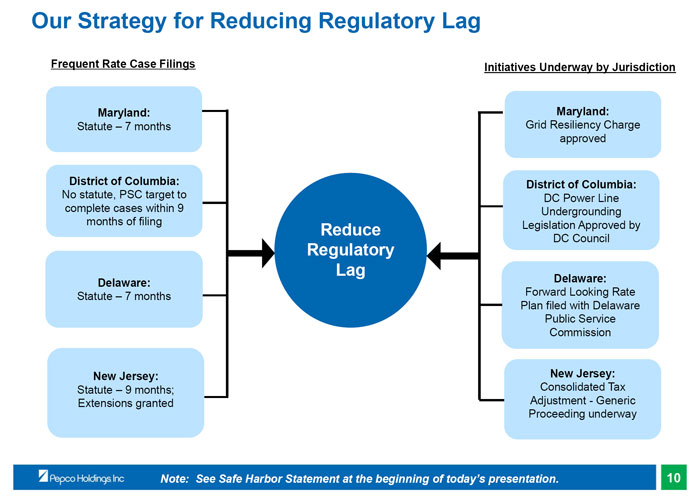 |
Our Strategy for Reducing Regulatory Lag
Frequent Rate Case Filings
Initiatives Underway by Jurisdiction
Maryland:
Maryland:
Statute – 7 months
Grid Resiliency Charge approved
District of Columbia:
District of Columbia:
No statute, PSC target to
DC Power Line complete cases within 9
Undergrounding months of filing
Legislation Approved by
Reduce
DC Council
Regulatory Lag
Delaware:
Delaware:
Statute – 7 months
Forward Looking Rate Plan filed with Delaware Public Service Commission
New Jersey:
New Jersey:
Statute – 9 months;
Consolidated Tax Extensions granted
Adjustment - Generic Proceeding underway
Note: See Safe Harbor Statement at the beginning of today’s presentation.
10
|
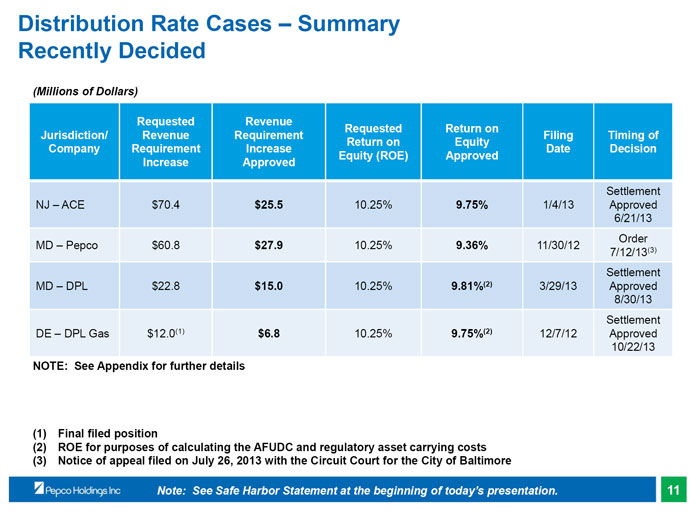 |
Distribution Rate Cases – Summary Recently Decided
(Millions of Dollars)
Requested
Revenue
Requested
Return on
Jurisdiction/
Revenue
Requirement
Filing
Timing of Return on
Equity Company
Requirement
Increase
Date
Decision Equity (ROE)
Approved Increase
Approved
Settlement NJ – ACE
$70.4
$25.5
10.25%
9.75%
1/4/13
Approved 6/21/13 Order MD – Pepco
$60.8
$27.9
10.25%
9.36%
11/30/12 7/12/13(3) Settlement MD – DPL
$22.8
$15.0
10.25%
9.81%(2)
3/29/13
Approved 8/30/13 Settlement DE – DPL Gas
$12.0(1)
$6.8
10.25%
9.75%(2)
12/7/12
Approved 10/22/13
NOTE: See Appendix for further details
(1) Final filed position
(2) ROE for purposes of calculating the AFUDC and regulatory asset carrying costs (3) Notice of appeal filed on July 26, 2013 with the Circuit Court for the City of Baltimore
Note: See Safe Harbor Statement at the beginning of today’s presentation.
11
|
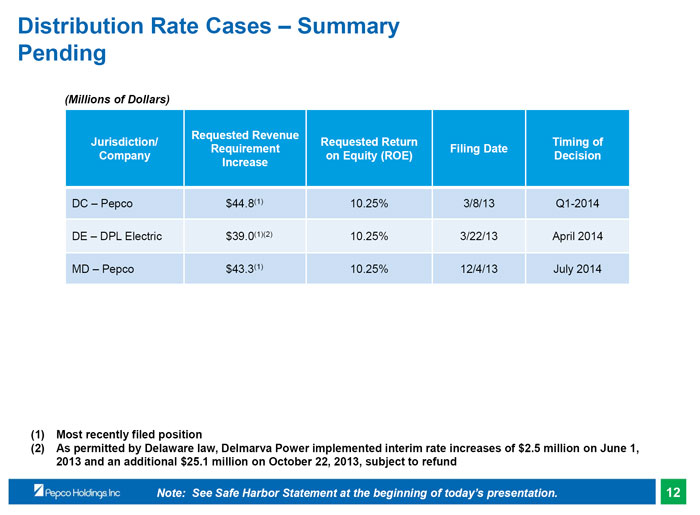 |
Distribution Rate Cases – Summary Pending
(Millions of Dollars)
Requested Revenue
Jurisdiction/
Requested Return
Timing of Requirement
Filing Date Company
on Equity (ROE)
Decision Increase
DC – Pepco
$44.8(1)
10.25%
3/8/13
Q1-2014 DE – DPL Electric
$39.0(1)(2)
10.25%
3/22/13
April 2014 MD – Pepco
$43.3(1)
10.25%
12/4/13
July 2014
(1) Most recently filed position
(2) As permitted by Delaware law, Delmarva Power implemented interim rate increases of $2.5 million on June 1, 2013 and an additional $25.1 million on October 22, 2013, subject to refund
Note: See Safe Harbor Statement at the beginning of today’s presentation.
12
|
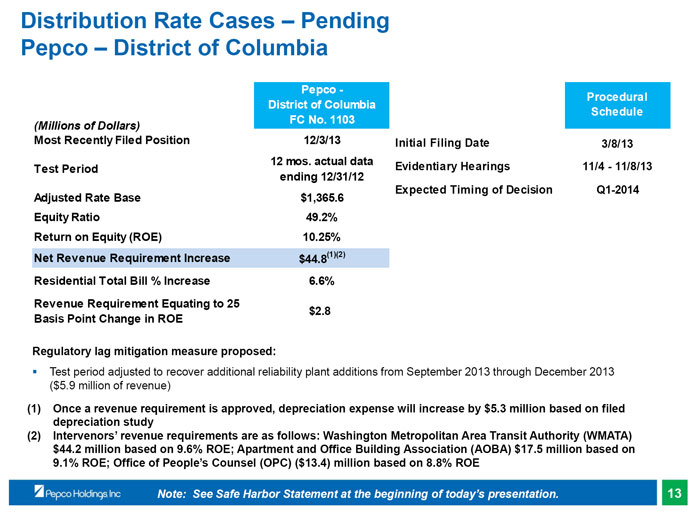 |
Distribution Rate Cases – Pending Pepco – District of Columbia Pepco – Procedural District of Columbia Schedule FC No. 1103
(Millions of Dollars)
Most Recently Filed Position
12/3/13
Initial Filing Date
3/8/13 12 mos. actual data Evidentiary Hearings
11/4 - 11/8/13 Test Period ending 12/31/12 Expected Timing of Decision
Q1-2014 Adjusted Rate Base
$1,365.6 Equity Ratio
49.2% Return on Equity (ROE)
10.25% Net Revenue Requirement Increase
$44.8(1)(2) Residential Total Bill % Increase
6.6% Revenue Requirement Equating to 25 $2.8 Basis Point Change in ROE
Regulatory lag mitigation measure proposed:
Test period adjusted to recover additional reliability plant additions from September 2013 through December 2013 ($5.9 million of revenue)
(1) Once a revenue requirement is approved, depreciation expense will increase by $5.3 million based on filed depreciation study (2) Intervenors’ revenue requirements are as follows: Washington Metropolitan Area Transit Authority (WMATA) $44.2 million based on 9.6% ROE; Apartment and Office Building Association (AOBA) $17.5 million based on 9.1% ROE; Office of People’s Counsel (OPC) ($13.4) million based on 8.8% ROE
Note: See Safe Harbor Statement at the beginning of today’s presentation.
13
|
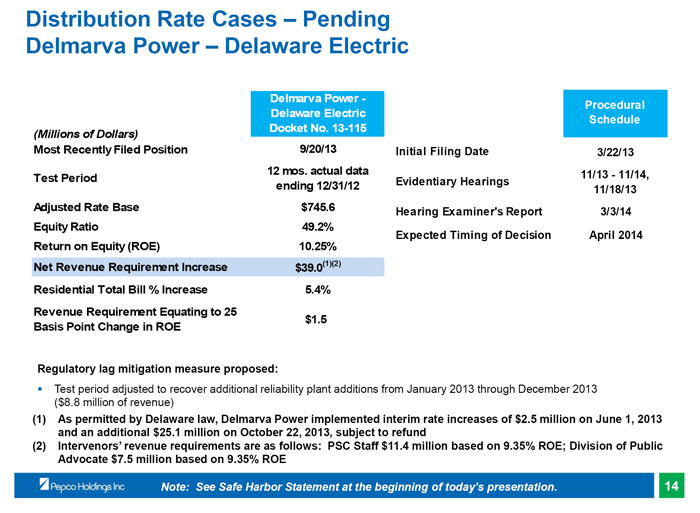 |
Distribution Rate Cases – Pending Delmarva Power – Delaware Electric
Delmarva Power – Procedural Delaware Electric Schedule Docket No. 13-115
(Millions of Dollars)
Most Recently Filed Position
9/20/13
Initial Filing Date
3/22/13 12 mos. actual data
11/13 - 11/14, Test Period
Evidentiary Hearings ending 12/31/12
11/18/13 Adjusted Rate Base
$745.6
Hearing Examiner’s Report
3/3/14 Equity Ratio
49.2% Expected Timing of Decision
April 2014 Return on Equity (ROE)
10.25% Net Revenue Requirement Increase
$39.0(1)(2) Residential Total Bill % Increase
5.4% Revenue Requirement Equating to 25 $1.5 Basis Point Change in ROE
Regulatory lag mitigation measure proposed:
Test period adjusted to recover additional reliability plant additions from January 2013 through December 2013 ($8.8 million of revenue)
(1) As permitted by Delaware law, Delmarva Power implemented interim rate increases of $2.5 million on June 1, 2013 and an additional $25.1 million on October 22, 2013, subject to refund (2) Intervenors’ revenue requirements are as follows: PSC Staff $11.4 million based on 9.35% ROE; Division of Public Advocate $7.5 million based on 9.35% ROE
Note: See Safe Harbor Statement at the beginning of today’s presentation.
14
|
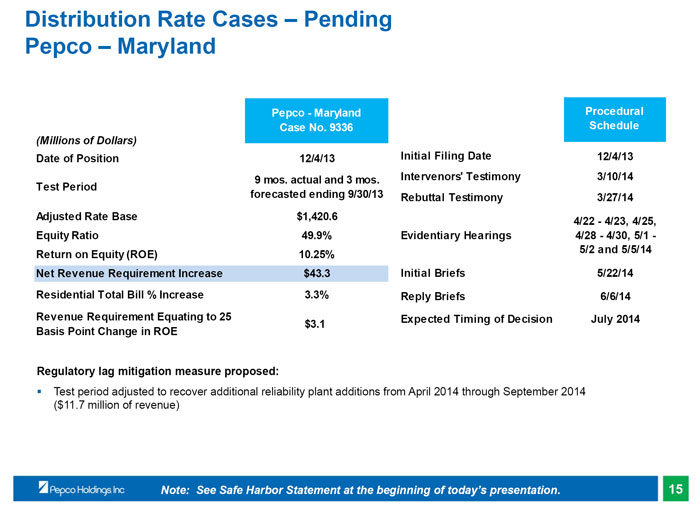 |
Distribution Rate Cases – Pending Pepco – Maryland
Pepco – Maryland
Procedural Case No. 9336
Schedule
(Millions of Dollars)
Date of Position
12/4/13
Initial Filing Date
12/4/13 9 mos. actual and 3 mos. Intervenors’ Testimony
3/10/14
Test Period forecasted ending 9/30/13 Rebuttal Testimony
3/27/14 Adjusted Rate Base
$1,420.6
4/22 - 4/23, 4/25,
Equity Ratio
49.9%
Evidentiary Hearings
4/28 - 4/30, 5/1 -
Return on Equity (ROE)
10.25%
5/2 and 5/5/14 Net Revenue Requirement Increase
$43.3
Initial Briefs
5/22/14 Residential Total Bill % Increase
3.3%
Reply Briefs
6/6/14
Revenue Requirement Equating to 25
Expected Timing of Decision
July 2014 $3.1 Basis Point Change in ROE
Regulatory lag mitigation measure proposed:
Test period adjusted to recover additional reliability plant additions from April 2014 through September 2014 ($11.7 million of revenue)
Note: See Safe Harbor Statement at the beginning of today’s presentation.
15
|
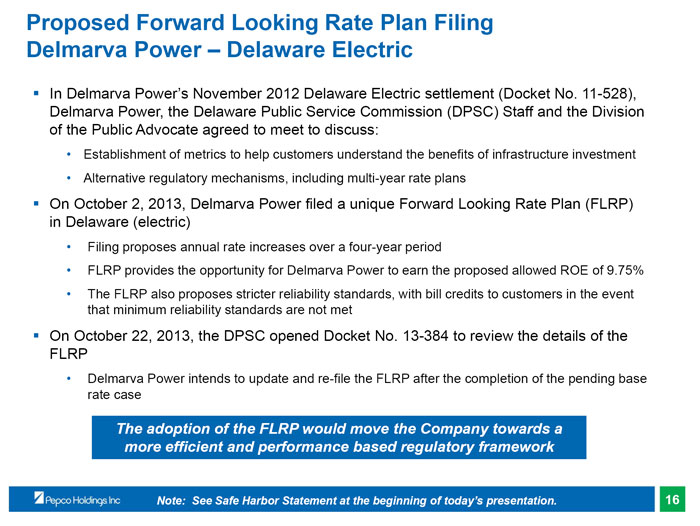 |
Proposed Forward Looking Rate Plan Filing Delmarva Power – Delaware Electric
▪ In Delmarva Power’s November 2012 Delaware Electric settlement (Docket No. 11-528), Delmarva Power, the Delaware Public Service Commission (DPSC) Staff and the Division of the Public Advocate agreed to meet to discuss:
• Establishment of metrics to help customers understand the benefits of infrastructure investment
• Alternative regulatory mechanisms, including multi-year rate plans
On October 2, 2013, Delmarva Power filed a unique Forward Looking Rate Plan (FLRP) in Delaware (electric)
• Filing proposes annual rate increases over a four-year period
• FLRP provides the opportunity for Delmarva Power to earn the proposed allowed ROE of 9.75%
• The FLRP also proposes stricter reliability standards, with bill credits to customers in the event that minimum reliability standards are not met
On October 22, 2013, the DPSC opened Docket No. 13-384 to review the details of the FLRP
• Delmarva Power intends to update and re-file the FLRP after the completion of the pending base rate case
The adoption of the FLRP would move the Company towards a more efficient and performance based regulatory framework
Note: See Safe Harbor Statement at the beginning of today’s presentation.
16
|
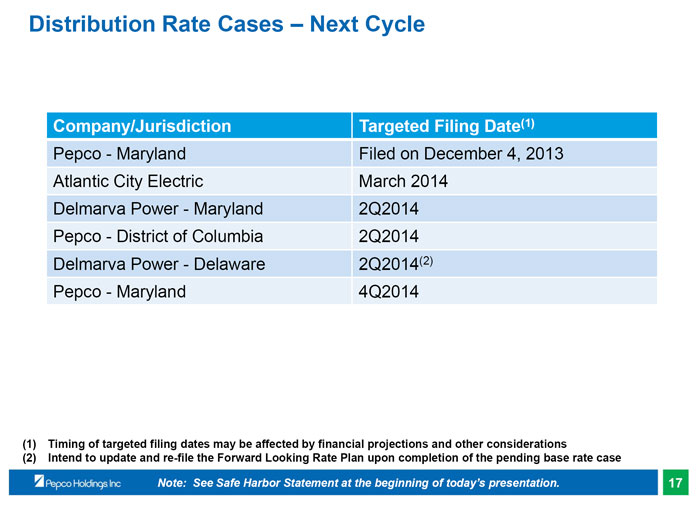 |
Distribution Rate Cases – Next Cycle
Company/Jurisdiction
Targeted Filing Date(1)
Pepco - Maryland
Filed on December 4, 2013
Atlantic City Electric
March 2014 Delmarva
Power - Maryland
2Q2014 Pepco - District of Columbia
2Q2014 Delmarva Power - Delaware
2Q2014(2) Pepco - Maryland
4Q2014
(1) Timing of targeted filing dates may be affected by financial projections and other considerations
(2) Intend to update and re-file the Forward Looking Rate Plan upon completion of the pending base rate case
Note: See Safe Harbor Statement at the beginning of today’s presentation.
17
|
 |
Pepco Undergrounding Status – District of Columbia
▪ On February 4, 2014, the Council of the District of Columbia approved the $1 billion undergrounding legislation initially recommended by the District of Columbia’s Power Line Undergrounding Task Force
▪ The legislation is expected to become law early in the second quarter of 2014 following a 30-day Congressional review period
▪ Once the legislation becomes law, Pepco will submit a financing plan and a construction plan, including surcharge cost recovery, to the Public Service Commission; approval expected fourth quarter of 2014
▪ The program will underground up to 60 high voltage distribution feeder lines over a seven to ten year period in areas most impacted by storms and overhead related outages
▪ Funding will be split 50/50 between Pepco and the District of Columbia
▪ Pepco’s cost recovery will be through a customer surcharge until the assets are moved to rate base
Note: See Safe Harbor Statement at the beginning of today’s presentation.
18
|
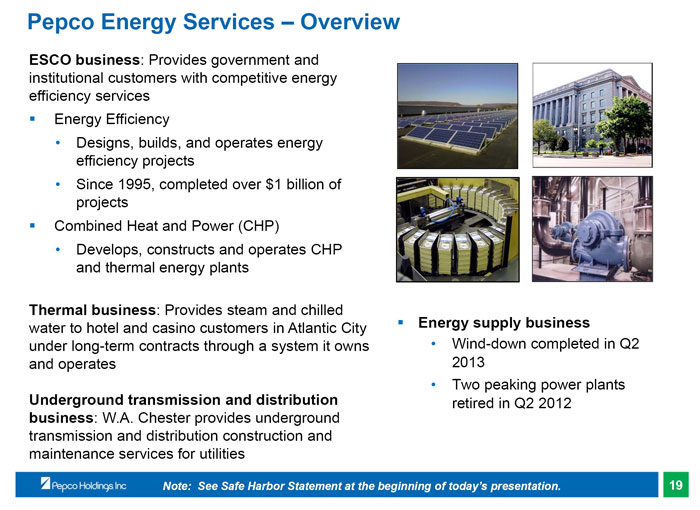 |
Pepco Energy Services – Overview
ESCO business: Provides government and institutional customers with competitive energy efficiency services
▪ Energy Efficiency
• Designs, builds, and operates energy efficiency projects
• Since 1995, completed over $1 billion of projects
▪ Combined Heat and Power (CHP)
• Develops, constructs and operates CHP and thermal energy plants
Thermal business: Provides steam and chilled water to hotel and casino customers in Atlantic City under long-term contracts through a system it owns and operates
Underground transmission and distribution business: W.A. Chester provides underground transmission and distribution construction and maintenance services for utilities
▪ Energy supply business
• Wind-down completed in Q2 2013
• Two peaking power plants retired in Q2 2012
Note: See Safe Harbor Statement at the beginning of today’s presentation.
19
|
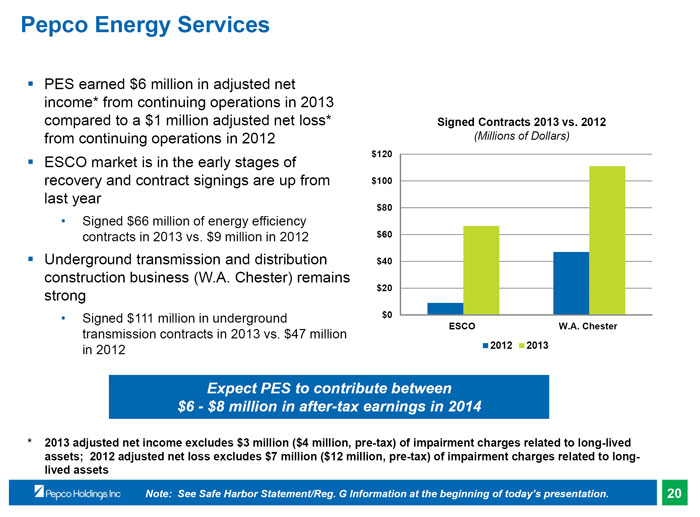 |
Pepco Energy Services
▪ PES earned $6 million in adjusted net income* from continuing operations in 2013 compared to a $1 million adjusted net loss* from continuing operations in 2012
▪ ESCO market is in the early stages of recovery and contract signings are up from last year
• Signed $66 million of energy efficiency contracts in 2013 vs. $9 million in 2012
▪ Underground transmission and distribution construction business (W.A. Chester) remains strong
• Signed $111 million in underground transmission contracts in 2013 vs. $47 million in 2012
Signed Contracts 2013 vs. 2012
(Millions of Dollars) $120
$100 $80 $60 $40 $20
$0
ESCO
W.A. Chester
2012 2013
Expect PES to contribute between $6 - $8 million in after-tax earnings in 2014
* 2013 adjusted net income excludes $3 million ($4 million, pre-tax) of impairment charges related to long-lived assets; 2012 adjusted net loss excludes $7 million ($12 million, pre-tax) of impairment charges related to long-lived assets
Note: See Safe Harbor Statement/Reg. G Information at the beginning of today’s presentation.
20
|
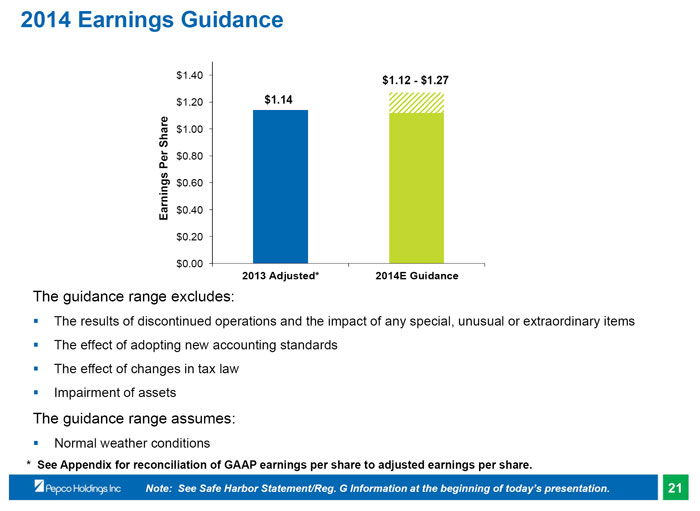 |
2014 Earnings Guidance $1.40
$1.12 - $1.27 $1.20
$1.14
$1.00
$0.80
$0.60
Earnings Per Share $0.40 $0.20
$0.00
2013 Adjusted*
2014E Guidance
The guidance range excludes:
▪ The results of discontinued operations and the impact of any special, unusual or extraordinary items
▪ The effect of adopting new accounting standards
▪ The effect of changes in tax law
▪ Impairment of assets
The guidance range assumes:
▪ Normal weather conditions
* See Appendix for reconciliation of GAAP earnings per share to adjusted earnings per share.
Note: See Safe Harbor Statement/Reg. G Information at the beginning of today’s presentation.
21
|
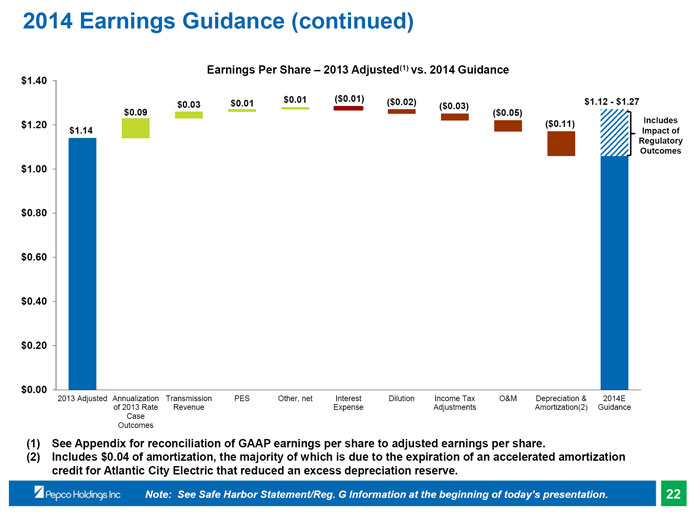 |
2014 Earnings Guidance (continued)
Earnings Per Share – 2013 Adjusted(1) vs. 2014 Guidance $1.40 $0.01
($0.01)
($0.02)
$1.12 - $1.27 $0.03
$0.01
($0.03) $0.09
($0.05) $1.20
($0.11)
Includes $1.14
Impact of Regulatory Outcomes $1.00
$0.80 $0.60 $0.40 $0.20
$0.00
2013 Adjusted Annualization Transmission
PES
Other, net
Interest
Dilution
Income Tax
O&M
Depreciation & 2014E of 2013 Rate Revenue
Expense
Adjustments
Amortization(2) Guidance Case Outcomes
(1) See Appendix for reconciliation of GAAP earnings per share to adjusted earnings per share.
(2) Includes $0.04 of amortization, the majority of which is due to the expiration of an accelerated amortization credit for Atlantic City Electric that reduced an excess depreciation reserve.
Note: See Safe Harbor Statement/Reg. G Information at the beginning of today’s presentation.
22
|
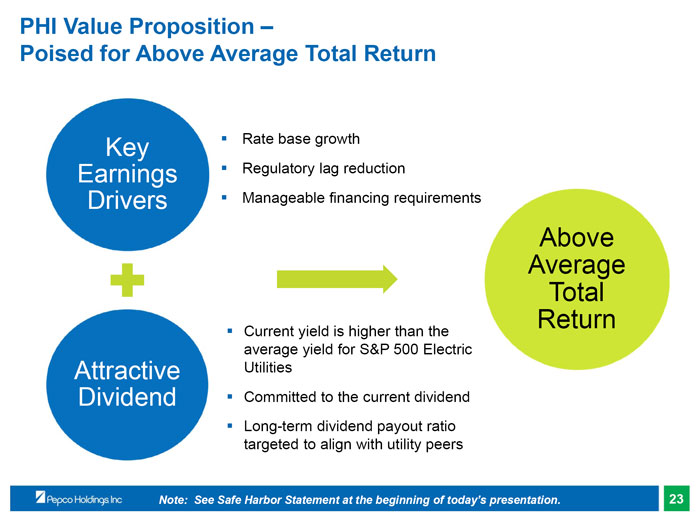 |
PHI Value Proposition –
Poised for Above Average Total Return
Key
▪ Rate base growth Earnings
▪ Regulatory lag reduction
▪ Drivers
Manageable financing requirements
Above Average Total Return
▪ Current yield is higher than the average yield for S&P 500 Electric
Attractive
Utilities
Dividend
▪ Committed to the current dividend
▪ Long-term dividend payout ratio targeted to align with utility peers
Note: See Safe Harbor Statement at the beginning of today’s presentation.
23
|
 |
Appendix
|
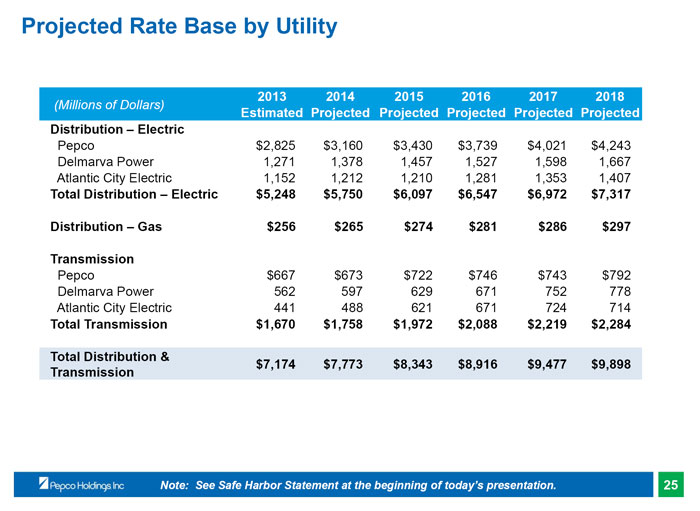 |
Projected Rate Base by Utility
(Millions of Dollars)
2013 Estimated 2014 Projected 2015 Projected 2016 Projected 2017 Projected 2018 Projected Distribution – Electric
Pepco
$2,825
$3,160
$3,430
$3,739
$4,021
$4,243 Delmarva Power
1,271
1,378
1,457
1,527
1,598
1,667 Atlantic City Electric
1,152
1,212
1,210
1,281
1,353
1,407
Total Distribution – Electric
$5,248
$5,750
$6,097
$6,547
$6,972
$7,317
Distribution – Gas
$256
$265
$274
$281
$286
$297
Transmission
Pepco
$667
$673
$722
$746
$743
$792 Delmarva Power
562
597
629
671
752
778 Atlantic City Electric
441
488
621
671
724
714
Total Transmission
$1,670
$1,758
$1,972
$2,088
$2,219
$2,284
Total Distribution & $7,174
$7,773
$8,343
$8,916
$9,477
$9,898 Transmission
Note: See Safe Harbor Statement at the beginning of today’s presentation.
25
|
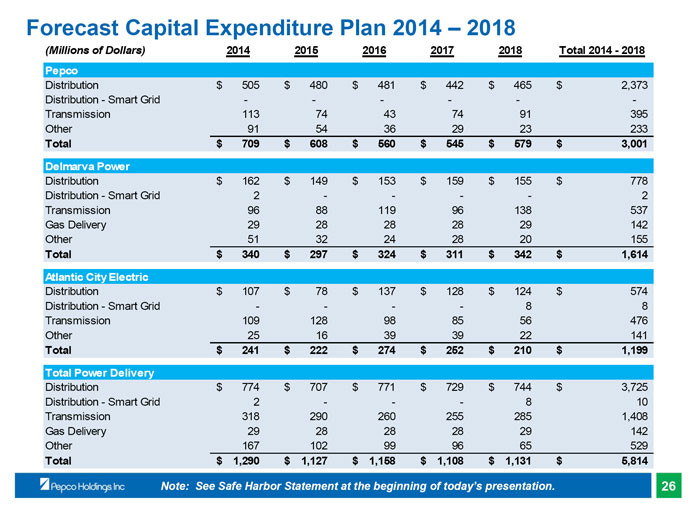 |
Forecast Capital Expenditure Plan 2014 – 2018
(Millions of Dollars)
2014
2015
2016
2017
2018
Total 2014 - 2018 Pepco
Distribution
$ 505
$ 480
$ 481
$ 442
$ 465
$ 2,373 Distribution - Smart Grid
-
-
-
-
-
-Transmission
113
74
43
74
91
395 Other
91
54
36
29
23
233
Total
$ 709
$ 608
$ 560
$ 545
$ 579
$ 3,001
Delmarva Power
Distribution
$ 162
$ 149
$ 153
$ 159
$ 155
$ 778 Distribution - Smart Grid
2
-
-
-
-
2 Transmission
96
88
119
96
138
537 Gas Delivery
29
28
28
28
29
142 Other
51
32
24
28
20
155
Total
$ 340
$ 297
$ 324
$ 311
$ 342
$ 1,614
Atlantic City Electric
Distribution
$ 107
$ 78
$ 137
$ 128
$ 124
$ 574 Distribution - Smart Grid
-
-
-
-
8
8 Transmission
109
128
98
85
56
476 Other
25
16
39
39
22
141
Total
$ 241
$ 222
$ 274
$ 252
$ 210
$ 1,199
Total Power Delivery
Distribution
$ 774
$ 707
$ 771
$ 729
$ 744
$ 3,725 Distribution - Smart Grid
2
-
-
-
8
10 Transmission
318
290
260
255
285
1,408 Gas Delivery
29
28
28
28
29
142 Other
167
102
99
96
65
529
Total
$ 1,290
$ 1,127
$ 1,158
$ 1,108
$ 1,131
$ 5,814
Note: See Safe Harbor Statement at the beginning of today’s presentation.
26
|
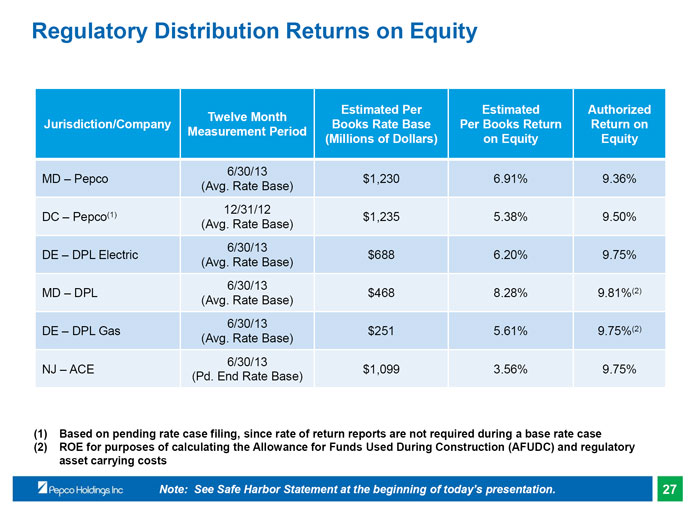 |
Regulatory Distribution Returns on Equity
Estimated Per
Estimated
Authorized Twelve Month Jurisdiction/Company
Books Rate Base
Per Books Return
Return on Measurement Period (Millions of Dollars)
on Equity
Equity
6/30/13
MD – Pepco
$1,230
6.91%
9.36% (Avg. Rate Base) 12/31/12 DC – Pepco(1)
$1,235
5.38%
9.50% (Avg. Rate Base) 6/30/13 DE – DPL Electric
$688
6.20%
9.75% (Avg. Rate Base) 6/30/13 MD – DPL
$468
8.28%
9.81%(2) (Avg. Rate Base) 6/30/13 DE – DPL Gas
$251
5.61%
9.75%(2) (Avg. Rate Base) 6/30/13 NJ – ACE
$1,099
3.56%
9.75% (Pd. End Rate Base)
(1) Based on pending rate case filing, since rate of return reports are not required during a base rate case (2) ROE for purposes of calculating the Allowance for Funds Used During Construction (AFUDC) and regulatory asset carrying costs
Note: See Safe Harbor Statement at the beginning of today’s presentation.
27
|
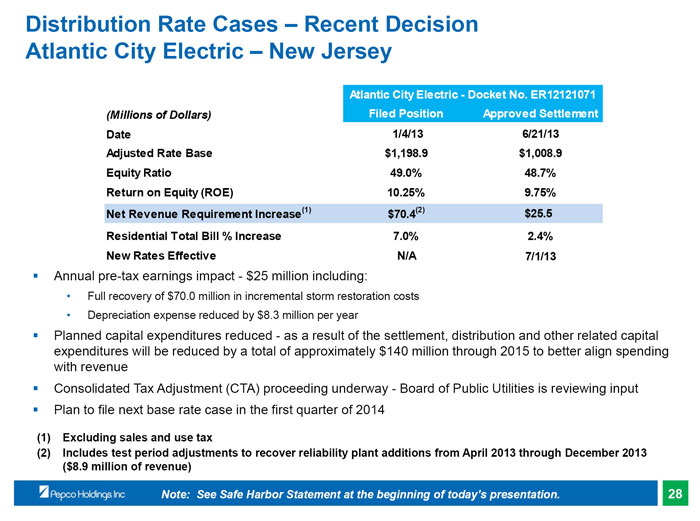 |
Distribution Rate Cases – Recent Decision Atlantic City Electric – New Jersey
Atlantic City Electric - Docket No. ER12121071 (Millions of Dollars)
Filed Position
Approved Settlement Date
1/4/13
6/21/13 Adjusted Rate Base
$1,198.9
$1,008.9 Equity Ratio
49.0%
48.7% Return on Equity (ROE)
10.25%
9.75% Net Revenue Requirement Increase(1)
$70.4(2)
$25.5 Residential Total Bill % Increase
7.0%
2.4% New Rates Effective
N/A
7/1/13
▪ Annual pre-tax earnings impact - $25 million including:
• Full recovery of $70.0 million in incremental storm restoration costs
• Depreciation expense reduced by $8.3 million per year
▪ Planned capital expenditures reduced - as a result of the settlement, distribution and other related capital expenditures will be reduced by a total of approximately $140 million through 2015 to better align spending with revenue
▪ Consolidated Tax Adjustment (CTA) proceeding underway - Board of Public Utilities is reviewing input
▪ Plan to file next base rate case in the first quarter of 2014
(1) Excluding sales and use tax
(2) Includes test period adjustments to recover reliability plant additions from April 2013 through December 2013 ($8.9 million of revenue)
Note: See Safe Harbor Statement at the beginning of today’s presentation.
28
|
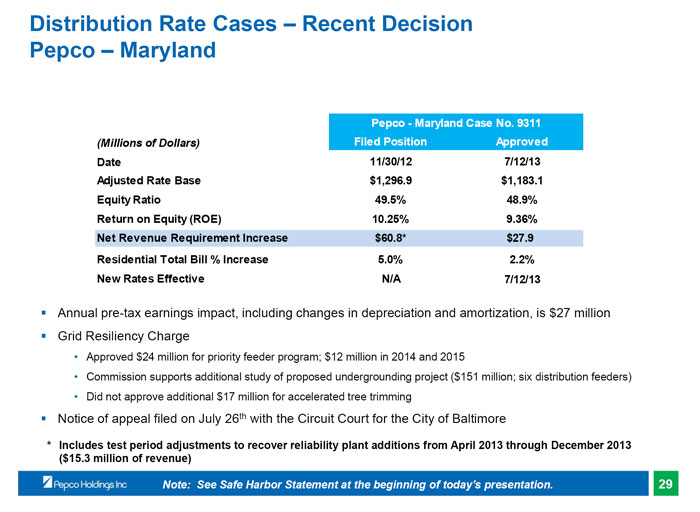 |
Distribution Rate Cases – Recent Decision Pepco – Maryland
Pepco - Maryland Case No. 9311 (Millions of Dollars)
Filed Position
Approved Date
11/30/12
7/12/13 Adjusted Rate Base
$1,296.9
$1,183.1 Equity Ratio
49.5%
48.9% Return on Equity (ROE)
10.25%
9.36% Net Revenue Requirement Increase
$60.8*
$27.9 Residential Total Bill % Increase
5.0%
2.2% New Rates Effective
N/A
7/12/13
▪ Annual pre-tax earnings impact, including changes in depreciation and amortization, is $27 million
▪ Grid Resiliency Charge
• Approved $24 million for priority feeder program; $12 million in 2014 and 2015
• Commission supports additional study of proposed undergrounding project ($151 million; six distribution feeders)
• Did not approve additional $17 million for accelerated tree trimming
▪ Notice of appeal filed on July 26th with the Circuit Court for the City of Baltimore
* Includes test period adjustments to recover reliability plant additions from April 2013 through December 2013 ($15.3 million of revenue)
Note: See Safe Harbor Statement at the beginning of today’s presentation.
29
|
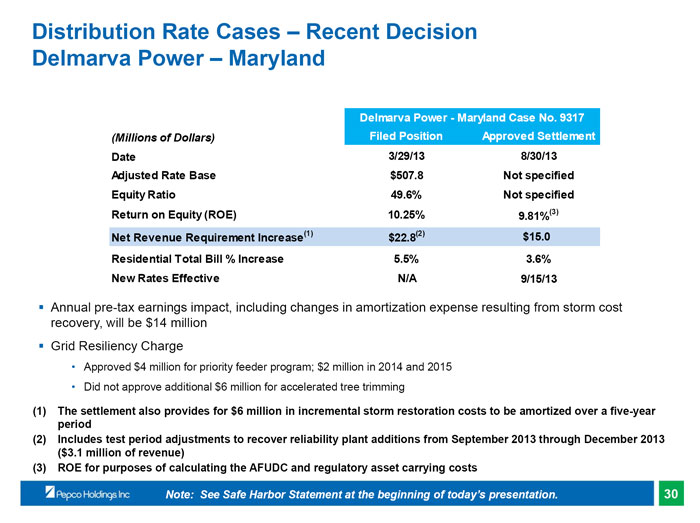 |
Distribution Rate Cases – Recent Decision Delmarva Power – Maryland
Delmarva Power - Maryland Case No. 9317 (Millions of Dollars)
Filed Position
Approved Settlement Date
3/29/13
8/30/13 Adjusted Rate Base
$507.8
Not specified Equity Ratio
49.6%
Not specified Return on Equity (ROE)
10.25%
9.81%(3) Net Revenue Requirement Increase(1)
$22.8(2)
$15.0 Residential Total Bill % Increase
5.5%
3.6% New Rates Effective
N/A
9/15/13
▪ Annual pre-tax earnings impact, including changes in amortization expense resulting from storm cost recovery, will be $14 million
▪ Grid Resiliency Charge
• Approved $4 million for priority feeder program; $2 million in 2014 and 2015
• Did not approve additional $6 million for accelerated tree trimming
(1) The settlement also provides for $6 million in incremental storm restoration costs to be amortized over a five-year period (2) Includes test period adjustments to recover reliability plant additions from September 2013 through December 2013 ($3.1 million of revenue) (3) ROE for purposes of calculating the AFUDC and regulatory asset carrying costs
Note: See Safe Harbor Statement at the beginning of today’s presentation.
30
|
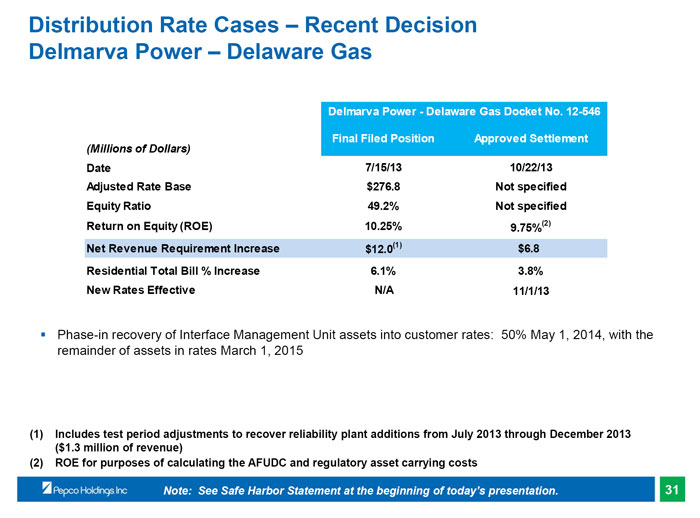 |
Distribution Rate Cases – Recent Decision Delmarva Power – Delaware Gas
Delmarva Power - Delaware Gas Docket No. 12-546
Final Filed Position
Approved Settlement
(Millions of Dollars)
Date
7/15/13
10/22/13 Adjusted Rate Base
$276.8
Not specified Equity Ratio
49.2%
Not specified Return on Equity (ROE)
10.25%
9.75%(2) Net Revenue Requirement Increase
$12.0(1)
$6.8 Residential Total Bill % Increase
6.1%
3.8% New Rates Effective
N/A
11/1/13
▪ Phase-in recovery of Interface Management Unit assets into customer rates: 50% May 1, 2014, with the remainder of assets in rates March 1, 2015
(1) Includes test period adjustments to recover reliability plant additions from July 2013 through December 2013 ($1.3 million of revenue) (2) ROE for purposes of calculating the AFUDC and regulatory asset carrying costs
Note: See Safe Harbor Statement at the beginning of today’s presentation.
31
|
 |
FERC Filing Challenging Our Transmission Rates
▪ On February 27, 2013, the public service commissions and public advocates in all four of our jurisdictions made a Section 206 filing with FERC challenging the transmission rates of each of our three utilities
▪ Two primary issues were included in the filing:
• Request to reduce the base ROE to 8.7% based on a zone of reasonableness between 6.78% and 10.33%
• Request to modify the formula rate protocols in order to require additional data and identification and justification of costs
▪ The impact of a 100 basis-point change in the transmission ROE is approximately $7 million in after-tax earnings
▪ On April 3, 2013, we filed a response to the complaint requesting that FERC dismiss the complaint on the grounds that it failed to meet the required burden to demonstrate that the existing rates and protocols are unjust and unreasonable
▪ Complaint is pending FERC review
Note: See Safe Harbor Statement at the beginning of today’s presentation.
32
|
 |
MAPP Abandoned Cost Recovery
▪ On February 28, 2013, FERC issued an order concluding that the MAPP project was canceled for reasons beyond the Company’s control and granted recovery of prudently incurred costs
▪ Key elements of the Order:
• Established a hearing to review the prudence of the $87.5 million abandonment costs and the requested 5 year amortization period
• Disallowed the incentive and RTO membership adders, which reduce the project’s ROE from 12.8% to 10.8%
• Denied 50% recovery of the $4 million of costs incurred prior to November 1, 2008 (the date of the MAPP incentive order)
▪ On December 18, 2013, all parties involved in the proceeding filed a “black box” settlement agreement with FERC that would resolve all pending issues, including rehearing issues
• The settlement provides for recovery amount of $80.5 million over 3 years
• PHI retains title to real property assets
Note: See Safe Harbor Statement at the beginning of today’s presentation.
33
|
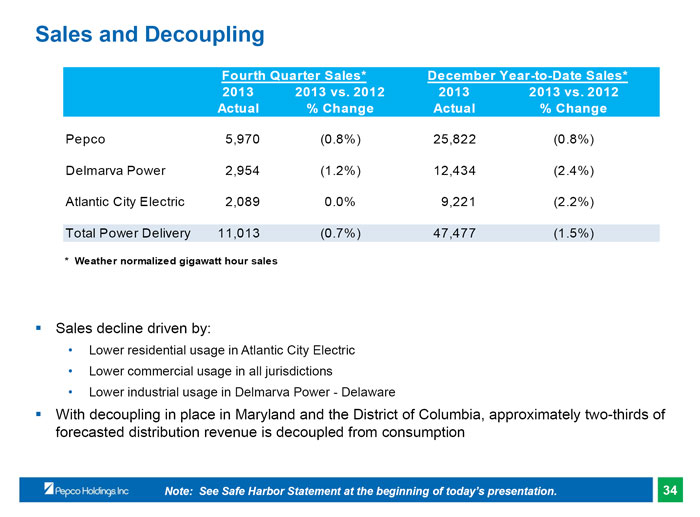 |
Sales and Decoupling
Fourth Quarter Sales*
December Year-to-Date Sales* 2013
2013 vs. 2012
2013
2013 vs. 2012 Actual
% Change
Actual
% Change
Pepco
5,970
(0.8%)
25,822
(0.8%) Delmarva Power
2,954
(1.2%)
12,434
(2.4%) Atlantic City Electric
2,089
0.0%
9,221
(2.2%) Total Power Delivery
11,013
(0.7%)
47,477
(1.5%)
* Weather normalized gigawatt hour sales
▪ Sales decline driven by:
• Lower residential usage in Atlantic City Electric
• Lower commercial usage in all jurisdictions
• Lower industrial usage in Delmarva Power - Delaware
▪ With decoupling in place in Maryland and the District of Columbia, approximately two-thirds of forecasted distribution revenue is decoupled from consumption
Note: See Safe Harbor Statement at the beginning of today’s presentation.
34
|
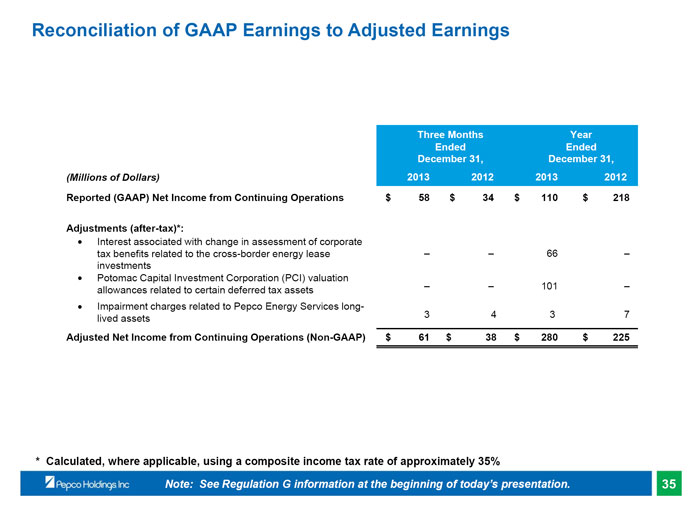 |
Reconciliation of GAAP Earnings to Adjusted Earnings
Three Months
Year Ended
Ended December 31,
December 31,
(Millions of Dollars)
2013
2012
2013
2012 Reported (GAAP) Net Income from Continuing Operations
$
58
$
34
$
110
$
218
Adjustments (after-tax)*:
• Interest associated with change in assessment of corporate tax benefits related to the cross-border energy lease
–
–
66
–investments
• Potomac Capital Investment Corporation (PCI) valuation allowances related to certain deferred tax assets
–
–
101
–
• Impairment charges related to Pepco Energy Services long-lived assets
3
4
3
7
Adjusted Net Income from Continuing Operations (Non-GAAP)
$
61 $
38 $
280
$
225
* Calculated, where applicable, using a composite income tax rate of approximately 35%
Note: See Regulation G information at the beginning of today’s presentation.
35
|
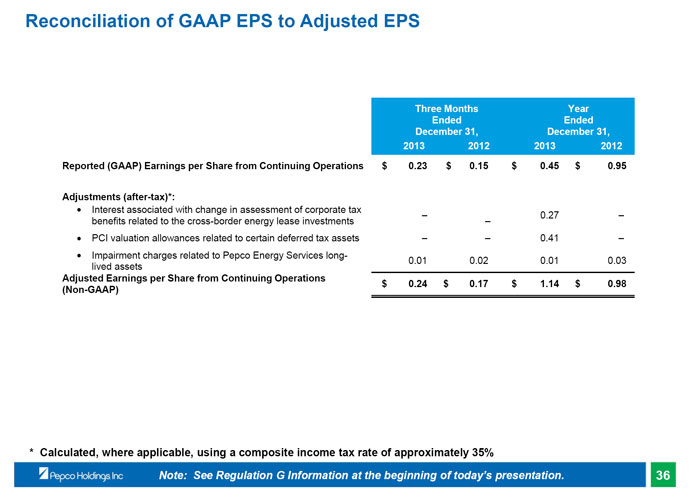 |
Reconciliation of GAAP EPS to Adjusted EPS
Three Months
Year Ended
Ended December 31,
December 31, 2013
2012
2013
2012
Reported (GAAP) Earnings per Share from Continuing Operations $
0.23
$ 0.15
$
0.45 $
0.95
Adjustments (after-tax)*:
• Interest associated with change in assessment of corporate tax
–
0.27
–benefits related to the cross-border energy lease investments
–
• PCI valuation allowances related to certain deferred tax assets
–
–
0.41
–
• Impairment charges related to Pepco Energy Services long-
0.01
0.02
0.01
0.03 lived assets
Adjusted Earnings per Share from Continuing Operations
$
0.24 $
0.17
$
1.14 $
0.98 (Non-GAAP)
* Calculated, where applicable, using a composite income tax rate of approximately 35%
Note: See Regulation G Information at the beginning of today’s presentation.
36
|
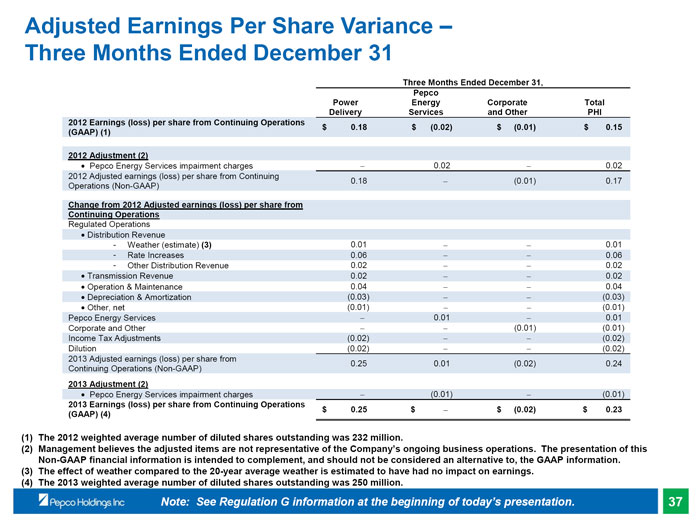 |
Adjusted Earnings Per Share Variance –Three Months Ended December 31
Three Months Ended December 31, Pepco
Power
Energy
Corporate
Total
Delivery
Services
and Other
PHI 2012 Earnings (loss) per share from Continuing Operations
$
0.18
$ (0.02)
$ (0.01)
$ 0.15 (GAAP) (1)
2012 Adjustment (2)
• Pepco Energy Services impairment charges
0.02
0.02 2012 Adjusted earnings (loss) per share from Continuing
0.18
(0.01)
0.17 Operations (Non-GAAP)
Change from 2012 Adjusted earnings (loss) per share from
Continuing Operations
Regulated Operations
• Distribution Revenue
- Weather (estimate) (3)
0.01
0.01
- Rate Increases
0.06
0.06
- Other Distribution Revenue
0.02
0.02
• Transmission Revenue
0.02
0.02
• Operation & Maintenance
0.04
0.04
• Depreciation & Amortization
(0.03)
(0.03)
Other, net
(0.01)
(0.01) Pepco Energy Services
0.01
0.01 Corporate and Other
(0.01)
(0.01) Income Tax Adjustments
(0.02)
(0.02) Dilution
(0.02)
(0.02) 2013 Adjusted earnings (loss) per share from 0.25
0.01
(0.02)
0.24 Continuing Operations (Non-GAAP)
2013 Adjustment (2)
• Pepco Energy Services impairment charges
(0.01)
(0.01)
2013 Earnings (loss) per share from Continuing Operations
$
0.25
$
$ (0.02)
$ 0.23 (GAAP) (4)
(1) The 2012 weighted average number of diluted shares outstanding was 232 million.
(2) Management believes the adjusted items are not representative of the Company’s ongoing business operations. The presentation of this Non-GAAP financial information is intended to complement, and should not be considered an alternative to, the GAAP information. (3) The effect of weather compared to the 20-year average weather is estimated to have had no impact on earnings.
(4) The 2013 weighted average number of diluted shares outstanding was 250 million.
Note: See Regulation G information at the beginning of today’s presentation.
37
|
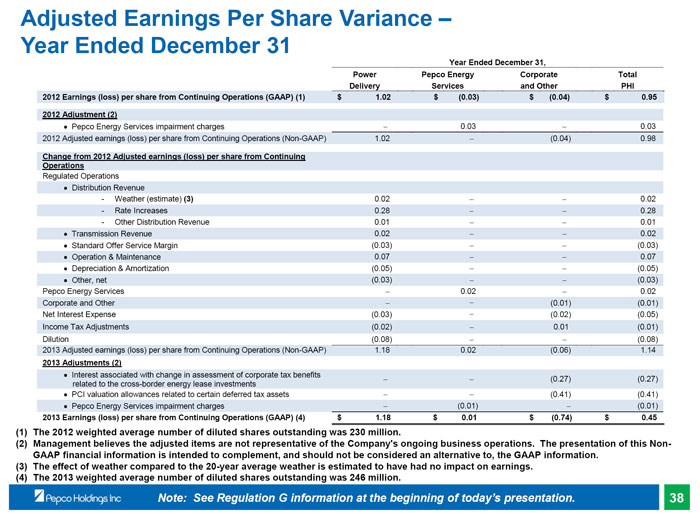 |
Adjusted Earnings Per Share Variance –Year Ended December 31
Year Ended December 31,
Power
Pepco Energy
Corporate
Total
Delivery
Services
and Other
PHI 2012 Earnings (loss) per share from Continuing Operations (GAAP) (1)
$
1.02
$ (0.03)
$ (0.04)
$
0.95 2012 Adjustment (2)
• Pepco Energy Services impairment charges
0.03
0.03 2012 Adjusted earnings (loss) per share from Continuing Operations (Non-GAAP)
1.02
(0.04)
0.98
Change from 2012 Adjusted earnings (loss) per share from Continuing Operations
Regulated Operations
• Distribution Revenue
- Weather (estimate) (3)
0.02
0.02
- Rate Increases
0.28
0.28
- Other Distribution Revenue
0.01
0.01
Transmission Revenue
0.02
0.02
Standard Offer Service Margin
(0.03)
(0.03)
Operation & Maintenance
0.07
0.07
Depreciation & Amortization
(0.05)
(0.05)
Other, net
(0.03)
(0.03) Pepco Energy Services
0.02
0.02 Corporate and Other
(0.01)
(0.01) Net Interest Expense
(0.03)
(0.02)
(0.05) Income Tax Adjustments
(0.02)
0.01
(0.01) Dilution
(0.08)
(0.08) 2013 Adjusted earnings (loss) per share from Continuing Operations (Non-GAAP)
1.18
0.02
(0.06)
1.14
2013 Adjustments (2)
• Interest associated with change in assessment of corporate tax benefits related to the cross-border energy lease investments
(0.27)
(0.27)
• PCI valuation allowances related to certain deferred tax assets
(0.41)
(0.41)
• Pepco Energy Services impairment charges
(0.01)
(0.01)
2013 Earnings (loss) per share from Continuing Operations (GAAP) (4)
$
1.18
$
0.01
$ (0.74)
$
0.45
(1) The 2012 weighted average number of diluted shares outstanding was 230 million.
(2) Management believes the adjusted items are not representative of the Company’s ongoing business operations. The presentation of this Non-GAAP financial information is intended to complement, and should not be considered an alternative to, the GAAP information.
(3) The effect of weather compared to the 20-year average weather is estimated to have had no impact on earnings. (4) The 2013 weighted average number of diluted shares outstanding was 246 million.
Note: See Regulation G information at the beginning of today’s presentation.
38
|