Attached files
| file | filename |
|---|---|
| 8-K - 8-K - ONCOR ELECTRIC DELIVERY CO LLC | d683623d8k.htm |
Exhibit 99.1

Fourth Quarter And Year End 2013 Investor Call February 28, 2014 Oncor Electric Delivery
Forward Looking Statements This presentation contains forward-looking statements, which are subject to various risks and uncertainties. Discussion of risks and uncertainties that could cause actual results to differ materially from management’s current projections, forecasts, estimates and expectations is contained in filings made by Oncor Electric Delivery Company LLC (Oncor) with the Securities and Exchange Commission (SEC). Specifically, Oncor makes reference to the section entitled “Risk Factors” in its annual and quarterly reports. In addition to the risks and uncertainties set forth in Oncor’s SEC filings, the forward-looking statements in this presentation could be affected by, among other things: prevailing governmental policies and regulatory actions; legal and administrative proceedings and settlements, including the exercise of equitable powers by courts; weather conditions and other natural phenomena; acts of sabotage, wars or terrorist or cyber security threats or activities; economic conditions, including the impact of a recessionary environment; unanticipated population growth or decline, or changes in market demand and demographic patterns; changes in business strategy, development plans or vendor relationships; unanticipated changes in interest rates or rates of inflation; unanticipated changes in operating expenses, liquidity needs and capital expenditures; inability of various counterparties to meet their financial obligations to Oncor, including failure of counterparties to perform under agreements; adverse impacts on us as a result of any restructuring transactions involving Texas Energy Future Holdings Limited Partnership and its direct and indirect subsidiaries; general industry trends; hazards customary to the industry and the possibility that Oncor may not have adequate insurance to cover losses resulting from such hazards; changes in technology used by and services offered by Oncor; significant changes in Oncor’s relationship with its employees; changes in assumptions used to estimate costs of providing employee benefits, including pension and other post-retirement employee benefits, and future funding requirements related thereto; significant changes in critical accounting policies material to Oncor; commercial bank and financial market conditions, access to capital, the cost of such capital, and the results of financing and refinancing efforts, including availability of funds in the capital markets and the potential impact of disruptions in US credit markets; circumstances which may contribute to future impairment of goodwill, intangible or other long-lived assets; financial restrictions under Oncor’s revolving credit facility and indentures governing its debt instruments; Oncor’s ability to generate sufficient cash flow to make interest payments on its debt instruments; actions by credit rating agencies; and Oncor’s ability to effectively execute its operational strategy. Any forward-looking statement speaks only as of the date on which it is made, and Oncor undertakes no obligation to update any forward-looking statement to reflect events or circumstances after the date on which it is made or to reflect the occurrence of unanticipated events. Regulation G This presentation includes certain non-GAAP financial measures. A reconciliation of these measures to the most directly comparable GAAP measures is included in this presentation, which is available on Oncor’s website, www.oncor.com, in the Investor section, and also filed with the SEC. Oncor Electric Delivery 1
4th Quarter and Year End 2013 Investor Call Agenda Financial Overview David Davis Chief Financial Officer Operational Review Bob Shapard Chairman and CEO Q&A Oncor Electric Delivery 2
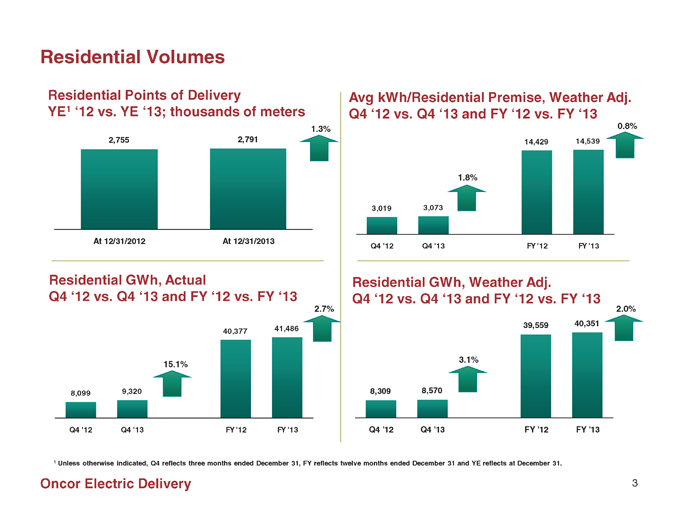
Residential Volumes Residential Points of Delivery Avg kWh/Residential Premise, Weather Adj. YE1 ‘12 vs. YE ‘13; thousands of meters Q4 ‘12 vs. Q4 ‘13 and FY ‘12 vs. FY ‘13 1.3% 0.8% 2,755 2,791 14,429 14,539 1.8% 3,019 3,073 At 12/31/2012 At 12/31/2013 Q4 ‘12 Q4 ‘13 FY ‘12 FY ‘13 Residential GWh, Actual Residential GWh, Weather Adj. Q4 ‘12 vs. Q4 ‘13 and FY ‘12 vs. FY ‘13 Q4 ‘12 vs. Q4 ‘13 and FY ‘12 vs. FY ‘13 2.7% 2.0% 39,559 40,351 40,377 41,486 3.1% 15.1% 8,099 9,320 8,309 8,570 Q4 ‘12 Q4 ‘13 FY ‘12 FY ‘13 Q4 ‘12 Q4 ‘13 FY ‘12 FY ‘13 1 Unless otherwise indicated, Q4 reflects three months ended December 31, FY reflects twelve months ended December 31 and YE reflects at December 31. Oncor Electric Delivery 3
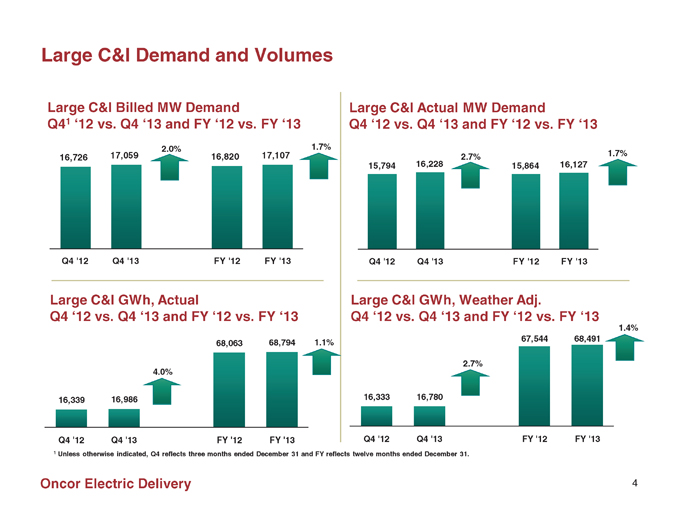
Large C&I Demand and Volumes Large C&I Billed MW Demand Large C&I Actual MW Demand Q41 ‘12 vs. Q4 ‘13 and FY ‘12 vs. FY ‘13 Q4 ‘12 vs. Q4 ‘13 and FY ‘12 vs. FY ‘13 2.0% 1.7% 1.7% 16,726 17,059 16,820 17,107 2.7% 15,794 16,228 15,864 16,127 Q4 ‘12 Q4 ‘13 FY ‘12 FY ‘13 Q4 ‘12 Q4 ‘13 FY ‘12 FY ‘13 Large C&I GWh, Actual Large C&I GWh, Weather Adj. Q4 ‘12 vs. Q4 ‘13 and FY ‘12 vs. FY ‘13 Q4 ‘12 vs. Q4 ‘13 and FY ‘12 vs. FY ‘13 1.4% 67,544 68,491 68,063 68,794 1.1% 2.7% 4.0% 16,339 16,986 16,333 16,780 Q4 ‘12 Q4 ‘13 FY ‘12 FY ‘13 Q4 ‘12 Q4 ‘13 FY ‘12 FY ‘13 1 Unless otherwise indicated, Q4 reflects three months ended December 31 and FY reflects twelve months ended December 31. Oncor Electric Delivery 4
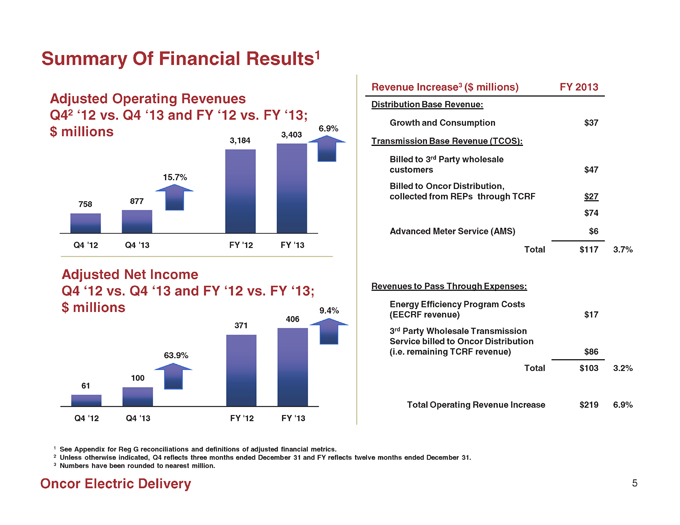
Summary Of Financial Results1 Revenue Increase3 ($ millions) FY 2013 Adjusted Operating Revenues Distribution Base Revenue: Q42 ‘12 vs. Q4 ‘13 and FY ‘12 vs. FY ‘13; Growth and Consumption $37 $ millions 3,403 6.9% 3,184 Transmission Base Revenue (TCOS): Billed to 3rd Party wholesale customers $47 15.7% Billed to Oncor Distribution, collected from REPs through TCRF $27 877 758 $74 Advanced Meter Service (AMS) $6 Q4 ‘12 Q4 ‘13 FY ‘12 FY ‘13 Total $117 3.7% Adjusted Net Income Q4 ‘12 vs. Q4 ‘13 and FY ‘12 vs. FY ‘13; Revenues to Pass Through Expenses: $ millions 9.4% Energy Efficiency Program Costs (EECRF revenue) $17 371 406 3rd Party Wholesale Transmission Service billed to Oncor Distribution (i.e. remaining TCRF revenue) $86 63.9% Total $103 3.2% 100 61 Total Operating Revenue Increase $219 6.9% Q4 ‘12 Q4 ‘13 FY ‘12 FY ‘13 1 See Appendix for Reg G reconciliations and definitions of adjusted financial metrics. 2 Unless otherwise indicated, Q4 reflects three months ended December 31 and FY reflects twelve months ended December 31. 3 Numbers have been rounded to nearest million. Oncor Electric Delivery 5
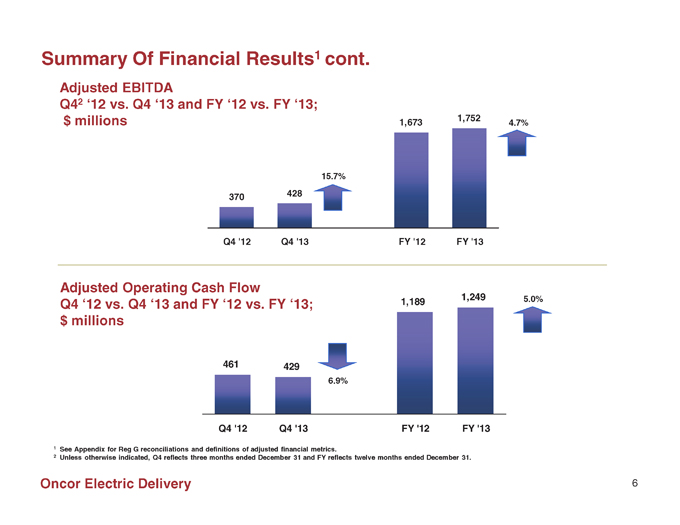
Summary Of Financial Results1 cont. Adjusted EBITDA Q42 ‘12 vs. Q4 ‘13 and FY ‘12 vs. FY ‘13; $ millions 1,752 1,673 4.7% 15.7% 428 370 Q4 ‘12 Q4 ‘13 FY ‘12 FY ‘13 Adjusted Operating Cash Flow 1,249 5.0% Q4 ‘12 vs. Q4 ‘13 and FY ‘12 vs. FY ‘13; 1,189 $ millions 461 429 6.9% Q4 ‘12 Q4 ‘13 FY ‘12 FY ‘13 1 See Appendix for Reg G reconciliations and definitions of adjusted financial metrics. 2 Unless otherwise indicated, Q4 reflects three months ended December 31 and FY reflects twelve months ended December 31. Oncor Electric Delivery 6
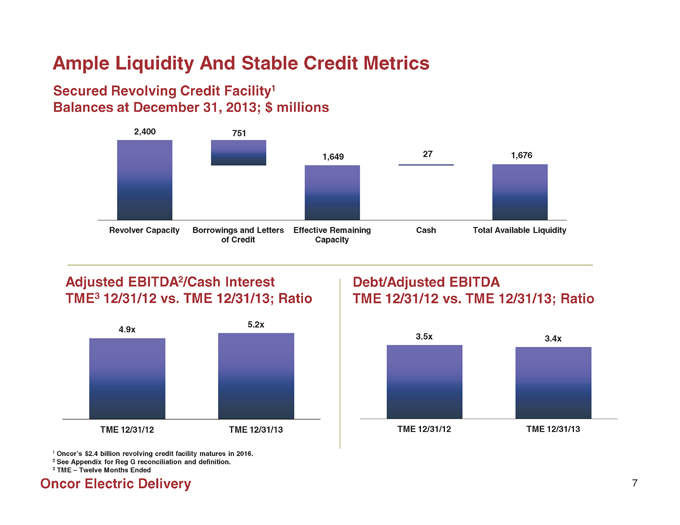
Ample Liquidity And Stable Credit Metrics Secured Revolving Credit Facility1 Balances at December 31, 2013; $ millions 2,400 751 1,649 27 1,676 Revolver Capacity Borrowings and Letters Effective Remaining Cash Total Available Liquidity of Credit Capacity Adjusted EBITDA2/Cash Interest Debt/Adjusted EBITDA TME3 12/31/12 vs. TME 12/31/13; Ratio TME 12/31/12 vs. TME 12/31/13; Ratio 5.2x 4.9x 3.5x 3.4x TME 12/31/12 TME 12/31/13 TME 12/31/12 TME 12/31/13 1 Oncor’s $2.4 billion revolving credit facility matures in 2016. 2 See Appendix for Reg G reconciliation and definition. 3 TME – Twelve Months Ended Oncor Electric Delivery 7
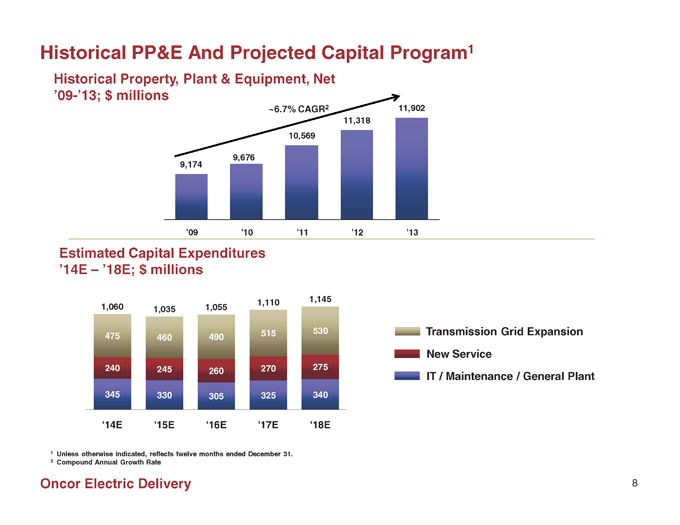
Historical PP&E And Projected Capital Program1 Historical Property, Plant & Equipment, Net ’09-’13; $ millions ~6.7% CAGR2 11,902 11,318 10,569 9,676 9,174 ‘09 ‘10 ‘11 ‘12 ‘13 Estimated Capital Expenditures ’14E – ’18E; $ millions 1,145 1,110 1,060 1,035 1,055 515 530 Transmission Grid Expansion 475 460 490 New Service 240 245 270 275 260 IT / Maintenance / General Plant 345 330 305 325 340 ‘14E ‘15E ‘16E ‘17E ‘18E 1 Unless otherwise indicated, reflects twelve months ended December 31. 2 Compound Annual Growth Rate Oncor Electric Delivery 8
4th Quarter and Year End 2013 Investor Call Agenda Financial Overview David Davis Chief Financial Officer Operational Review Bob Shapard Chairman and CEO Q&A Oncor Electric Delivery 9
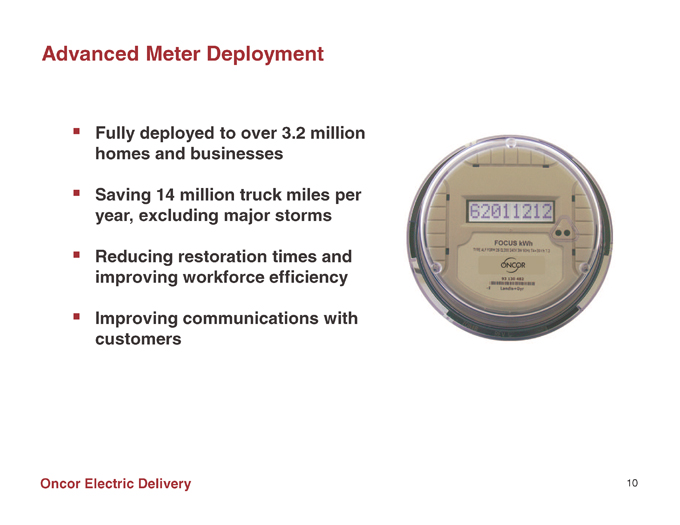
Advanced Meter Deployment Fully deployed to over 3.2 million homes and businesses Saving 14 million truck miles per year, excluding major storms Reducing restoration times and improving workforce efficiency Improving communications with customers Oncor Electric Delivery 10
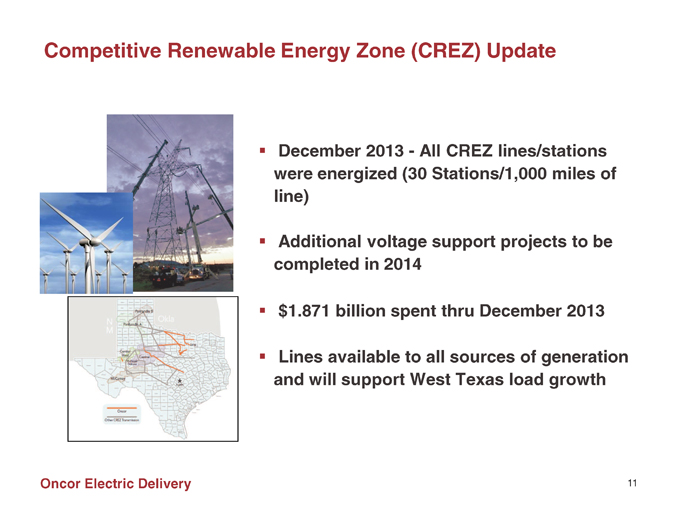
Competitive Renewable Energy Zone (CREZ) Update December 2013—All CREZ lines/stations were energized (30 Stations/1,000 miles of line) Additional voltage support projects to be completed in 2014 $1.871 billion spent thru December 2013 Lines available to all sources of generation and will support West Texas load growth Oncor Electric Delivery 11
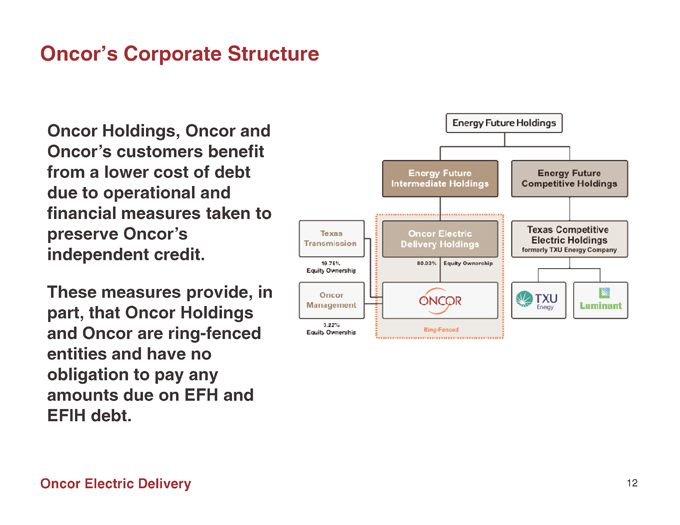
Oncor’s Corporate Structure Oncor Holdings, Oncor and Oncor’s customers benefit from a lower cost of debt due to operational and financial measures taken to preserve Oncor’s independent credit. These measures provide, in part, that Oncor Holdings and Oncor are ring-fenced entities and have no obligation to pay any amounts due on EFH and EFIH debt. Oncor Electric Delivery 12
Appendix—Regulation G Reconciliations and Supplemental Data Oncor Electric Delivery 13
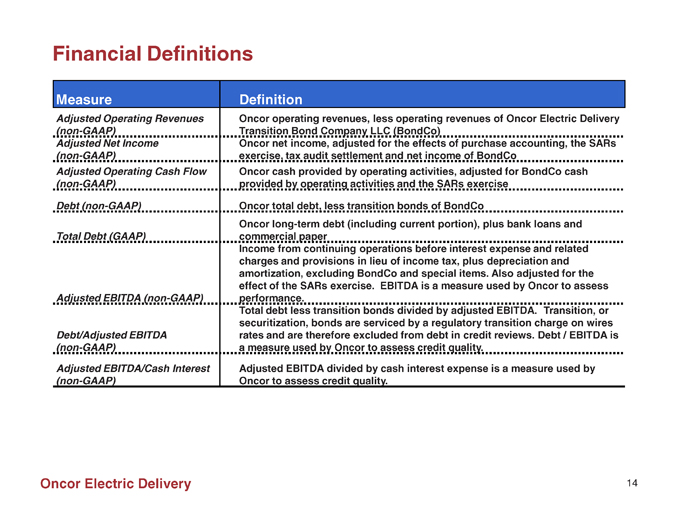
Financial Definitions Measure Definition Adjusted Operating Revenues Oncor operating revenues, less operating revenues of Oncor Electric Delivery (non-GAAP) Transition Bond Company LLC (BondCo) Adjusted Net Income Oncor net income, adjusted for the effects of purchase accounting, the SARs (non-GAAP) exercise, tax audit settlement and net income of BondCo Adjusted Operating Cash Flow Oncor cash provided by operating activities, adjusted for BondCo cash (non-GAAP) provided by operating activities and the SARs exercise Debt (non-GAAP) Oncor total debt, less transition bonds of BondCo Oncor long-term debt (including current portion), plus bank loans and Total Debt (GAAP) commercial paper Income from continuing operations before interest expense and related charges and provisions in lieu of income tax, plus depreciation and amortization, excluding BondCo and special items. Also adjusted for the effect of the SARs exercise. EBITDA is a measure used by Oncor to assess Adjusted EBITDA (non-GAAP) performance. Total debt less transition bonds divided by adjusted EBITDA. Transition, or securitization, bonds are serviced by a regulatory transition charge on wires Debt/Adjusted EBITDA rates and are therefore excluded from debt in credit reviews. Debt / EBITDA is (non-GAAP) a measure used by Oncor to assess credit quality. Adjusted EBITDA/Cash Interest Adjusted EBITDA divided by cash interest expense is a measure used by (non-GAAP) Oncor to assess credit quality. Oncor Electric Delivery 14
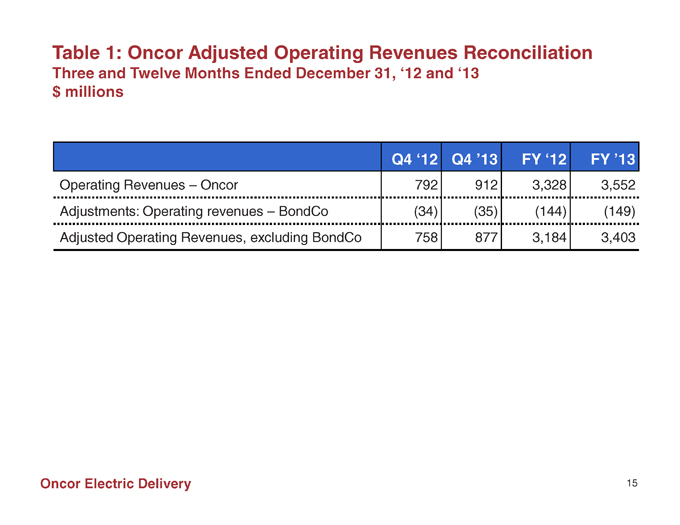
Table 1: Oncor Adjusted Operating Revenues Reconciliation Three and Twelve Months Ended December 31, ‘12 and ‘13 $ millions Q4 ‘12 Q4 ’13 FY ‘12 FY ’13 Operating Revenues – Oncor 792 912 3,328 3,552 Adjustments: Operating revenues – BondCo (34) (35) (144) (149) Adjusted Operating Revenues, excluding BondCo 758 877 3,184 3,403 Oncor Electric Delivery 15
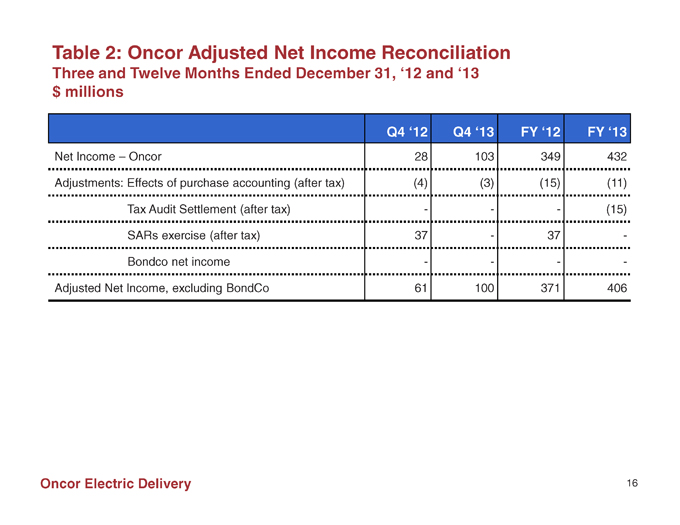
Table 2: Oncor Adjusted Net Income Reconciliation Three and Twelve Months Ended December 31, ‘12 and ‘13 $ millions Q4 ‘12 Q4 ‘13 FY ‘12 FY ‘13 Net Income – Oncor 28 103 349 432 Adjustments: Effects of purchase accounting (after tax) (4) (3) (15) (11) Tax Audit Settlement (after tax) ——(15) SARs exercise (after tax) 37—37 -Bondco net income — —Adjusted Net Income, excluding BondCo 61 100 371 406 Oncor Electric Delivery 16
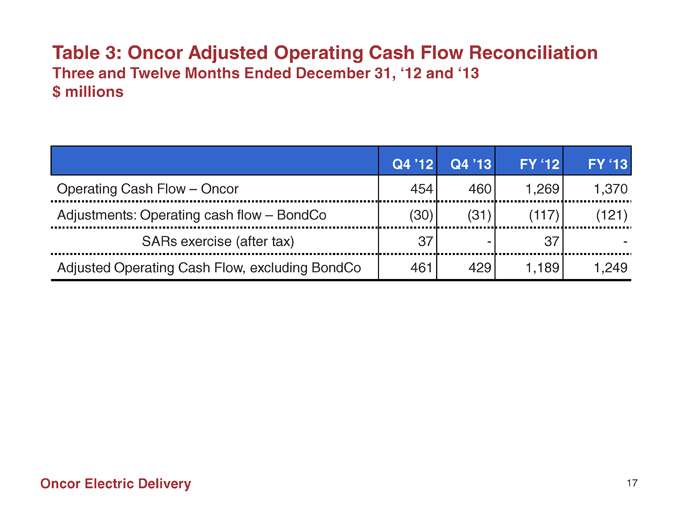
Table 3: Oncor Adjusted Operating Cash Flow Reconciliation Three and Twelve Months Ended December 31, ‘12 and ‘13 $ millions Q4 ’12 Q4 ’13 FY ‘12 FY ‘13 Operating Cash Flow – Oncor 454 460 1,269 1,370 Adjustments: Operating cash flow – BondCo (30) (31) (117) (121) SARs exercise (after tax) 37—37 -Adjusted Operating Cash Flow, excluding BondCo 461 429 1,189 1,249 Oncor Electric Delivery 17
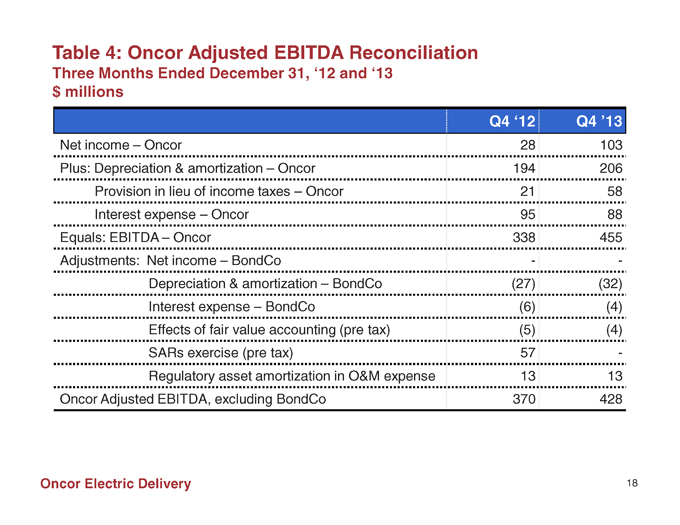
Table 4: Oncor Adjusted EBITDA Reconciliation Three Months Ended December 31, ‘12 and ‘13 $ millions Q4 ‘12 Q4 ’13 Net income – Oncor 28 103 Plus: Depreciation & amortization – Oncor 194 206 Provision in lieu of income taxes – Oncor 21 58 Interest expense – Oncor 95 88 Equals: EBITDA – Oncor 338 455 Adjustments: Net income – BondCo —Depreciation & amortization – BondCo (27) (32) Interest expense – BondCo (6) (4) Effects of fair value accounting (pre tax) (5) (4) SARs exercise (pre tax) 57 -Regulatory asset amortization in O&M expense 13 13 Oncor Adjusted EBITDA, excluding BondCo 370 428 Oncor Electric Delivery 18
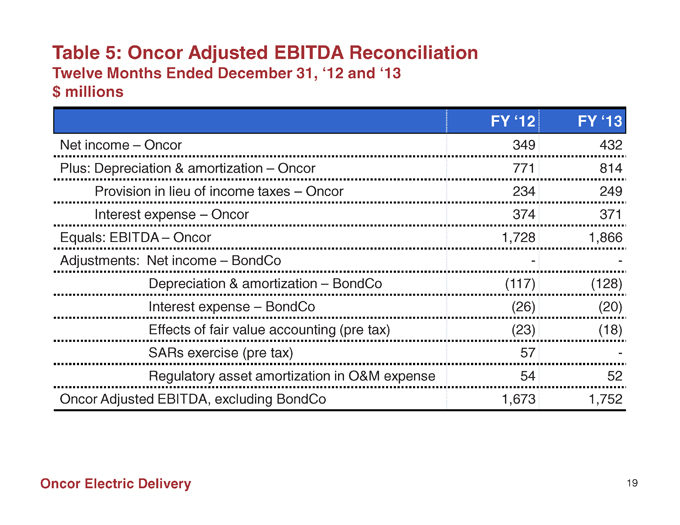
Table 5: Oncor Adjusted EBITDA Reconciliation Twelve Months Ended December 31, ‘12 and ‘13 $ millions FY ‘12 FY ‘13 Net income – Oncor 349 432 Plus: Depreciation & amortization – Oncor 771 814 Provision in lieu of income taxes – Oncor 234 249 Interest expense – Oncor 374 371 Equals: EBITDA – Oncor 1,728 1,866 Adjustments: Net income – BondCo —Depreciation & amortization – BondCo (117) (128) Interest expense – BondCo (26) (20) Effects of fair value accounting (pre tax) (23) (18) SARs exercise (pre tax) 57 -Regulatory asset amortization in O&M expense 54 52 Oncor Adjusted EBITDA, excluding BondCo 1,673 1,752 Oncor Electric Delivery 19
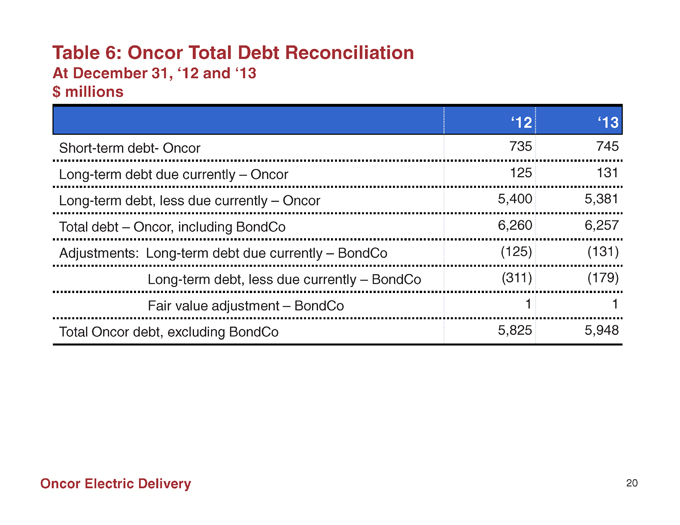
Table 6: Oncor Total Debt Reconciliation At December 31, ‘12 and ‘13 $ millions ‘12 ‘13 Short-term debt- Oncor 735 745 Long-term debt due currently – Oncor 125 131 Long-term debt, less due currently – Oncor 5,400 5,381 Total debt – Oncor, including BondCo 6,260 6,257 Adjustments: Long-term debt due currently – BondCo (125) (131) Long-term debt, less due currently – BondCo (311) (179) Fair value adjustment – BondCo 1 1 Total Oncor debt, excluding BondCo 5,825 5,948 Oncor Electric Delivery 20
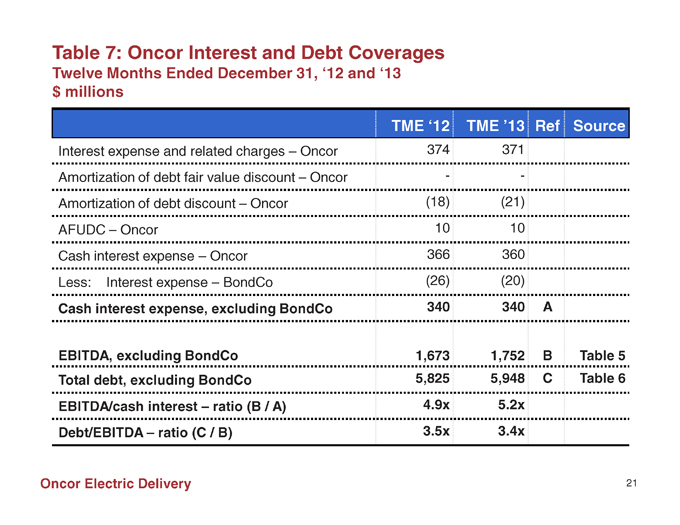
Table 7: Oncor Interest and Debt Coverages Twelve Months Ended December 31, ‘12 and ‘13 $ millions TME ‘12 TME ’13 Ref Source Interest expense and related charges – Oncor 374 371 Amortization of debt fair value discount – Oncor —Amortization of debt discount – Oncor (18) (21) AFUDC – Oncor 10 10 Cash interest expense – Oncor 366 360 Less: Interest expense – BondCo (26) (20) Cash interest expense, excluding BondCo 340 340 A EBITDA, excluding BondCo 1,673 1,752 B Table 5 Total debt, excluding BondCo 5,825 5,948 C Table 6 EBITDA/cash interest – ratio (B / A) 4.9x 5.2x Debt/EBITDA – ratio (C / B) 3.5x 3.4x Oncor Electric Delivery 21