Attached files
| file | filename |
|---|---|
| 8-K - 8-K - NORTHSTAR REALTY FINANCE CORP. | a14-7139_18k.htm |
Exhibit 99.1
|
|
Investor Presentation February 2014 399 Park Avenue, 18th Floor, New York, NY 10022 | 212.547.2600 | NRFC.com |
|
|
1 Safe Harbor This presentation contains forward-looking statements, within the meaning of the Private Securities Litigation Reform Act of 1995, including statements about future results, projected yields, rates of return and performance, projected cash available for distribution, projected cash from any single source of investment or fee stream, projected expenses, expected and weighted average return on equity, market and industry trends, investment opportunities, business conditions and other matters, including, among other things: our ability to complete the spin-off of our asset management business, which we announced we are exploring on December 10, 2013: the risks relating to the spin-off of our asset management business and operating our existing company and our asset management business as separate companies; our ability to realize the benefits of the spin-off, including the taxation of the asset management business as a stand-alone company; the growth prospects of our business, including our asset management business; our future cash available for distribution; the scalability of our investment platform; our ability to enter into a definitive agreement and close the $1.05 billion acquisition of healthcare real estate properties on the terms anticipated, if at all; the size and timing of offerings or capital raises and actual management fee income derived from the non-traded REITs we sponsor and advise; the ability to opportunistically participate in commercial real estate refinancings; the ability to realize upon attractive investment opportunities; our ability to realize the projections related to cash available for distribution and underlying assumption; the projected returns on, and cash earned from, investments, including investments funded by drawings from our credit facilities and securities offerings; and equity and debt capital; our ability to realize the benefits of our announced exchange offer. Forward-looking statements concern future circumstances and results and other statements that are not historical facts and are sometimes identified by the words “may,” “will,” “should,” “potential,” “intend,” “expect,” “seek,” “anticipate,” “estimate,” “believe,” “could,” “project,” “predict,” “continue” or other similar words or expressions. The forward-looking statements involve a number of significant risks and uncertainties. A number of factors, including those factors set forth under the section entitled “Risk Factors” in the Annual Report on Form 10-K for the year ended December 31, 2013 of NorthStar Realty Finance Corp. (the “Company”), could cause the Company’s actual results, performance, achievements or industry results to be materially different from any future results, performance and achievements expressed or implied by these forward-looking statements. Additional information concerning factors that could cause actual results to materially differ from those in the forward-looking statements is contained in the Securities and Exchange Commission filings of the Company. The Company does not guarantee that the assumptions underlying such forward-looking statements are free from errors. The Company undertakes no obligation to publicly update any information whether as a result of new information, future events, or otherwise. Unless otherwise stated, historical financial information and per share & other data is as of December 31, 2013. This presentation is for informational purposes only and does not constitute an offer to sell or a solicitation of an offer to buy any securities of the Company. The footnotes herein contain important information that is material to an understanding of this presentation and you should read this presentation only with and in context of the footnotes. |
|
|
Overview of NorthStar Realty Finance(1) Premier diversified commercial real estate investment and asset management company with $11 billion of commercial real estate assets under management Broad, scalable and sophisticated commercial real estate platform (currently over 155 employees) Increased common dividend ten consecutive quarters, representing an aggregate 150% increase over this period $3.6 billion of 2013 commercial real estate ("CRE") investments Diversification across a broad spectrum of commercial real estate investments Real Estate Portfolio: manufactured housing, healthcare, office and retail net lease and multifamily Opportunistic CRE Investments: real estate private equity interests and CDO bond repurchases Loan Originations: senior and mezzanine with match-funded financing Announced spin-off of asset management business into a separate publicly traded company, NorthStar Asset Management Group Inc. (“NSAM”) 2 |
|
|
3 NRF Consistent Outperformance(2) NRF CAGR: 44.3% Total Return Outperformance NRF (IPO October 2004) through February 2014 June 2011 through February 2014 Strong Dividend Growth Compounded Annual Total Return 0.125 0.135 0.15 0.16 0.17 0.18 0.19 0.20 0.21 0.25 $- $0.05 $0.10 $0.15 $0.20 $0.25 $0.30 -10% 0% 10% 20% Commercial Mortgage REITs S&P 500 MSCI U.S. REIT Index (RMS) NRF 50 100 150 200 250 300 350 400 450 500 Jun-11 Jan-12 Jul-12 Jan-13 Aug-13 Feb-14 Index Value NRF Commerical Mortgage REIT S&P 500 RMS |
|
|
4 Overview of Asset Management Spin-Off Pro Forma Structure: Unlocking Platform Value Contract / Fees Diversified CRE Investments Non-Traded REITs and Other NRF NorthStar Asset Management Current NRF Shareholders Current NRF Shareholders Management Ownership Ownership Ownership Current Structure: Internally Managed REIT Diversified CRE Investments NRF Current NRF Shareholders Non-Traded REITs and Other Ownership Management Contracts / Fees Ownership Management Contracts / Fees Shareholders own manager! |
|
|
5 Overview of Asset Management Spin-Off Asset Management Business Diversified CRE Investments Spinoff Leading investor in diversified commercial real estate assets Proven ability to grow existing business through a diligent investment strategy driving attractive returns to shareholders Strong asset growth with dependable cash flows and liquidity Attractive current income through dividend yield with upside from embedded real estate asset value Proven track record of investing across a variety of real estate sectors and capital structures Significant insider ownership NSAM expected to establish itself as a leading asset manager with a long-term management contract with NRF and a rapidly growing non-traded REIT platform Attractive and high-growth alternative asset class Scalable operating platform with limited capital needs Proven track record in managing and growing NRF platform Growth prospects and expansion opportunities High margin business and multiple, long-term recurring revenue streams Separation of NRF into a publicly traded asset manager and an externally advised REIT represents a fully aligned, long-term opportunity to unlock value for NRF shareholders |
|
|
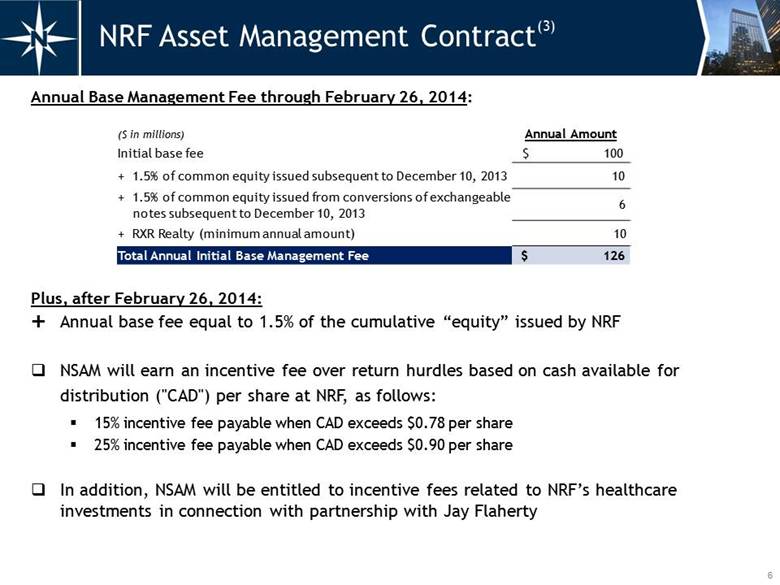
Annual Base Management Fee through February 26, 2014: Plus, after February 26, 2014: Annual base fee equal to 1.5% of the cumulative “equity” issued by NRF NSAM will earn an incentive fee over return hurdles based on cash available for distribution ("CAD") per share at NRF, as follows: 15% incentive fee payable when CAD exceeds $0.78 per share 25% incentive fee payable when CAD exceeds $0.90 per share In addition, NSAM will be entitled to incentive fees related to NRF’s healthcare investments in connection with partnership with Jay Flaherty 6 NRF Asset Management Contract(3) ($ in millions) Annual Amount Initial base fee $ 100 + 1.5% of common equity issued subsequent to December 10, 2013 10 + 1.5% of common equity issued from conversions of exchangeable notes subsequent to December 10, 2013 6 + RXR Realty (minimum annual amount) 10 Total Annual Initial Base Management Fee $ 126 |
|
|
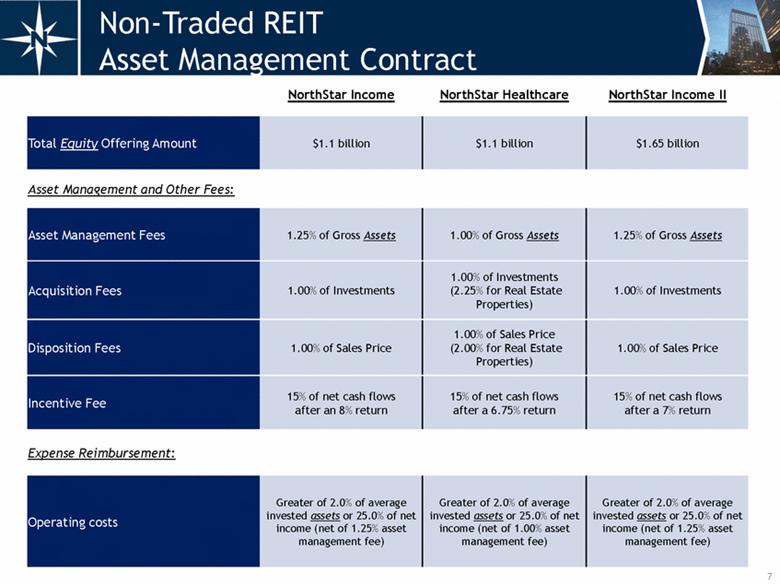
7 Non-Traded REIT Asset Management Contract NorthStar Income NorthStar Healthcare NorthStar Income II Total Equity Offering Amount $1.1 billion $1.1 billion $1.65 billion Asset Management and Other Fees: Asset Management Fees 1.25% of Gross Assets 1.00% of Gross Assets 1.25% of Gross Assets Acquisition Fees 1.00% of Investments 1.00% of Investments (2.25% for Real Estate Properties) 1.00% of Investments Disposition Fees 1.00% of Sales Price 1.00% of Sales Price (2.00% for Real Estate Properties) 1.00% of Sales Price Incentive Fee 15% of net cash flows after an 8% return 15% of net cash flows after a 6.75% return 15% of net cash flows after a 7% return Expense Reimbursement: Operating costs Greater of 2.0% of average invested assets or 25.0% of net income (net of 1.25% asset management fee) Greater of 2.0% of average invested assets or 25.0% of net income (net of 1.00% asset management fee) Greater of 2.0% of average invested assets or 25.0% of net income (net of 1.25% asset management fee) |
|
|
$1 billion $0.33 - $0.35 $2 billion $0.37 - $0.39 $3 billion $0.40 - $0.42 NSAM 8 Separation Analysis - Post-Spin 2014 Annualized Projected CAD(4) NRF CAD/Share of $0.75-$0.85 Post-spin 2014 annualized CAD following payment of fees and expected allocated expenses +/-$200 million of Gross Fees CAD/Share of $0.30-$0.32 Post-spin 2014 annualized gross fees and CAD with NO "equity" issued at NRF following February 26, 2014 ASSET MANAGEMENT New loan originations 28% CDO equity distributions 10% Real estate & RE PE investments 62% % of Post-Spin 2014 Annualized Projected CAD: Equity REITs 4-5% Current Dividend Yield of Peer Group: New CRE Finance REITs 6-8% Legacy CRE Finance REITs 7-10% Hypothetical Post-Spin NRF “Equity” Issuance Hypothetical Resulting CAD/Share * CAD per share amounts based on 360 million fully diluted shares outstanding, which (i) assumes the announced exchange offer for the 7.50% exchangeable notes is completed in full and refinanced following the spin-off and (ii) reflects all other outstanding exchangeable notes on an as-converted basis. |
|
|
NRF Post-Spin 2014 Annualized Projected CAD(5) $Amount Per Share 2014 gross cash available for distribution $520-$535 $1.45-$1.49 less: corporate debt and preferred costs $90-$100 $0.25-$0.28 less: cash G&A and management fees $140-$150 $0.39-$0.42 2014 annualized post-spin projected CAD * $270-$305 $0.75-$0.85 Q4 2013 CAD payout ratio 86% * See reconciliation to net income (loss) attributable to common stockholders at the end of the presentation. 9 $- $20 $40 $60 $80 $100 $120 $140 $160 PE Investment III CDO management & other fees NRF owned CDO bonds coupon income NRF owned security CDO bonds realized discounts NRF owned loan CDO bonds realized discounts RXR investment CRE CDO equity distributions PE Investment I PE Investment II 2011 - 2014 loan investments & other Real estate (Amounts in millions, except per share data ) |
|
|
Real Estate Asset Managers Fees: Contract Duration: P/E Multiples: Incentive 15-year initial term 52.1x Incentive Permanent 37.5x Fees: Contract Duration: P/E Multiples: Base (typically no incentive fees on traditional asset classes) High volatility (Mutual Funds: daily liquidity, Managed Accounts: monthly/quarterly liquidity) 19.7x Base + Incentive Finite fund life 19.2x Small Traditional Asset Managers NorthStar Asset Management NorthStar Asset Management Comparable(6) 10 Altisource Asset Management Management of Public Co. represents primary asset contract MLP GPs Similar Structure |
|
|
$8.85 $14.74 $10.08 11 NRF Value Proposition(7) Commercial Mortgage REITs, Equity REITs and Asset Managers Hypothetical implied share price assuming post-spin 2014 annualized projected CAD per share for NRF of $0.80 and NSAM of $0.31 NRF will continue to be a leading commercial real estate platform with a proven track record of investing across real estate sectors and capital structures NRF NSAM Longer Duration (Permanent Life Vehicles) Shorter Duration (Finite Life Vehicles) Average NSAM Structure Real Estate & Traditional Asset Managers Based on average multiples 0x 10x 20x 30x 40x 50x 60x Commercial Mortgage REITs Equity REITs Asset Managers Average Earnings Multiples |

|
|
12 2013 NRF Investments(8) During 2013, NRF made $3.6 billion of diversified CRE investments with an expected current yield on equity in excess of 16% 2013 Investments ($ in millions) Assets Invested Equity Expected Current Yield Potential Upside Opportunistic 1,438 $ 1,069 $ 18% ü Real estate portfolio 1,646 420 14% ü CRE Loans 473 418 13% ü Total / weighted average 3,557 $ 1,907 $ 16% Investments - NRF non-traded REITs 1,262 824 Total Investments 4,819 $ 2,731 $ |
|
|
13 Expected $1.6 billion healthcare portfolio leased to operators Partnership with Jay Flaherty, former CEO of HCP, Inc. Primarily net leased to operators with certain properties owned through RIDEA structure providing for participation in cash flow upside 9.2% implied capitalization rate at cost basis (based on operator NOI) NRF Real Estate Portfolio - Healthcare(9) Healthcare by Property Type (Cost Basis) ($ in millions) Total Portfolio Number of properties 167 Number of units/beds 14,090 NOI 150 $ Cost basis 1,628 $ ALF, 58% SNF, 40% ILF, 2% MOB, 0% |
|
|
14 $1.5 billion manufactured housing portfolio Over 27,000 pad rental sites 6.7% implied capitalization rate at cost basis Sector has historically demonstrated low cash flow volatility, steady year over year rent increases, and low capex NRF Real Estate Portfolio - Manufactured Housing(10) Manufactured Housing by Geographic Location (NOI) ($ in millions) Total Portfolio Number of communities 119 Number of pad rental sites 27,722 NOI 100 $ Cost basis $1,488 NOI related to: Pad rental sites 91% Other 9% WA occupancy 87% |
|
|
15 NRF Real Estate Portfolio - Other(11) $401 million predominately triple-net leased office, retail and industrial portfolio 7.9% implied capitalization rate at cost basis $367 million multifamily portfolio with over 4,500 units 6.4% implied capitalization rate at cost basis Net Lease by Property Type (Cost Basis) Net Lease by Geographic Location (Cost Basis) Multifamily by Geographic Location (Cost Basis) Florida, 23% Georgia, 22% Tennessee, 21% Arizona, 17% Pennsylvania, 12% Texas, 5% Office, 77% Retail, 16% Industrial, 7% |
|
|
16 NRF New Loan Originations(12) $936 million of invested equity in new loans in 2011-2014 90% directly originated $1.4 trillion of loan maturities expected over the next four years: Originated Loan Example Overview: NRF directly originated a $255 million loan secured by the Milford Plaza hotel located in Times Square, New York City Return on Equity: Initial current yield on equity of 12.5% with a 35% interest in the hotel and retail component of the hotel, pro-rata with NorthStar Income $0 $100 $200 $300 $400 2014 2015 2016 2017 ($ in billions) Commercial Banks, Savings Institutions Insurance Companies GSE's & Fed Related Mortgage Pools CMBS |
|
|
17 NRF PE Investments(13) PE Investment I: $282 million equity Acquired from TIAA-CREF Potential Return Matrix on NRF Investment Consolidated Fund IRRs From Reported 9-30-12 NAVs 5% 10% 15% 20% Resulting NRF IRR 8% 18% 27% 37% Resulting Recovery as a Percentage of Cost of Underlying Assets (Including Income) 86% 100% 121% 141% Priority returns and structure expected to enhance long-term IRR and resulting profits 85% / 15% NRF receives 85% of all cash distributions from the Funds until NRF receives a 1.5x multiple on its invested capital Liquidation at June 30, 2012 NAV = $430 million of distributions to NRF PE Investment II: $353 million equity Acquired from NJDOI Partnered with Goldman Sachs Asset Management |

|
|
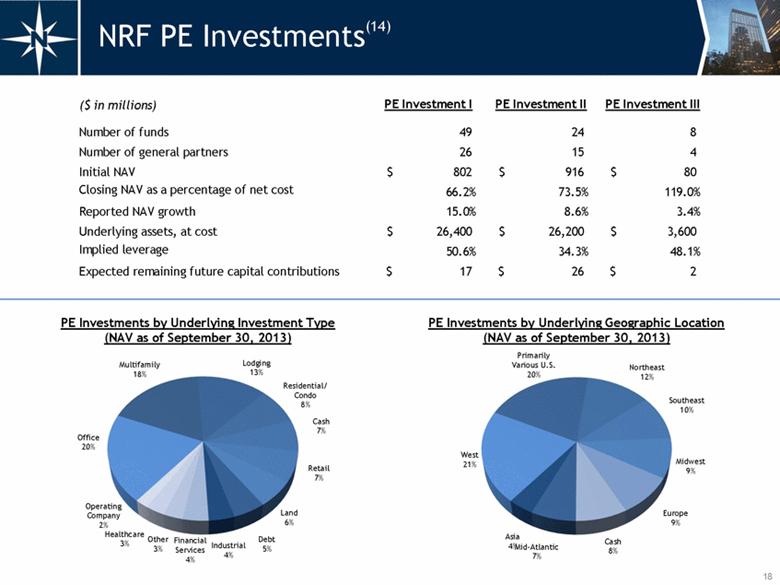
18 NRF PE Investments(14) PE Investments by Underlying Geographic Location (NAV as of September 30, 2013) PE Investments by Underlying Investment Type (NAV as of September 30, 2013) ($ in millions) PE Investment I PE Investment II PE Investment III Number of funds 49 24 8 Number of general partners 26 15 4 Initial NAV 802 $ 916 $ 80 $ Closing NAV as a percentage of net cost 66.2% 73.5% 119.0% Reported NAV growth 15.0% 8.6% 3.4% Underlying assets, at cost 26,400 $ 26,200 $ 3,600 $ Implied leverage 50.6% 34.3% 48.1% Expected remaining future capital contributions 17 $ 26 $ 2 $ West 21% Primarily Various U.S. 20% Northeast 12% Southeast 10% Europe 9% Midwest 9% Mid-Atlantic 8% Cash 7% Asia 4% Office 20% Multifamily 18% Lodging 13% Residential/Condo 8% Cash 7% Retail 7% Land 6% Debt 5% Industrial 4% Financial Services 4% Operating Company 2% Healthcare 3% Other 3% |
|
|
19 As of December 31, 2013, principal proceeds NRF could receive from our owned CDO bonds is $608 million, of which $476 million were repurchased at significant discounts to par and had a WA original credit rating of A Potential realizable cash flow of $319 million Purchase price of $157 million (67% discount to par) NRF Owned CDO Principal $608 million Repurchased at Discounts $476 million NRF CDO Bonds Repurchased(15) $- $100 $200 $300 $400 $500 $600 $700 ($ in millions) |
|
|
20 Seasoned Executive Team Name Position Yrs of Exp Relevant Background David T. Hamamoto Chairman and Chief Executive Officer 30 NorthStar Capital - Co-Founder Goldman, Sachs & Co. - Co-Founder and Partner of Real Estate Principal Investment (Whitehall Funds) Albert Tylis President 16 Bryan Cave / Robinson Silverman - Senior Attorney ASA Institute - Director of Corporate Finance and General Counsel Daniel R. Gilbert Chief Investment and Operating Officer; CEO - Non-Traded REIT Business 20 NorthStar Capital - Head of Mezzanine Lending Business Merrill Lynch - Group Head in Global Principal Investment and Commercial Real Estate Debra A. Hess Chief Financial Officer 28 Newcastle Investment Corp. - Chief Financial Officer Fortress Investment Group - Managing Director Goldman, Sachs & Co. - Vice President, Manager of Financial Reporting Ronald J. Lieberman Executive Vice President and General Counsel 19 Hunton & Williams - Partner, Real Estate Capital Markets Skadden, Arps, Slate, Meagher and Flom - Associate, Corporate and Securities Daniel D. Raffe Executive Vice President and Head of Portfolio Management 25 GE Business Property - Head of East and Midwest real estate acquisitions Cushman & Wakefield - Managing Director, Real Estate Capital Markets Steven B. Kauff Executive Vice President Structuring and Tax 27 NorthStar Capital - Structuring and Tax Arthur Anderson - Real Estate & Hospitality, Tax Consulting Price Waterhouse - Real Estate Industry, Tax Consulting Robert S. Riggs Managing Director 26 Olympus Real Estate Partners - Partner GE Capital Realty Group - COO and EVP of Equity Investing |
|
|
21 Appendix Non-Traded REIT Industry New Capital Repurchased CDO Bond Example 2013 Financing Transaction Reconciliation of Post-Spin 2014 Annualized Projected Cash Available for Distribution for NRF and NSAM Presentation Endnotes |

|
|
22 Non-Traded REIT Industry New Capital(16) $- $5 $10 $15 $20 2003 2004 2005 2006 2007 2008 2009 2010 2011 2012 2013 Public Non-Traded REIT Industry 2003 - 2013 Annual Fundraising ($ in billions) |
|
|
23 Repurchased CDO Bond Example(17) NRF CRE Debt CDO : ($ in millions) Asset Types Bond Classes Class Original Rating Economic Credit Support Current Principal Amount A1A AAA 56% $41 A1R AAA 56% 167 A2A AAA 73% 243 Example Investment A2B AAA 56% 125 Economic Credit B AA 45% 83 Support to Class D Purchase class: D C A+ 36% 62 $242 million Price paid: 34% D A 32% 30 Assumed WAL: 5 years E A- 28% 30 Expected IRR: 20%+ F BBB+ 25% 27 G BBB 20% 33 H BBB- 16% 31 Below investment grade bonds 121 Original deal size: $1.3 billion First Mortgages, 94% CMBS & Other Securities, 4% Junior Participations, 3% |
|
|
24 2013 Financing Transaction Experienced accessing structured finance markets Sponsored 9 CDOs totaling approximately $4 billion of issued IG rated notes 2012: $351 million financing transaction (NorthStar and NorthStar Income) 2013: Recent $532 million financing transaction (NorthStar Income) $383 million of IG bonds Retained Interest WA coupon of L + 2.68% Permanent financing Non-recourse Non-mark-to-market Low-cost Flexible structure with “ramp” cash for investment 2013 NorthStar Income Financing Transaction $- $100 $200 $300 $400 $500 $600 ($ in millions) |
|
|
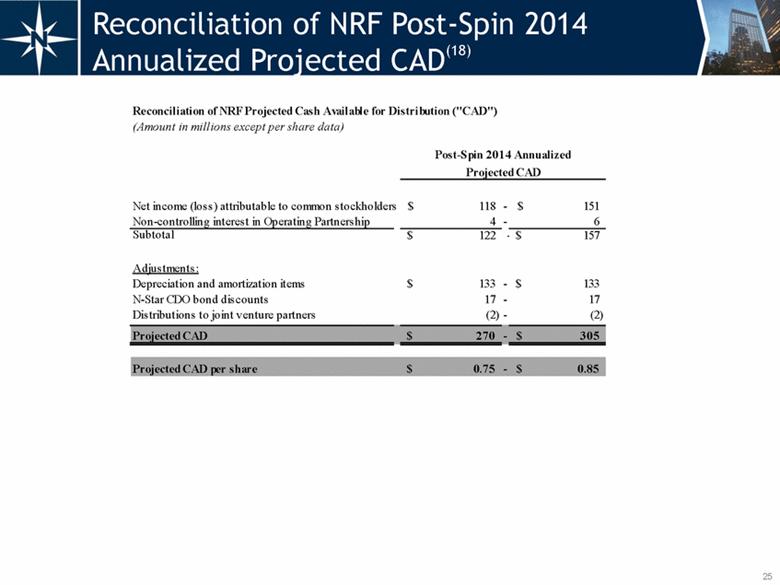
25 Reconciliation of NRF Post-Spin 2014 Annualized Projected CAD(18) Reconciliation of NRF Projected Cash Available for Distribution ("CAD") (Amount in millions except per share data) Post-Spin 2014 Annualized Projected CAD Net income (loss) attributable to common stockholders 118 $ - 151 $ Non-controlling interest in Operating Partnership 4 - 6 Subtotal 122 $ - 157 $ Adjustments: Depreciation and amortization items 133 $ - 133 $ N-Star CDO bond discounts 17 - 17 Distributions to joint venture partners (2) - (2) -Projected CAD 270 $ - 305 $ Projected CAD per share 0.75 $ - 0.85 $ |
|
|
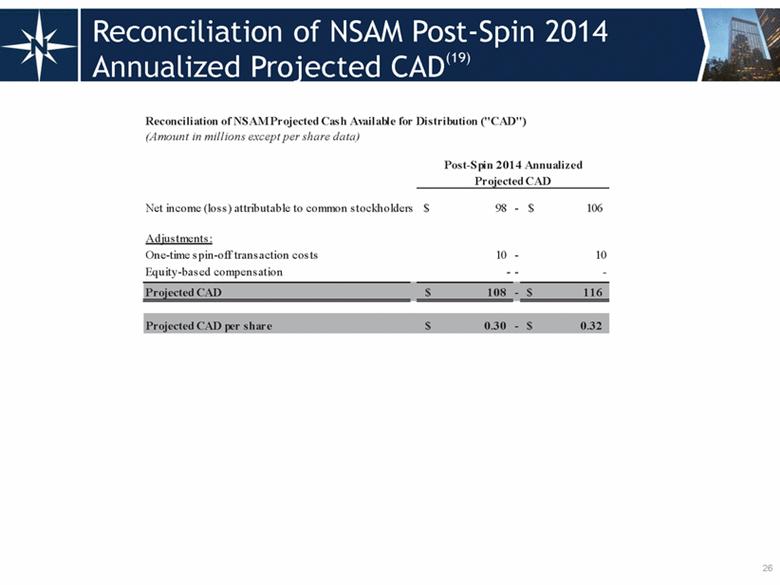
26 Reconciliation of NSAM Post-Spin 2014 Annualized Projected CAD(19) Reconciliation of NSAM Projected Cash Available for Distribution ("CAD") (Amount in millions except per share data) Post-Spin 2014 Annualized Projected CAD Net income (loss) attributable to common stockholders 98 $ - 106 $ Adjustments: One-time spin-off transaction costs 10 - 10 Equity-based compensation - - - Projected CAD 108 $ - 116 $ Projected CAD per share 0.30 $ - 0.32 $ |
|
|
27 Presentation Endnotes Overview of NRF Assets under management includes assets underlying deconsolidated debt CDOs. NRF Consistent Outperformance Compounded Annual Total Return: Based on price performance including reinvestment of dividends. Commercial Mortgage REITs includes the average of companies that had their IPO pre financial crisis: ABR, NCT, RAS and STAR. Total Return Outperformance: Commercial Mortgage REITs include average of ABR, ARI, CLNY, NCT, RAS, STAR and STWD. Data source: FactSet The incentive fee will be appropriately adjusted from time to time to take into consideration the effect of any stock split, reverse stock split or stock dividend, including the 1-for-2 reverse stock split of NRF common stock that NRF expects to effect in connection with and immediately prior to the consideration of the spin-off. Separation Analysis - Post-Spin 2014 Annualized Projected CAD NRF CAD per share and NSAM gross fees & CAD per share: Assumes the proposed spin-off of NSAM is completed during the second quarter 2014. Assumes $800 million of non-traded REIT capital raised during 2014. CAD per share amounts include common shares and LTIP units outstanding as of February 25, 2014 and assumes (i) the announced exchange offer for the 7.5% exchangeable notes is completed in full and refinanced following the spin-off and (ii) reflects all other outstanding exchangeable notes on an as converted basis. Total 2014 weighted average shares equals approximately 360 million. Assumes approximately $75 million of 2014 cash G&A expenses, allocated 80% to NSAM and 20% to NRF, and assumes post-spin 2014 annualized projected CAD for NSAM based on an effective tax rate of approximately 20%. Percentage of 2014 projected CAD: Based on NRF post-spin 2014 annualized projected gross CAD included on page 9, excluding realized discount and coupon income on NRF owned CDO bonds. Dividend yield of peer group: Based on management’s estimation of current dividend yields for comparable companies for equity REITs, new CRE-finance REITs and legacy CRE-finance REITs. NRF blended implied yield: Based on midpoint of dividend yields of peer group weighted by applicable percentage of NRF’s post-spin annualized 2014 projected gross CAD, excluding realized discounts and coupon income on NRF owned CDO bonds. |
|
|
28 Presentation Endnotes (continued) NRF Post-Spin 2014 Annualized Projected CAD: Assumes the spin-off completed during the second quarter 2014. Constitutes forward-looking information based on data as of February 25, 2014. Actual CAD and each individual line item presented herein could vary significantly from the projections presented. Real estate: Includes current manufactured housing, healthcare, office, retail and multifamily investments and a $1.05 billion healthcare real estate portfolio which NRF has entered into a term sheet to acquire. 2011-2014 loan investments & other: Represents actual investments primarily made during 2011 through February 25, 2014. NRF owned loan and security CDO bond realized discounts: Annual accretion on an effective yield basis based on expected maturity and recovery of each CDO bond. Corporate debt and preferred costs: Based on corporate debt and preferred stock outstanding as of February 25, 2014 and (i) assumes the announced exchange offer for the 7.5% exchangeable notes is completed in full and refinanced following the spin-off and (ii) reflects all other outstanding exchangeable notes on an as-converted basis. Cash G&A and management fees: Excludes any equity-based compensation and certain non-recurring items. Per share data: Includes common shares and LTIP units outstanding as of February 25, 2014 and assumes (i) the announced exchange offer for the 7.5% exchangeable notes is completed in full and refinanced following the spin-off and (ii) reflects all other outstanding exchangeable notes on an as converted basis. Total 2014 weighted average shares equals approximately 360 million. NorthStar Asset Management Comparable P/E multiples are based on stock closing prices as of February 25, 2014 and most comparable reported earnings metric to NRF’s reported CAD, and represent the average of each group. MLP GPs include AHGP, ATLS, ETE, NSH, TRGP and WGP. Small Traditional Asset Managers include APAM, CLMS, GBL, PZN and VRTS. Real Estate Asset Managers include ASPS, BAM and CNS. Data source: FactSet NRF Value Proposition Commercial mortgage REITs include ABR, ARI, BXMT, CLNY, NCT, RAS and STWD. Equity REITs composite of the FTSE NAREIT U.S. Real Estate Index. Asset Managers includes Altisource Asset Management, MLP GPs, Small Traditional Asset Managers and Real Estate Asset Managers included on page 10. Average earnings multiples predominately based on consensus 2014 earnings estimates and stock closing prices as of February 25, 2014. Data source: FactSet |

|
|
29 2013 NRF Investments Expected Current Yield: Management provides no assurances that the weighted average life or cash flow of investments will be consistent with management’s expectations or that the CDO bond repurchases, CRE loans or other investments, will payoff at par, if at all. Actual results could differ materially from expectations. CRE loan potential upside is related to NRF’s interest in the Milford Plaza hotel and retail component of the hotel. NRF Real Estate Portfolio - Healthcare Includes a $1.05 billion healthcare real estate portfolio NRF has entered into a term sheet to acquire as of February 25, 2014. There is no assurance we will be able to enter into a definitive agreement to acquire this portfolio or close the transaction on the terms anticipated, or at all. Number of units/beds: units apply to ALF/ILF property types and beds apply to SNF property types. NOI represents trailing twelve month actual net operating income at the property level for properties that NRF owned as of December 31, 2013. For the $1.05 billion portfolio that NRF has entered into a term sheet to acquire, NOI represents projected first year net operating income at the property level. NRF’s portion of the projected NOI of $150 million is expected to be approximately $125 million based on base rent from net leased properties and NOI from operating properties. NRF Real Estate Portfolio - Manufactured Housing NOI is based on trailing twelve month actuals for communities owned by NRF for the full year 2013 and annualized actual NOI from acquisition date through December 31, 2013 for communities owned by NRF for less than twelve months. Cost basis excludes pre-funded capital expenditures and our partner's subordinate capital. NRF Real Estate Portfolio - Other Implied capitalization rates for net lease portfolios based on annualized Q4 2013 property level NOI and for multifamily portfolios based on trailing twelve month actual NOI for properties owned by NRF for the full year 2013 and annualized actual NOI from acquisition date through December 31, 2013 for properties owned by NRF for less than twelve months over a percentage of NRF’s cost basis in each respective portfolio. New Loan Originations Invested equity primarily relates to loan investments made in 2011-2014 through February 25, 2014. Expected loan maturities: Source: Barclays Capital U.S. Securitization Research: CMBS - Scaling the maturity wall 8/16/13. Complied using data from US Federal Reserve, FDIC, and Barclays Capital Milford Loan example: NRF funded $109 million and NorthStar Income funded $146 million. Presentation Endnotes (continued) |
|
|
30 PE Investment II NJDOI: Pension Fund E, a common trust fund created under New Jersey statute. IRRs represent return projections beginning from reported September 30, 2012 NAV of $916 million including potential capital calls from the funds and returns on such capital. These returns are hypothetical and illustrative only. Returns assume approximate 4 year weighted average life and 9 year total life of the investment. Actual returns could be materially different and consolidated fund IRRs could be negative. PE Investments: Based on financial data reported by the underlying funds as of September 30, 2013, except as otherwise noted. Closing NAV as a percentage of net cost: Net cost represents total funded capital less distributions received. For PE Investment I, excludes any distributions in excess of contributions for funds, which represented 4% of reported NAV. Reported NAV growth: For PE Investment I and II is measured from the agreed upon reported NAV at date of acquisition, or Initial NAV. The reported NAV growth for PE Investment III is annualized based on one quarter of reported income from the Initial NAV. Implied leverage: Represents implied leverage for funds with investment-level financing, calculated as debt divided by assets at fair value. Expected remaining future capital contributions: Represents the amount of expected future capital contributions to funds as of December 31, 2013. CDO Bonds Repurchased NRF owned CDO principal amount of $608 million represents maximum principal amount NRF can receive. There is no assurance that NRF will receive that maximum amount. Shaded portions represent a range of potential recovery with the high end representing the maximum principal amount recoverable. Source: Robert A. Stanger & Co., Inc. Repurchased CDO Bond Example Based on remittance report issued on date nearest to December 31, 2013 and chart excludes cash. Economic credit support represents the principal amount of assets less the principal amount of liabilities. Below investment grade bonds include original BB bonds, equity notes and excess collateralization. Presentation Endnotes (continued) |
|
|
31 Reconciliation of NRF Projected Post-Spin Annualized 2014 Projected CAD CDO bond discounts: For CAD, realized discount on CDO bonds are accreted on an effective yield basis based on expected maturity and recovery of each CDO bond. Depreciation and amortization items: Projected 2014 CAD includes depreciation and amortization of $100 million; straight-line rental income of $(3) million; amortization of above/below market leases of $(2) million; amortization of deferred financing costs of $8 million; amortization of discounts on financings and other of $10 million; and amortization of equity-based compensation of $20 million. Projected CAD per share: Includes common shares and LTIP units outstanding as of February 25, 2014 and assumes (i) the announced exchange offer for the 7.5% exchangeable notes is completed in full and refinanced following the spin-off and (ii) reflects all other outstanding exchangeable notes on an as converted basis. Total 2014 weighted average shares equals approximately 360 million. Reconciliation of NSAM projected Post-Spin Annualized 2014 Projected CAD Equity-based compensation: NSAM is expected to have equity-based compensation expense, however, the amount is not determinable at this time. Projected CAD per share: Includes common shares and LTIP units outstanding as of February 25, 2014 and assumes (i) the announced exchange offer for the 7.5% exchangeable notes is completed in full and refinanced following the spin-off and (ii) reflects all other outstanding exchangeable notes on an as converted basis. Total 2014 weighted average shares equals approximately 360 million. Presentation Endnotes (continued) |
|
|
32 399 Park Avenue, 18th Floor, New York, NY 10022 | 212.547.2600 | NRFC.com |