Attached files
| file | filename |
|---|---|
| 8-K - 8-K - DC Industrial Liquidating Trust | d683457d8k.htm |
Exhibit 99.1

Fourth Quarter 2013
Supplemental Reporting Package
December 31, 2013
| Table of Contents
|
The following supplements Industrial Income Trust Inc.’s Annual Report on Form 10-K for the quarter ended December 31, 2013, as filed with the Securities and Exchange Commission (the “SEC”) on February 19, 2014, which is available at www.industrialincome.com. As used herein, the terms “IIT,” the “Company,” “we,” “our,” or “us” refer to Industrial Income Trust Inc.
| Overview | 2 | |||
| Quarterly Highlights | 3 | |||
| Consolidated Statements of Operations | 4 | |||
| Consolidated Balance Sheets | 5 | |||
| Consolidated Statements of Cash Flows | 6 | |||
| Funds from Operations | 7 | |||
| Selected Financial Data | 8 | |||
| Portfolio Overview | 9 | |||
| Lease Expirations & Top Customers | 11 | |||
| Acquisitions | 12 | |||
| Debt | 13 | |||
| Definitions | 14 | |||
This supplemental information contains forward-looking statements that are based on IIT’s current expectations, plans, estimates, assumptions and beliefs that involve numerous risks and uncertainties, including, without limitation, the failure of acquisitions to perform as IIT expects, IIT’s ability to successfully integrate acquired properties and operations and otherwise execute on its investment strategy, the availability of affordable financing, the availability of cash flows from operating activities for distributions and capital expenditures and those risks set forth in the “Risk Factors” section of IIT’s Annual Report on Form 10-K for the year ended December 31, 2013, as amended or supplemented by the Company’s other filings with the SEC. Any of these statements could prove to be inaccurate, and actual events or IIT’s investments and results of operations could differ materially from those expressed or implied. To the extent that IIT’s assumptions differ from actual results, IIT’s ability to meet such forward-looking statements, including its ability to consummate additional acquisitions and financings, to invest in a diversified portfolio of quality real estate investments, and to generate attractive returns for investors, may be significantly hindered. You are cautioned not to place undue reliance on any forward-looking statements. IIT cannot assure you that it will attain its investment objectives.
1
| Overview
|
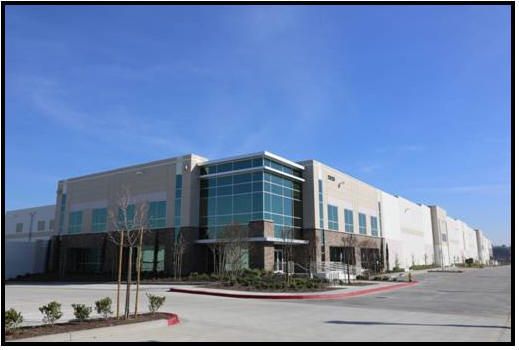
IIT is an industrial real estate investment trust that operates and selectively acquires and develops high-quality distribution warehouses that serve as key logistics centers for corporate customers. IIT’s core strategy has been to build a national platform of institutional quality industrial properties by targeting markets that have high barriers to entry, proximity to a large demographic base, and/or access to major distribution infrastructure. IIT acquired its first building on June 30, 2010.
As of December 31, 2013, IIT owned and managed a consolidated portfolio that included 296 industrial buildings totaling approximately 57.2 million square feet with 553 customers in 20 major industrial markets throughout the U.S with a weighted-average remaining lease term (based on square feet) of 5.3 years. Of the 296 industrial buildings we owned and managed as of December 31, 2013:
| • | 284 industrial buildings totaling approximately 54.8 million square feet comprised our operating portfolio, which was 94% occupied (95% leased). |
| • | 12 industrial buildings totaling approximately 2.4 million square feet comprised our development portfolio. |

Public Earnings Call
We will host a public conference call on Wednesday, March 19, 2014 to review quarterly operating and financial results for the quarter ended December 31, 2013. Dwight Merriman, Chief Executive Officer, and Tom McGonagle, Chief Financial Officer, will present operating and financial data and discuss the Company’s corporate strategy and acquisition activity. The conference call will take place at 2:15 p.m. MST and can be accessed by dialing (800) 743-9807. To access a replay of the call, contact Dividend Capital at (866) 324-7348.
Contact Information
Industrial Income Trust Inc.
518 Seventeenth Street, 17th Floor
Denver, Colorado 80202
Telephone: (303) 228-2200
Attn: Thomas G. McGonagle, Chief Financial Officer
2
| Quarterly Highlights
|
The following is an overview of our financial and operating results for the quarter ended December 31, 2013:
| • | We acquired three industrial buildings comprising approximately 0.7 million square feet for an aggregate total purchase price of approximately $44.4 million, exclusive of transfer taxes, due diligence expenses, and other closing costs. |
| • | In November 2013, we amended and restated our $140.0 million secured line of credit, which decreased the interest rate spread from LIBOR plus 2.25% to 2.75% to LIBOR plus 1.80% to 2.65% and extended the maturity date from November 2014 to January 2017. |
| • | Our net operating income(1) was $57.8 million for the quarter ended December 31, 2013, as compared to net operating income of $32.1 million for the same period in 2012. |
| • | Our adjusted net loss(3) was $4.2 million, or $0.02 per share, for the quarter ended December 31, 2013. This compares to adjusted net loss of $12.1 million, or $0.10 per share, for the same period in 2012. These results include non-recurring acquisition-related expenses of $1.1 million, or $0.01 per share, for the quarter ended December 31, 2013, and $8.5 million, or $0.07 per share, for the same period in 2012. |
| • | We had Company-defined Funds from Operations (“Company-Defined FFO”)(2) of $33.4 million, or $0.16 per share, for the quarter ended December 31, 2013, as compared to $18.7 million, or $0.15 per share, for the same period in 2012. |
We have been in the acquisition phase of our life cycle and our operating results have primarily been impacted by the timing of our acquisitions and the equity raised through our public offerings. Accordingly, our operating results for the quarters ended December 31, 2013 and 2012 are not directly comparable, nor are they indicative of those expected in future periods.
| (1) | See “Selected Financial Data” below for additional information regarding net operating income, as well as “Definitions” below for a reconciliation of net operating income to GAAP net loss. |
| (2) | See “Funds from Operations” below for a reconciliation of GAAP net loss to Company-defined FFO, as well as “Definitions” below for additional information. |
| (3) | See “Definitions” below for a reconciliation of adjusted net loss to GAAP net loss. |
3
| Consolidated Statements of Operations
|
| For the Quarter Ended December 31, |
For the Year Ended December 31, |
|||||||||||||||
| (in thousands, except per share data) |
2013 | 2012 | 2013 | 2012 | ||||||||||||
| Revenues: |
||||||||||||||||
| Rental revenues |
$ | 78,198 | $ | 42,271 | $ | 249,852 | $ | 127,893 | ||||||||
|
|
|
|
|
|
|
|
|
|||||||||
| Total revenues |
78,198 | 42,271 | 249,852 | 127,893 | ||||||||||||
|
|
|
|
|
|
|
|
|
|||||||||
| Operating expenses: |
||||||||||||||||
| Rental expenses |
20,380 | 10,137 | 64,021 | 30,674 | ||||||||||||
| Real estate-related depreciation and amortization |
36,430 | 19,932 | 121,339 | 60,479 | ||||||||||||
| General and administrative expenses |
1,768 | 1,533 | 6,882 | 5,699 | ||||||||||||
| Asset management fees, related party |
7,232 | 3,941 | 23,063 | 11,918 | ||||||||||||
| Acquisition-related expenses, related party |
516 | 5,393 | 11,477 | 12,715 | ||||||||||||
| Acquisition-related expenses |
597 | 3,147 | 12,912 | 9,186 | ||||||||||||
|
|
|
|
|
|
|
|
|
|||||||||
| Total operating expenses |
66,923 | 44,083 | 239,694 | 130,671 | ||||||||||||
|
|
|
|
|
|
|
|
|
|||||||||
| Operating income (loss) |
11,275 | (1,812 | ) | 10,158 | (2,778 | ) | ||||||||||
| Other income (expenses): |
||||||||||||||||
| Equity in loss of unconsolidated joint ventures |
(61 | ) | (1,033 | ) | (2,866 | ) | (2,944 | ) | ||||||||
| Interest expense and other |
(15,372 | ) | (9,252 | ) | (50,898 | ) | (29,021 | ) | ||||||||
| Gain (loss) on early extinguishment |
— | 37 | — | (837 | ) | |||||||||||
| Gain on acquisition of joint venture |
— | — | 26,481 | — | ||||||||||||
| Incentive fee from acquisition of joint venture |
— | — | 1,985 | — | ||||||||||||
|
|
|
|
|
|
|
|
|
|||||||||
| Total other income (expenses) |
(15,433 | ) | (10,248 | ) | (25,298 | ) | (32,802 | ) | ||||||||
| Net loss |
(4,158 | ) | (12,060 | ) | (15,140 | ) | (35,580 | ) | ||||||||
| Net loss attributable to noncontrolling interests |
— | — | — | — | ||||||||||||
|
|
|
|
|
|
|
|
|
|||||||||
| Net loss attributable to common stockholders |
$ | (4,158 | ) | $ | (12,060 | ) | $ | (15,140 | ) | $ | (35,580 | ) | ||||
|
|
|
|
|
|
|
|
|
|||||||||
| Weighted-average shares outstanding |
206,753 | 125,247 | 179,619 | 102,215 | ||||||||||||
|
|
|
|
|
|
|
|
|
|||||||||
| Net loss per common share - basic and diluted |
$ | (0.02 | ) | $ | (0.10 | ) | $ | (0.08 | ) | $ | (0.35 | ) | ||||
|
|
|
|
|
|
|
|
|
|||||||||
4
| Consolidated Balance Sheets
|
| As of December 31, | ||||||||
| ($ in thousands) |
2013 | 2012 | ||||||
| ASSETS |
|
|||||||
| Net investment in real estate properties |
$ | 3,499,570 | $ | 2,122,941 | ||||
| Investment in unconsolidated joint ventures |
8,066 | 96,490 | ||||||
| Cash and cash equivalents |
18,358 | 24,550 | ||||||
| Restricted cash |
2,813 | 1,926 | ||||||
| Straight-line rent receivable |
28,614 | 12,277 | ||||||
| Tenant receivables, net |
5,497 | 2,185 | ||||||
| Notes receivable |
3,612 | 5,912 | ||||||
| Deferred financing costs, net |
11,543 | 10,259 | ||||||
| Due from transfer agent |
— | 6,438 | ||||||
| Deferred acquisition costs |
25,390 | 4,504 | ||||||
| Other assets |
10,601 | 7,466 | ||||||
|
|
|
|
|
|||||
| Total assets |
$ | 3,614,064 | $ | 2,294,948 | ||||
|
|
|
|
|
|||||
| LIABILITIES AND EQUITY |
||||||||
| Accounts payable and accrued expenses |
$ | 35,789 | $ | 13,514 | ||||
| Tenant prepaids and security deposits |
44,719 | 20,711 | ||||||
| Intangible lease liability, net |
31,858 | 12,941 | ||||||
| Debt |
1,876,631 | 1,195,218 | ||||||
| Due to affiliates |
225 | 3,945 | ||||||
| Distributions payable |
32,301 | 19,568 | ||||||
| Other liabilities |
459 | 2,970 | ||||||
|
|
|
|
|
|||||
| Total liabilities |
2,021,982 | 1,268,867 | ||||||
| Total stockholders’ equity |
1,592,081 | 1,026,080 | ||||||
| Noncontrolling interests |
1 | 1 | ||||||
|
|
|
|
|
|||||
| Total liabilities and equity |
$ | 3,614,064 | $ | 2,294,948 | ||||
|
|
|
|
|
|||||
5
| Consolidated Statements of Cash Flows
|
| For the Year Ended December 31, |
||||||||
| ($ in thousands) |
2013 | 2012 | ||||||
| Operating activities: |
||||||||
| Net loss |
$ | (15,140 | ) | $ | (35,580 | ) | ||
| Adjustments to reconcile net loss to net cash provided by operating activities: |
||||||||
| Real estate-related depreciation and amortization |
121,339 | 60,479 | ||||||
| Equity in loss of unconsolidated joint venture |
2,866 | 2,944 | ||||||
| Loss of early extinguishment of debt |
— | 837 | ||||||
| Gain on acquisition of joint venture |
(26,481 | ) | — | |||||
| Incentive fee from acquisition of joint venture |
(1,985 | ) | — | |||||
| Straight-line rent and amortization of above- and below-market leases |
(14,108 | ) | (4,602 | ) | ||||
| Other |
714 | 1,910 | ||||||
| Changes in operating assets and liabilities |
19,683 | 1,384 | ||||||
|
|
|
|
|
|||||
| Net cash provided by operating activities |
86,888 | 27,372 | ||||||
|
|
|
|
|
|||||
| Investing activities: |
||||||||
| Real estate acquisitions |
(857,618 | ) | (1,195,002 | ) | ||||
| Acquisition of joint venture |
(126,010 | ) | — | |||||
| Acquisition deposits |
(20,716 | ) | (4,500 | ) | ||||
| Capital expenditures and development activities |
(86,388 | ) | (17,387 | ) | ||||
| Investments in unconsolidated joint ventures |
(19,804 | ) | (46,498 | ) | ||||
| Distributions from unconsolidated joint ventures |
3,754 | 11,877 | ||||||
| Other |
(494 | ) | 1,371 | |||||
|
|
|
|
|
|||||
| Net cash used in investing activities |
(1,107,276 | ) | (1,250,139 | ) | ||||
|
|
|
|
|
|||||
| Financing activities: |
||||||||
| Proceeds from issuance of mortgage notes |
91,000 | 480,953 | ||||||
| Repayments of mortgage notes |
(11,305 | ) | (2,970 | ) | ||||
| Proceeds from issuance of term loan |
300,000 | 200,000 | ||||||
| Proceeds from lines of credit |
775,000 | 836,006 | ||||||
| Repayments of lines of credit |
(725,225 | ) | (873,150 | ) | ||||
| Financing costs paid |
(3,780 | ) | (6,308 | ) | ||||
| Proceeds from issuance of common stock |
721,768 | 699,233 | ||||||
| Offering costs for issuance of common stock |
(69,640 | ) | (67,349 | ) | ||||
| Distributions paid to common stockholders |
(51,732 | ) | (28,755 | ) | ||||
| Redemptions of common stock |
(11,890 | ) | (3,277 | ) | ||||
|
|
|
|
|
|||||
| Net cash provided by financing activities |
1,014,196 | 1,234,383 | ||||||
|
|
|
|
|
|||||
| Net increase in cash and cash equivalents |
(6,192 | ) | 11,616 | |||||
| Cash and cash equivalents, at beginning of period |
24,550 | 12,934 | ||||||
|
|
|
|
|
|||||
| Cash and cash equivalents, at end of period |
$ | 18,358 | $ | 24,550 | ||||
|
|
|
|
|
|||||
6
| Funds from Operations (1)
|
Our fourth quarter 2013 Company-defined FFO was $0.16 per share, as compared to $0.15 per share for the fourth quarter 2012. There can be no assurances that the current level of Company-defined FFO will be maintained.
| For the Quarter Ended | For the Year
Ended December 31, 2013 |
|||||||||||||||||||
| (in thousands, except per share data) |
Q1 2013 | Q2 2013 | Q3 2013 | Q4 2013 | ||||||||||||||||
| Net (loss) income |
$ | (10,917 | ) | $ | (14,212 | ) | $ | 14,147 | $ | (4,158 | ) | $ | (15,140 | ) | ||||||
|
|
|
|
|
|
|
|
|
|
|
|||||||||||
| Net (loss) income per common share |
$ | (0.08 | ) | $ | (0.09 | ) | $ | 0.07 | $ | (0.02 | ) | $ | (0.08 | ) | ||||||
|
|
|
|
|
|
|
|
|
|
|
|||||||||||
| Reconciliation of net (loss) income to FFO: |
||||||||||||||||||||
| Net (loss) income |
$ | (10,917 | ) | $ | (14,212 | ) | $ | 14,147 | $ | (4,158 | ) | $ | (15,140 | ) | ||||||
| Add (deduct) NAREIT-defined adjustments: |
||||||||||||||||||||
| Real estate-related depreciation and amortization |
27,282 | 26,602 | 31,025 | 36,430 | 121,339 | |||||||||||||||
| Real estate-related depreciation and amortization of unconsolidated joint venture |
1,860 | 1,298 | 1,310 | 19 | 4,487 | |||||||||||||||
| Gain on acquisition of joint venture |
— | — | (26,481 | ) | — | (26,481 | ) | |||||||||||||
|
|
|
|
|
|
|
|
|
|
|
|||||||||||
| FFO |
$ | 18,225 | $ | 13,688 | $ | 20,001 | $ | 32,291 | $ | 84,205 | ||||||||||
|
|
|
|
|
|
|
|
|
|
|
|||||||||||
| FFO per common share |
$ | 0.13 | $ | 0.08 | $ | 0.10 | $ | 0.16 | $ | 0.47 | ||||||||||
|
|
|
|
|
|
|
|
|
|
|
|||||||||||
| Reconciliation of FFO to Company-defined FFO: |
||||||||||||||||||||
| FFO |
$ | 18,225 | $ | 13,688 | $ | 20,001 | $ | 32,291 | $ | 84,205 | ||||||||||
| Add (deduct) Company-defined adjustments: |
||||||||||||||||||||
| Acquisition costs |
2,729 | 10,573 | 9,974 | 1,113 | 24,389 | |||||||||||||||
| Acquisition costs of unconsolidated joint venture |
58 | 21 | 784 | — | 863 | |||||||||||||||
|
|
|
|
|
|
|
|
|
|
|
|||||||||||
| Company-defined FFO |
$ | 21,012 | $ | 24,282 | $ | 30,759 | $ | 33,404 | $ | 109,457 | ||||||||||
|
|
|
|
|
|
|
|
|
|
|
|||||||||||
| Company-defined FFO per common share |
$ | 0.15 | $ | 0.15 | $ | 0.15 | $ | 0.16 | $ | 0.61 | ||||||||||
|
|
|
|
|
|
|
|
|
|
|
|||||||||||
| Weighted-average shares outstanding |
141,484 | 166,255 | 203,024 | 206,753 | 179,619 | |||||||||||||||
|
|
|
|
|
|
|
|
|
|
|
|||||||||||
| For the Quarter Ended | For the Year
Ended December 31, 2012 |
|||||||||||||||||||
| (in thousands, except per share data) |
Q1 2012 | Q2 2012 | Q3 2012 | Q4 2012 | ||||||||||||||||
| Net loss |
$ | (6,862 | ) | $ | (7,933 | ) | $ | (8,725 | ) | $ | (12,060 | ) | $ | (35,580 | ) | |||||
|
|
|
|
|
|
|
|
|
|
|
|||||||||||
| Net loss per common share |
$ | (0.10 | ) | $ | (0.08 | ) | $ | (0.08 | ) | $ | (0.10 | ) | $ | (0.35 | ) | |||||
|
|
|
|
|
|
|
|
|
|
|
|||||||||||
| Reconciliation of net loss to FFO: |
||||||||||||||||||||
| Net loss |
$ | (6,862 | ) | $ | (7,933 | ) | $ | (8,725 | ) | $ | (12,060 | ) | $ | (35,580 | ) | |||||
| Add (deduct) NAREIT-defined adjustments: |
||||||||||||||||||||
| Real estate-related depreciation and amortization |
10,545 | 13,556 | 16,446 | 19,932 | 60,479 | |||||||||||||||
| Real estate-related depreciation and amortization of unconsolidated joint venture |
1,553 | 1,622 | 1,723 | 2,075 | 6,973 | |||||||||||||||
|
|
|
|
|
|
|
|
|
|
|
|||||||||||
| FFO |
$ | 5,236 | $ | 7,245 | $ | 9,444 | $ | 9,947 | $ | 31,872 | ||||||||||
|
|
|
|
|
|
|
|
|
|
|
|||||||||||
| FFO per common share |
$ | 0.07 | $ | 0.07 | $ | 0.08 | $ | 0.08 | $ | 0.31 | ||||||||||
|
|
|
|
|
|
|
|
|
|
|
|||||||||||
| Reconciliation of FFO to Company-defined FFO: |
||||||||||||||||||||
| FFO |
$ | 5,236 | $ | 7,245 | $ | 9,444 | $ | 9,947 | $ | 31,872 | ||||||||||
| Add (deduct) Company-defined adjustments: |
||||||||||||||||||||
| Acquisition costs |
3,139 | 5,389 | 4,833 | 8,540 | 21,901 | |||||||||||||||
| Acquisition costs of unconsolidated joint venture |
307 | 115 | 54 | 220 | 696 | |||||||||||||||
| (Gain) loss on early extinguishment of debt |
— | — | 874 | (37 | ) | 837 | ||||||||||||||
|
|
|
|
|
|
|
|
|
|
|
|||||||||||
| Company-defined FFO |
$ | 8,682 | $ | 12,749 | $ | 15,205 | $ | 18,670 | $ | 55,306 | ||||||||||
|
|
|
|
|
|
|
|
|
|
|
|||||||||||
| Company-defined FFO per common share |
$ | 0.12 | $ | 0.13 | $ | 0.14 | $ | 0.15 | $ | 0.54 | ||||||||||
|
|
|
|
|
|
|
|
|
|
|
|||||||||||
| Weighted-average shares outstanding |
70,648 | 100,788 | 111,966 | 125,247 | 102,215 | |||||||||||||||
|
|
|
|
|
|
|
|
|
|
|
|||||||||||
| (1) | See “Definitions” below for additional information regarding Funds from Operations (“FFO”) and Company-defined FFO. |
7
| Selected Financial Data
|
The following table presents selected consolidated financial information, which has been derived from our consolidated financial statements. The information presented below is only a summary and does not provide all of the information contained in our historical consolidated financial statements, including the related notes thereto, and as such, you should read it in conjunction with “Management’s Discussion and Analysis of Financial Condition and Results of Operations” and our consolidated financial statements and notes thereto included in our Annual Report on Form 10-K for the year ended December 31, 2013. The same store operating portfolio for the quarter ended December 31, 2013 and 2012 included 144 buildings owned as of October 1, 2012 and the same store operating portfolio for the year ended December 31, 2013 and 2012 included 91 buildings owned as of January 1, 2012.
| For the Quarter Ended December 31, |
For the Year Ended December 31, |
|||||||||||||||
| ($ in thousands, except per share data) |
2013 | 2012 | 2013 | 2012 | ||||||||||||
| Operating data: |
||||||||||||||||
| Rental revenues from same store operating properties(1) |
$ | 37,713 | $ | 37,388 | $ | 81,282 | $ | 81,249 | ||||||||
| Rental revenues from other properties(1) |
40,485 | 4,883 | 168,570 | 46,644 | ||||||||||||
|
|
|
|
|
|
|
|
|
|||||||||
| Total rental revenues |
78,198 | 42,271 | 249,852 | 127,893 | ||||||||||||
|
|
|
|
|
|
|
|
|
|||||||||
| Rental expenses from same store operating properties(1) |
9,708 | 9,034 | 21,137 | 19,704 | ||||||||||||
| Rental expenses from other properties(1) |
10,672 | 1,103 | 42,884 | 10,970 | ||||||||||||
|
|
|
|
|
|
|
|
|
|||||||||
| Total rental expenses |
20,380 | 10,137 | 64,021 | 30,674 | ||||||||||||
|
|
|
|
|
|
|
|
|
|||||||||
| NOI from same store operating properties |
28,005 | 28,354 | 60,145 | 61,545 | ||||||||||||
| NOI from other properties |
29,813 | 3,780 | 125,686 | 35,674 | ||||||||||||
|
|
|
|
|
|
|
|
|
|||||||||
| Total NOI (2) |
$ | 57,818 | $ | 32,134 | $ | 185,831 | $ | 97,219 | ||||||||
|
|
|
|
|
|
|
|
|
|||||||||
| Less straight-line rents |
$ | (6,327 | ) | $ | (2,718 | ) | $ | (17,634 | ) | $ | (8,129 | ) | ||||
| Plus amortization of above market leases, net |
781 | 893 | 3,526 | 3,527 | ||||||||||||
|
|
|
|
|
|
|
|
|
|||||||||
| Cash NOI (2) |
$ | 52,272 | $ | 30,309 | $ | 171,723 | $ | 92,617 | ||||||||
|
|
|
|
|
|
|
|
|
|||||||||
| Distributions declared per common share |
$ | 0.15625 | $ | 0.15625 | $ | 0.625 | $ | 0.625 | ||||||||
|
|
|
|
|
|
|
|
|
|||||||||
| Cash flow data: |
||||||||||||||||
| Net cash provided by operating activities |
$ | 32,161 | $ | 11,247 | $ | 86,888 | $ | 27,372 | ||||||||
| Net cash used in investing activities |
$ | (65,872 | ) | $ | (513,232 | ) | $ | (1,107,276 | ) | $ | (1,250,139 | ) | ||||
| Net cash provided by financing activities |
$ | 24,418 | $ | 510,878 | $ | 1,014,196 | $ | 1,234,383 | ||||||||
| Development activity |
$ | 6,503 | $ | 185 | $ | 47,737 | $ | 206 | ||||||||
| Tenant improvements and leasing commissions |
$ | 18,447 | $ | 4,468 | $ | 30,219 | $ | 10,522 | ||||||||
| Property maintenance and improvements |
$ | 6,340 | $ | 2,406 | $ | 8,432 | $ | 6,659 | ||||||||
|
|
|
|
|
|
|
|
|
|||||||||
| Total capital expenditures |
$ | 31,290 | $ | 7,059 | $ | 86,388 | $ | 17,387 | ||||||||
|
|
|
|
|
|
|
|
|
|||||||||
Total rental revenues increased significantly for the quarter ended December 31, 2013, as compared to the same period in 2012, primarily due to the increase in non-same store rental revenues, which was attributable to the growth in our portfolio. For the quarter ended December 31, 2013, non-same store rental revenues reflects the addition of 149 buildings we acquired since October 1, 2012. Same store rental revenues increased 0.9% from $37.4 million for the quarter ended December 31, 2012 to $37.7 million for the quarter ended December 31, 2013, primarily due to four customers leasing approximately 0.4 million square feet during the period.
Total rental expenses increased for the quarter ended December 31, 2013, as compared to the same period in 2012, primarily due to an increase in non-same store rental expenses attributable to the significant increase in the number of buildings acquired compared to the same period during 2012. Same store rental expenses increased by 7.5% from $9.0 million for the quarter ended December 31, 2012 to $9.7 million for the quarter ended December 31, 2013, primarily due to expenses incurred for increased maintenance and real estate taxes.
| (1) | See “Definitions” below for additional information regarding “same store operating properties” and “other properties.” |
| (2) | See “Definitions” below for a reconciliation of net operating income to GAAP net loss and for a reconciliation of cash net operating income to GAAP net loss. |
8
| Portfolio Overview
|
During 2013, we continued to expand and strengthen our presence in our target markets by acquiring primarily quality, functional industrial buildings with generic features designed for flexibility and for high acceptance by a wide range of customers. As of December 31, 2013, the weighted-average age of our buildings (based on square feet) was 13.7 years.
| As of December 31, | ||||||||||||
| (square feet in thousands) |
2013 | 2012 | 2011 | |||||||||
| Portfolio data: |
||||||||||||
| Number of consolidated buildings |
296 | 190 | 94 | |||||||||
| Number of unconsolidated buildings (1) |
1 | 29 | 18 | |||||||||
|
|
|
|
|
|
|
|||||||
| Total number of buildings |
297 | 219 | 112 | |||||||||
|
|
|
|
|
|
|
|||||||
| Rentable square feet of consolidated buildings |
57,230 | 36,898 | 15,787 | |||||||||
| Rentable square feet of unconsolidated buildings (1) |
180 | 6,181 | 4,295 | |||||||||
|
|
|
|
|
|
|
|||||||
| Total rentable square feet |
57,410 | 43,079 | 20,082 | |||||||||
|
|
|
|
|
|
|
|||||||
| Total number of customers |
553 | 414 | 254 | |||||||||
| Percent occupied of operating portfolio |
94 | % | 95 | % | 98 | % | ||||||
| Percent occupied of total portfolio |
91 | % | 90 | % | 92 | % | ||||||
| Percent leased of operating portfolio |
95 | % | 96 | % | 98 | % | ||||||
| Percent leased of total portfolio |
93 | % | 92 | % | 92 | % | ||||||
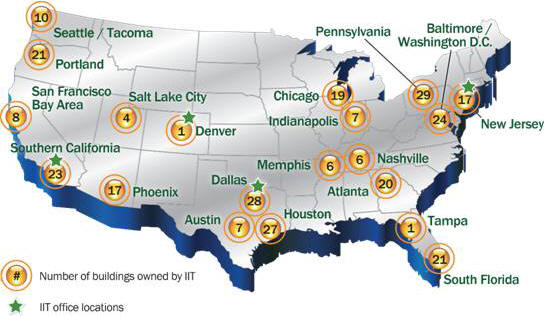
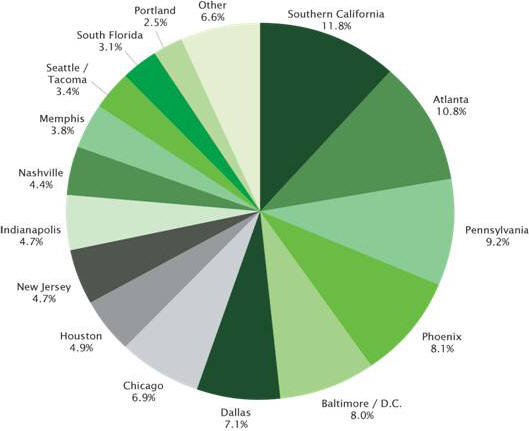
Market by Total Rentable Square Feet
as of December 31, 2013
| (1) | In September 2013, we acquired our partner’s equity interest in the IIT North American Industrial Fund I Partnership (“Fund I Partnership”) joint venture. As of the date of the acquisition, the Fund I Partnership included 31 buildings aggregating approximately 7.2 million square feet. |
9
| Portfolio Overview
|
As of December 31, 2013, we owned and managed a well-diversified industrial portfolio located in 20 major industrial markets throughout the U.S. Approximately 36%, 34%, and 30% of our portfolio was located in the East, Central, and West regions of the U.S., respectively.
| ($ and square feet in thousands) |
Number of Buildings |
Rentable Square Feet |
Occupied Rate |
Leased Rate |
Annualized Base Rent |
Percent of Total Annualized Base Rent |
||||||||||||||||||
| Operating Properties: |
||||||||||||||||||||||||
| Atlanta |
20 | 6,206 | 88.3 | % | 88.9 | % | $ | 16,817 | 7.3 | % | ||||||||||||||
| Austin |
7 | 748 | 97.4 | 97.4 | 4,193 | 1.8 | ||||||||||||||||||
| Baltimore / D.C. |
24 | 4,550 | 94.6 | 94.6 | 21,608 | 9.3 | ||||||||||||||||||
| Chicago |
19 | 3,967 | 81.6 | 81.6 | 14,625 | 6.3 | ||||||||||||||||||
| Dallas |
27 | 3,746 | 93.3 | 96.0 | 14,870 | 6.4 | ||||||||||||||||||
| Denver |
1 | 554 | 100.0 | 100.0 | 3,348 | 1.4 | ||||||||||||||||||
| Houston |
27 | 2,803 | 88.1 | 89.0 | 12,527 | 5.4 | ||||||||||||||||||
| Indianapolis |
7 | 2,698 | 100.0 | 100.0 | 11,908 | 5.1 | ||||||||||||||||||
| Memphis |
6 | 2,176 | 90.8 | 90.8 | 5,615 | 2.4 | ||||||||||||||||||
| Nashville |
6 | 2,531 | 100.0 | 100.0 | 8,918 | 3.9 | ||||||||||||||||||
| New Jersey |
11 | 2,074 | 94.4 | 94.4 | 10,633 | 4.6 | ||||||||||||||||||
| Pennsylvania |
29 | 5,249 | 96.9 | 96.9 | 22,553 | 9.7 | ||||||||||||||||||
| Phoenix |
17 | 4,646 | 97.4 | 97.4 | 23,178 | 10.0 | ||||||||||||||||||
| Portland |
21 | 1,423 | 89.7 | 89.7 | 6,861 | 3.0 | ||||||||||||||||||
| Salt Lake City |
4 | 1,140 | 97.9 | 97.9 | 5,200 | 2.2 | ||||||||||||||||||
| San Francisco Bay Area |
7 | 1,084 | 97.4 | 97.4 | 5,339 | 2.3 | ||||||||||||||||||
| Seattle / Tacoma |
9 | 1,509 | 92.5 | 99.6 | 5,782 | 2.5 | ||||||||||||||||||
| South Florida |
20 | 1,607 | 97.5 | 97.5 | 11,337 | 4.9 | ||||||||||||||||||
| Southern California |
21 | 5,936 | 100.0 | 100.0 | 22,177 | 9.6 | ||||||||||||||||||
| Tampa |
1 | 147 | 100.0 | 100.0 | 943 | 0.4 | ||||||||||||||||||
|
|
|
|
|
|
|
|
|
|
|
|
|
|||||||||||||
| Subtotal Operating |
284 | 54,794 | 94.1 | 94.6 | 228,432 | 98.5 | ||||||||||||||||||
|
|
|
|
|
|
|
|
|
|
|
|
|
|||||||||||||
| Development Properties: |
||||||||||||||||||||||||
| Dallas |
1 | 301 | — | 100.0 | — | — | ||||||||||||||||||
| New Jersey |
6 | 637 | 46.4 | 46.4 | 2,764 | 1.2 | ||||||||||||||||||
| San Francisco Bay Area |
1 | 85 | 38.8 | 38.8 | 277 | 0.1 | ||||||||||||||||||
| Seattle / Tacoma |
1 | 441 | 86.5 | 86.5 | 371 | 0.2 | ||||||||||||||||||
| South Florida |
1 | 186 | — | 100.0 | — | — | ||||||||||||||||||
| Southern California |
2 | 786 | — | — | — | — | ||||||||||||||||||
|
|
|
|
|
|
|
|
|
|
|
|
|
|||||||||||||
| Subtotal Development |
12 | 2,436 | 29.2 | 49.1 | 3,412 | 1.5 | ||||||||||||||||||
|
|
|
|
|
|
|
|
|
|
|
|
|
|||||||||||||
| Total Portfolio |
296 | 57,230 | 91.3 | % | 92.6 | % | $ | 231,844 | 100.0 | % | ||||||||||||||
|
|
|
|
|
|
|
|
|
|
|
|
|
|||||||||||||
10
| Lease Expirations & Top Customers
|
We continue to expand our portfolio and diversify our customer base. As of December 31, 2013, we had 296 industrial buildings occupied by 553 customers with 607 leases, up from 219 industrial buildings occupied by 414 customers with 449 leases as of December 31, 2012.
Lease Expirations
During 2013, we leased approximately 8.5 million square feet, including 5.1 million square feet of new leases and expansions and 3.4 million square feet of renewals and future leases. Future leases are new leases for units that are entered into while the units are occupied by the current customer. Expansions represented approximately 6.2% of the total leasing activity for the year ended December 31, 2013.
| ($ and square feet in thousands) |
Number of Leases |
Occupied Square Feet |
Percent of Total Occupied Square Feet |
Annualized Base Rent |
Percent of Total Annualized Base Rent |
|||||||||||||||
|
2014(1) |
100 | 5,389 | 10.3 | % | $ | 24,276 | 10.5 | % | ||||||||||||
| 2015 |
115 | 5,246 | 10.0 | 25,029 | 10.8 | |||||||||||||||
| 2016 |
90 | 5,970 | 11.4 | 27,433 | 11.8 | |||||||||||||||
| 2017 |
80 | 4,582 | 8.8 | 22,318 | 9.6 | |||||||||||||||
| 2018 |
73 | 7,708 | 14.8 | 31,650 | 13.7 | |||||||||||||||
| 2019 |
43 | 5,307 | 10.2 | 26,220 | 11.3 | |||||||||||||||
| 2020 |
27 | 2,981 | 5.7 | 12,728 | 5.5 | |||||||||||||||
| 2021 |
20 | 4,772 | 9.1 | 21,063 | 9.1 | |||||||||||||||
| 2022 |
20 | 3,910 | 7.5 | 17,495 | 7.5 | |||||||||||||||
| 2023 |
18 | 1,558 | 3.0 | 5,778 | 2.5 | |||||||||||||||
| Thereafter |
21 | 4,824 | 9.2 | 17,854 | 7.7 | |||||||||||||||
|
|
|
|
|
|
|
|
|
|
|
|||||||||||
| Total occupied |
607 | 52,247 | 100.0 | % | $ | 231,844 | 100.0 | % | ||||||||||||
|
|
|
|
|
|
|
|
|
|
|
|||||||||||
Customers
Of the 553 customers as of December 31, 2013, there were no customers that individually represented more than 10% of total annualized base rent or total occupied square feet. The following table reflects our 10 largest customers, based on annualized base rent, which occupied a combined 12.5 million square feet as of December 31, 2013:
| Customer |
Percent
of Total Annualized Base Rent |
Percent of Total Occupied Square Feet |
||||||
| Amazon.com, LLC |
5.9 | % | 4.7 | % | ||||
| Home Depot USA INC. |
4.4 | 4.5 | ||||||
| Hanesbrands, Inc. |
2.6 | 2.5 | ||||||
| Belkin International |
2.3 | 1.5 | ||||||
| CEVA Logistics U.S. |
2.2 | 2.7 | ||||||
| Solo Cup Company |
1.9 | 3.1 | ||||||
| United Natural Foods, Inc. |
1.5 | 1.1 | ||||||
| GlaxoSmithKlein |
1.4 | 1.2 | ||||||
| Harbor Freight Tools |
1.1 | 1.5 | ||||||
| Bunzl Distribution USA, Inc. |
1.1 | 1.1 | ||||||
|
|
|
|
|
|||||
| Total |
24.4 | % | 23.9 | % | ||||
|
|
|
|
|
|||||
| (1) | Includes month-to-month leases. |
11
|
Acquisitions
|
We completed the following acquisition activities during the year ended December 31, 2013:
| • | Acquired 75 industrial buildings comprising approximately 13.1 million square feet for an aggregate purchase price of approximately $896.1 million, exclusive of transfer taxes, due diligence expenses, and other closing costs. See table below for additional detail. |
| • | On September 17, 2013, we purchased the remaining 49% interest in the Fund I Partnership for approximately $129.6 million of cash, as well as assumed the Fund I Partnership’s debt in the amount of approximately $241.3 million. This resulted in us owning 100% of the 31 industrial buildings aggregating approximately 7.2 million square feet that had been acquired by the Fund I Partnership, with an implied aggregate fair value of approximately $510.6 million for the properties at acquisition date. |
| ($ in thousands) |
Acquisition Date |
Market | Number of Buildings |
Occupancy Rate at Acquisition |
Rentable Square Feet |
Total Purchase Price(1) |
||||||||||||||
| Clifton Distribution Center |
2/6/2013 | New Jersey | 1 | 100 | % | 231,000 | $ | 26,100 | ||||||||||||
| Hayward Distribution Center |
2/14/2013 | San Francisco Bay | 1 | 100 | 102,000 | 9,600 | ||||||||||||||
| Valley View Business Center |
3/25/2013 | Dallas | 2 | 100 | 209,000 | 12,200 | ||||||||||||||
| York Distribution Center II |
3/27/2013 | Pennsylvania | 1 | 100 | 603,000 | 31,671 | ||||||||||||||
| Andover Distribution Center |
3/29/2013 | Seattle / Tacoma | 2 | 100 | 163,000 | 12,050 | ||||||||||||||
| Marina West Distribution Center II |
4/2/2013 | South Florida | 3 | 100 | 402,000 | 39,400 | ||||||||||||||
| Beltway Cross Distribution Center |
4/9/2013 | Houston | 4 | 96 | 491,000 | 38,250 | ||||||||||||||
| Gwinnett Distribution Center |
4/24/2013 | Atlanta | 2 | 96 | 317,000 | 12,000 | ||||||||||||||
| Bluegrass Distribution Center I & II |
4/24/2013 | Atlanta | 4 | 97 | 389,000 | 28,000 | ||||||||||||||
| Northpointe Distribution Center |
4/30/2013 | Baltimore / D.C. | 2 | 87 | 83,000 | 9,625 | ||||||||||||||
| Fremont Distribution Center II |
5/6/2013 | San Francisco Bay | 1 | 100 | 174,000 | 13,500 | ||||||||||||||
| Broadway 101 Commerce Center |
5/15/2013 | Phoenix | 11 | 84 | 808,000 | 77,002 | ||||||||||||||
| Lakeview Business Center |
5/15/2013 | South Florida | 7 | 97 | 210,000 | 17,450 | ||||||||||||||
| South San Francisco Distribution Center II |
5/23/2013 | San Francisco Bay | 1 | 100 | 85,000 | 9,950 | ||||||||||||||
| Iron Run Distribution Center |
6/6/2013 | Pennsylvania | 1 | 100 | 125,000 | 8,000 | ||||||||||||||
| Buckeye Distribution Center |
6/7/2013 | Phoenix | 2 | 100 | 684,000 | 44,300 | ||||||||||||||
| Valley Crossings Distribution Center |
6/13/2013 | Pennsylvania | 1 | 100 | 270,000 | 16,550 | ||||||||||||||
| Artesia Distribution Center |
6/26/2013 | Southern California | 1 | 100 | 152,000 | 14,801 | ||||||||||||||
| Carlisle Distribution Center |
6/26/2013 | Pennsylvania | 2 | 100 | 694,000 | 40,700 | ||||||||||||||
| Greenwood Distribution Center |
6/28/2013 | Indianapolis | 1 | 100 | 450,000 | 15,725 | ||||||||||||||
| Nashville Portfolio |
6/28/2013 | Nashville | 3 | 100 | 1,098,000 | 49,050 | ||||||||||||||
| Eastern Logistics Portfolio |
8/1/2013 | Pennsylvania, Atlanta | 3 | 100 | 802,000 | 46,000 | ||||||||||||||
| Randall Crossing Distribution Center |
8/2/2013 | Chicago | 1 | 100 | 100,000 | 7,550 | ||||||||||||||
| Waterfront Distribution Center |
8/7/2013 | New Jersey | 1 | 100 | 151,000 | 13,500 | ||||||||||||||
| Beckwith Farms Distribution Center I |
8/15/2013 | Nashville | 1 | 100 | 707,000 | 33,300 | ||||||||||||||
| Fairfield Portfolio |
8/27/2013 | New Jersey | 7 | 55 | 730,000 | 80,273 | ||||||||||||||
| Kent Valley Distribution Center IV |
8/28/2013 | Seattle / Tacoma | 1 | 94 | 115,000 | 10,150 | ||||||||||||||
| South Bay Distribution Center |
8/29/2013 | Southern California | 1 | — | 265,000 | 33,608 | ||||||||||||||
| Beckwith Farms Distribution Center II & III |
8/30/2013 | Nashville | 2 | 100 | 728,000 | 22,500 | ||||||||||||||
| Landover Distribution Center |
9/11/2013 | Baltimore / D.C. | 1 | 100 | 507,000 | 32,530 | ||||||||||||||
| Denver Distribution Center |
9/13/2013 | Denver | 1 | 100 | 554,000 | 46,350 | ||||||||||||||
| Auburn Distribution Center |
10/1/2013 | Seattle / Tacoma | 1 | 100 | 283,000 | 24,750 | ||||||||||||||
| Capital Beltway Commerce Center |
10/23/2013 | Baltimore / D.C. | 1 | 100 | 114,000 | 7,400 | ||||||||||||||
| Northpoint Commerce Center |
12/12/2013 | Dallas | 1 | — | 301,000 | 12,291 | ||||||||||||||
|
|
|
|
|
|
|
|
||||||||||||||
| Total properties |
75 | 86 | % | 13,097,000 | $ | 896,126 | ||||||||||||||
|
|
|
|
|
|
|
|
||||||||||||||
| Fund I Partnership (2) |
9/17/2013 | Various | 31 | 76 | % | 7,239,000 | $ | 510,550 | ||||||||||||
|
|
|
|
|
|
|
|
||||||||||||||
| (1) | Reflects contract purchase price, and excludes land acquisitions of approximately $21.1 million. |
| (2) | Prior to the transaction and the resulting consolidation of the Fund I Partnership, we had included certain operating data of the Fund I Partnership in our total portfolio metrics for the periods the properties were originally acquired by the Fund I Partnership. The purchase price of $510.6 million is the implied aggregate fair value for the properties at acquisition date. The fair value of our equity interest in the Fund I partnership immediately before the acquisition date was approximately $136.2 million. |
12
| Debt
|
Summary of Consolidated Debt
As of December 31, 2013, we had approximately $1.9 billion of consolidated indebtedness, which was comprised of borrowings under our lines of credit and unsecured term loans, and our mortgage note financings. Our consolidated debt had a weighted-average remaining term of approximately 5.9 years. The following is a summary of our consolidated debt as of December 31, 2013:
| ($ in thousands) |
Stated Interest Rate as of December 31, 2013 |
Maturity Date | Balance as of December 31, 2013 |
|||||||
| Lines of credit |
2.21 | % | August 2015 - January 2017 | $ | 250,000 | |||||
| Unsecured term loans(1) |
2.03 | % | January 2018 - January 2019 | 500,000 | ||||||
| Fixed-rate mortage notes |
4.26 | % | June 2015 - November 2024 | 1,117,551 | ||||||
| Variable-rate mortgage note |
2.19 | % | May 2015 | 9,080 | ||||||
|
|
|
|
|
|||||||
| Total / weighted-average mortgage notes |
4.25 | % | 1,126,631 | |||||||
|
|
|
|
|
|||||||
| Total / weighted-average consolidated debt |
3.39 | % | $ | 1,876,631 | ||||||
|
|
|
|
|
|||||||
| Fixed-rate debt |
4.26 | % | 60 | % | ||||||
| Variable-rate debt |
2.09 | % | 40 | % | ||||||
|
|
|
|
|
|||||||
| Total / weighted-average |
3.39 | % | 100 | % | ||||||
|
|
|
|
|
|||||||
Scheduled Principal Payments of Debt
As of December 31, 2013, the principal payments due on our consolidated debt during each of the next five years and thereafter were as follows:
| ($ in thousands) |
Lines of Credit (2) | Unsecured Term Loans |
Mortgage Notes |
Total | ||||||||||||
| 2014 |
$ | — | $ | — | $ | 6,772 | $ | 6,772 | ||||||||
| 2015 |
165,000 | — | 52,980 | 217,980 | ||||||||||||
| 2016 |
— | — | 20,040 | 20,040 | ||||||||||||
| 2017 |
85,000 | — | 62,175 | 147,175 | ||||||||||||
| 2018 |
— | 200,000 | 151,918 | 351,918 | ||||||||||||
| Thereafter |
— | 300,000 | 826,557 | 1,126,557 | ||||||||||||
|
|
|
|
|
|
|
|
|
|||||||||
| Total principal payments |
250,000 | 500,000 | 1,120,442 | 1,870,442 | ||||||||||||
| Unamortized premium on assumed debt |
— | — | 6,189 | 6,189 | ||||||||||||
|
|
|
|
|
|
|
|
|
|||||||||
| Total |
$ | 250,000 | $ | 500,000 | $ | 1,126,631 | $ | 1,876,631 | ||||||||
|
|
|
|
|
|
|
|
|
|||||||||
| (1) | We entered into LIBOR-based forward-starting interest rate swap agreements to hedge LIBOR on the unsecured term loans. For the $200.0 million unsecured term loan, the forward-starting interest rate swaps have an effective date of January 14, 2014; will fix LIBOR at 0.98%, with an all-in interest rate ranging from 2.68% to 3.43%, depending on our consolidated leverage ratio; and will expire in October 2017. For the $300.0 million unsecured term loan, the forward-starting interest rate swaps have an effective date of January 20, 2015; will fix LIBOR at 1.81%, with an all-in interest rate ranging from 3.31% to 4.16%, depending on our consolidated leverage ratio; and will expire in October 2018. |
| (2) | Both lines of credit may be extended pursuant to two one-year extension options, subject to certain conditions. |
13
| Definitions
|
Annualized Base Rent. Annualized base rent is calculated as monthly base rent including the impact of any contractual tenant concessions (cash basis) per the terms of the lease as of December 31, 2013, multiplied by 12.
Adjusted Net Loss. We define adjusted net loss as GAAP net loss less gains and losses on sales of assets. We consider adjusted net loss to be an appropriate supplemental performance measure, as we believe it provides useful information to our investors regarding the comparability of our results of operations by excluding certain items that are considered to be non-recurring, such as gains and losses on sales of assets. However, adjusted net loss should not be viewed as an alternative measure of our financial performance since it excludes such gains and losses, which could materially impact our results of operations. Therefore, we believe net loss, as defined by GAAP, to be the most appropriate GAAP measure to evaluate our overall performance. Refer to the reconciliation below of our GAAP net loss to adjusted net loss.
| For the Quarter Ended December 31, |
For the Year Ended December 31, |
|||||||||||||||
| ($ in thousands) |
2013 | 2012 | 2013 | 2012 | ||||||||||||
| GAAP net loss |
$ | (4,158 | ) | $ | (12,060 | ) | $ | (15,140 | ) | $ | (35,580 | ) | ||||
| Gain on acquisition of joint venture |
— | — | (26,481 | ) | — | |||||||||||
|
|
|
|
|
|
|
|
|
|||||||||
| Adjusted net loss |
$ | (4,158 | ) | $ | (12,060 | ) | $ | (41,621 | ) | $ | (35,580 | ) | ||||
|
|
|
|
|
|
|
|
|
|||||||||
Consolidated Portfolio. The consolidated portfolio excludes properties owned through our unconsolidated joint ventures.
Development Portfolio. The development portfolio includes buildings acquired with the intention to reposition or redevelop, or buildings recently completed which have not yet reached stabilization. We generally consider a building to be stabilized on the earlier to occur of the first anniversary of a building’s completion or a building achieving 90% occupancy.
Funds from Operations (“FFO”) and Company-Defined FFO. We believe that FFO and Company-defined FFO, in addition to net loss and cash flows from operating activities, as defined by GAAP, are useful supplemental performance measures that our management uses to evaluate our consolidated operating performance. However, these supplemental, non-GAAP measures should not be considered as an alternative to net loss or to cash flows from operating activities as an indication of our performance and are not intended to be used as a liquidity measure indicative of cash flow available to fund our cash needs, including our ability to make distributions to our stockholders. No single measure can provide users of financial information with sufficient information and only our disclosures read as a whole can be relied upon to adequately portray our financial position, liquidity, and results of operations. In addition, other REITs may define FFO and similar measures differently and choose to treat acquisition-related costs and potentially other accounting line items in a manner different from us due to specific differences in investment and operating strategy or for other reasons.
FFO. As defined by the National Association of Real Estate Investment Trusts (“NAREIT”), FFO is a non-GAAP measure that excludes certain items such as real estate-related depreciation and amortization and gains or losses on sales of assets. We believe FFO is a meaningful supplemental measure of our operating performance that is useful to investors because depreciation and amortization in accordance with GAAP implicitly assumes that the value of real estate assets diminishes predictably over time. In addition, FFO adjusts for non-recurring gains or losses on the acquisition of certain joint venture properties. We use FFO as an indication of our consolidated operating performance and as a guide to making decisions about future investments.
Company-defined FFO. Similar to FFO, Company-defined FFO is a non-GAAP measure that excludes real estate-related depreciation and amortization and gains or losses on sales of assets, and also excludes non-recurring acquisition-related costs (including acquisition fees paid to the Advisor) and a non-recurring loss from the early extinguishment of debt, each of which are characterized as expenses in determining net loss under GAAP. The purchase of operating properties is a key strategic objective of our business plan focused on generating growth in operating income and cash flow in order to make distributions to investors. However, as the corresponding acquisition-related costs are paid in cash, all paid and accrued acquisition-related costs negatively impact our operating performance and cash flows from operating activities during the period in which properties are acquired. In addition, if we acquire a property after all offering proceeds from our public offerings have been invested, there will not be any offering proceeds to pay the corresponding acquisition-related costs. Accordingly, unless the Advisor determines to waive the payment or reimbursement of these acquisition-related costs, then such costs will be paid from additional debt, operational earnings or cash flow, net proceeds from the sale of properties, or ancillary cash flows. As such, Company-defined FFO may not be a complete indicator of our operating performance, especially during periods in which properties are being acquired, and may not be a useful measure of the long-term operating performance of our properties if we do not continue to operate our business plan as disclosed.
14
| Definitions
|
We have been in the acquisition phase of our life cycle. Management does not include historical acquisition-related expenses in its evaluation of future operating performance, as such costs are not expected to be incurred once our acquisition phase is complete. In addition, management does not include a non-recurring loss from the early extinguishment of debt in its evaluation of future operating performance as the transaction that resulted in the loss was driven by factors relating to the capital markets, rather than factors specific to the on-going operating performance of our properties. We use Company-defined FFO to, among other things: (i) evaluate and compare the potential performance of the portfolio after the acquisition phase is complete, and (ii) evaluate potential performance to determine liquidity event strategies. We believe Company-defined FFO facilitates a comparison to other REITs that are not engaged in significant acquisition activity and have similar operating characteristics as us. We believe investors are best served if the information that is made available to them allows them to align their analyses and evaluation with the same performance metrics used by management in planning and executing our business strategy. We believe that these performance metrics will assist investors in evaluating the potential performance of the portfolio after the completion of the acquisition phase. However, these supplemental, non-GAAP measures are not necessarily indicative of future performance and should not be considered as an alternative to net loss or to cash flows from operating activities and are not intended to be used as a liquidity measure indicative of cash flow available to fund our cash needs. Neither the SEC, NAREIT, nor any regulatory body has passed judgment on the acceptability of the adjustments used to calculate Company-defined FFO. In the future, the SEC, NAREIT, or a regulatory body may decide to standardize the allowable adjustments across the non-traded REIT industry at which point we may adjust our calculation and characterization of Company-defined FFO.
GAAP. Generally accepted accounting principles used in the United States.
Net Operating Income (“NOI”) and Cash NOI. We define (i) NOI as GAAP rental revenues less GAAP rental expenses and (ii) cash NOI as NOI (as previously defined), excluding non-cash amounts recorded for straight-line rents and the amortization of above and below market leases. We consider NOI and cash NOI to be appropriate supplemental performance measures. We believe NOI and cash NOI provide useful information to our investors regarding our financial condition and results of operations because NOI and cash NOI reflect the operating performance of our properties and exclude certain items that are not considered to be controllable in connection with the management of the properties, such as real estate-related depreciation and amortization, acquisition-related expenses, general and administrative expenses, and interest expense. However, NOI and cash NOI should not be viewed as alternative measures of our financial performance since it excludes such expenses, which could materially impact our results of operations. Further, our NOI and cash NOI may not be comparable to that of other real estate companies as they may use different methodologies for calculating NOI and cash NOI. Therefore, we believe net loss, as defined by GAAP, to be the most appropriate GAAP measure to evaluate our overall performance. Refer to the reconciliation below of our GAAP net loss to NOI and cash NOI.
| For the Quarter Ended December 31, |
For the Year Ended December 31, |
|||||||||||||||
| ($ in thousands) |
2013 | 2012 | 2013 | 2012 | ||||||||||||
| GAAP net loss |
$ | (4,158 | ) | $ | (12,060 | ) | $ | (15,140 | ) | $ | (35,580 | ) | ||||
| Real estate-related depreciation and amortization |
36,430 | 19,932 | 121,339 | 60,479 | ||||||||||||
| General and administrative expenses |
1,768 | 1,533 | 6,882 | 5,699 | ||||||||||||
| Asset management fees |
7,232 | 3,941 | 23,063 | 11,918 | ||||||||||||
| Acquisition costs |
1,113 | 8,540 | 24,389 | 21,901 | ||||||||||||
| Other expenses |
15,433 | 10,248 | 25,298 | 32,802 | ||||||||||||
|
|
|
|
|
|
|
|
|
|||||||||
| NOI |
$ | 57,818 | $ | 32,134 | $ | 185,831 | $ | 97,219 | ||||||||
|
|
|
|
|
|
|
|
|
|||||||||
| Straight-line rents |
(6,327 | ) | (2,718 | ) | (17,634 | ) | (8,129 | ) | ||||||||
| Amortization of above market leases, net |
781 | 893 | 3,526 | 3,527 | ||||||||||||
|
|
|
|
|
|
|
|
|
|||||||||
| Cash NOI |
$ | 52,272 | $ | 30,309 | $ | 171,723 | $ | 92,617 | ||||||||
|
|
|
|
|
|
|
|
|
|||||||||
15
| Definitions
|
Occupied Rate / Leased Rate. The occupied rate reflects the square footage with a paying customer in place. The leased rate includes the occupied square footage and additional square footage with leases in place that have not yet commenced.
Operating Portfolio. The operating portfolio includes stabilized properties.
Same Store Operating Properties. The same store portfolio includes operating properties owned for the entirety of both the current year period and prior year period for which the operations have been stabilized. Properties that do not meet the same store criteria are included in “other properties” in “Selected Financial Data” above. The same store operating portfolio for the quarter ended December 31, 2013 and 2012 included 144 buildings owned as of October 1, 2012, and the same store operating portfolio for the year ended December 31, 2013 and 2012 included 91 buildings owned as of January 1, 2012.
16