Attached files
| file | filename |
|---|---|
| 8-K - FORM 8-K - ANI PHARMACEUTICALS INC | v370119_8k.htm |
A Specialty Pharmaceutical Company NASDAQ: ANIP HIGH POTENCY DRUGS – NARCOTIC DRUGS – RX LIQUIDS AND TABLETS – CONTRACT MANUFACTURING Corporate Presentation March 2014
2 Cautionary Statement Concerning Forward - Looking Statements This presentation may contain forward - looking statements under the Private Securities Litigation Reform Act of 1995. Such statements include, but are not limited to, statements about the Company’s plans, objectives, expectations and intentions with respect to future operations and products, the anticipated financial position, operating results and growth prospects of the Company and other statements that are not historical in nature, particularly those that utilize terminology such as “anticipates,” “will,” “expects,” “plans,” “potential,” “future,” “believes,” “intends,” “continue,” othe r words of similar meaning, derivations of such words and the use of future dates. Forward - looking statements by their nature address matters that are, to different degrees, uncertain. Uncertainties and risks may cause the Company’s actual results to be materially different than those expressed in or implied by such forward - looking statements. Uncertainties and risks may cause the Company’s actual results to be materially different than those expressed in or implied by such forward - looking statements. Uncertainties and risks include, but are not limited to, the risk that the Company may in the future face increased difficulty in importing raw materials and/or increased competition, for its Esterified Estrogen with Methyltestosterone Tablet product; competitive conditions for the Company's other products may intensify; the Company may be required to seek the approval of the U.S. Food and Drug Administration ("FDA") for its unapproved products or withdraw such products from the market; general business and economic conditions; the Company’s expectations regarding trends in markets for the Company’s current and planned products; the Company’s future cash flow and its ability to support its operations; the Company’s ability to obtain additional financing as needed; the difficulty of developing pharmaceutical products, obtaining regulatory and other approvals and achieving market acceptance of such products; and the marketing success of the Company’s licensees or sublicensees . More detailed information on these and additional factors that could affect the Company’s actual results are described in the Company’s filings with the Securities and Exchange Commission, including its most recent annual report on Form 10 - K filed with the Securities and Exchange Commission February 28, 2014. All forward - looking statements in this presentation speak only as of the date made and are based on the Company’s current beliefs and expectations. The Company undertakes no obligation to update or revise any forward - looking statement, whether as a result of new information, future events or otherwise. 2

3 3 Leadership – Deep Industry Experience Senior Management ANI Since Previous Affiliation Arthur S. Przybyl, CEO 2009 Akorn (NASDAQ: AKRX) Charlotte C. Arnold, CFO 2009 MVP Capital Partners Robert J. Jamnick, VP Quality and PD 2007 Solvay James G. Marken, VP Operations 2007 Solvay Robert W. Schrepfer, VP BD 2013 Healthcare Value Capital Gary L. Cannizaro, Senior Dir. National Accounts 2005 Akorn (NASDAQ: AKRX) Board of Directors Member Since Current Affiliation Robert E. Brown, Jr. Chairman 2009 MVP Capital Partners Arthur S. Przybyl, CEO 2009 ANI Pharmaceuticals Fred Holubow 2013 William Harris Investors Ross Mangano 2013 Oliver Estate Tracy Marshbanks 2006 First Analysis Thomas A. Penn 2009 MVP Capital Partners Daniel Raynor 2013 Argentum

4 4 ANI Mission Statement ANI Pharmaceuticals is an integrated specialty pharmaceutical company developing, manufacturing and marketing branded and generic prescription pharmaceuticals. ANI’s mission is to develop, manufacture, and market niche generic pharmaceuticals, focusing on opportunities in pain management (narcotics), anti - cancer (oncolytics), women’s health (hormones and steroids), and complex formulations including extended release and combination products.
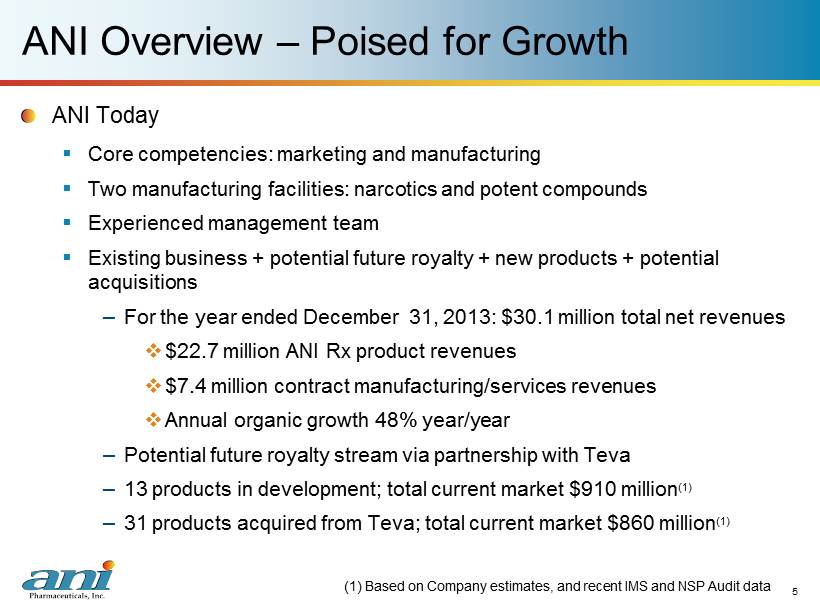
5 ANI Overview – Poised for Growth ANI Today ▪ Core competencies: marketing and manufacturing ▪ Two manufacturing facilities: narcotics and potent compounds ▪ Experienced management team ▪ Existing business + potential future royalty + new products + potential acquisitions – For the year ended December 31, 2013: $30.1 million total net revenues □ $22.7 million ANI Rx product revenues □ $7.4 million c ontract manufacturing/services revenues □ Annual organic growth 48% year/year – Potential future royalty stream via partnership with Teva – 13 products in development; total current market $910 million (1) – 31 products acquired from Teva ; total current market $860 million (1) (1) Based on Company estimates, and recent IMS and NSP Audit data 5

6 6 ANI Recent History and Highlights 2009 New executive management team: Art Przybyl, CEO and Charlotte Arnold, CFO 2010 New management expands ANI strategy to include ANI labeled Rx products 2011 ANI expands marketed Rx portfolio to seven products through internal development and acquisition 2013 ANI completes merger with BioSante Pharmaceuticals and obtains NASDAQ Global Market listing (NASDAQ: ANIP), June 2013 Summary of BiosanteTransaction • Acquired potential future royalty on generic Androgel ™ via Teva partnership • Transaction netted $18 million in cash • Public listing enables easier access to markets for future expansion • ANI shareholders owned 57% of company post - merger 2013 Announces agreement to acquire 31 previously marketed generic products from Teva for $12.5 million and a percentage of future gross profits, December 2013
7 7 Sales and Marketing / Financial Overview
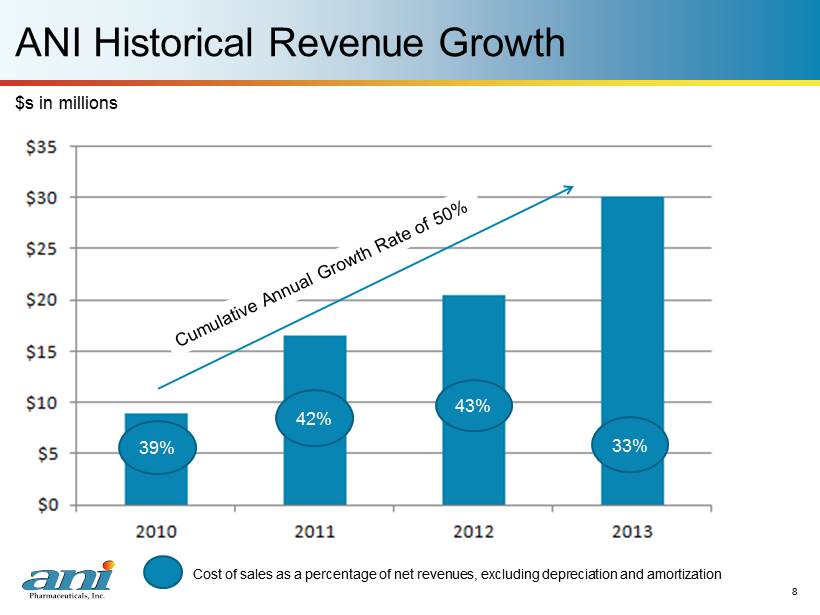
8 ANI Historical Revenue Growth 8 $s in millions 39% 42% 43% 33% C ost of sales as a percentage of net revenues, excluding depreciation and amortization

9 ANI Current Rx Product Portfolio Market Generic Products Position Share (1) EE/MT Tablets #1 90% Fluvoxamine Tablets #1 55% HC Enema #1 85% Metoclopramide Solution #2 31% Opium Tincture #1 75% 9 Branded Products Cortenema TM Reglan Tablets TM (1) Based on Company estimates, and recent IMS and NSP Audit data
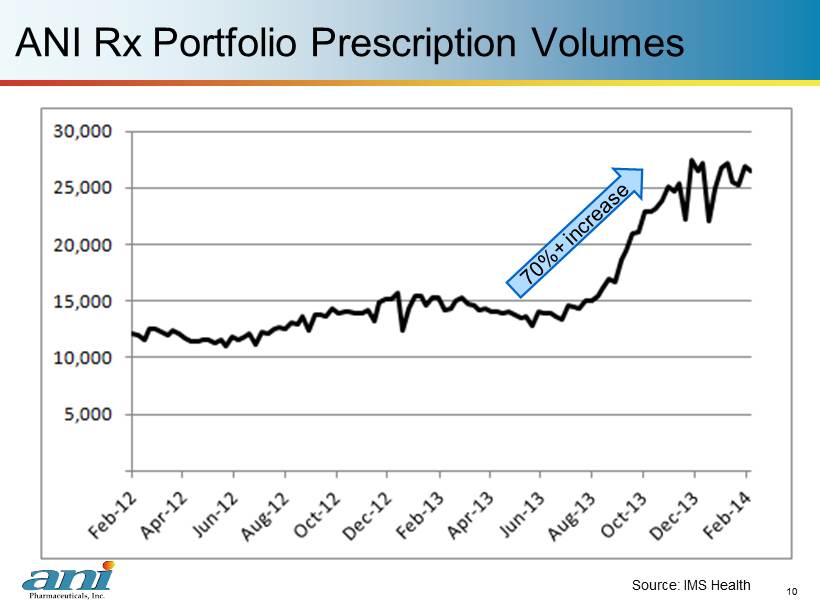
10 ANI Rx Portfolio Prescription Volumes 10 Source: IMS Health

11 ANI Contract Manufacturing and Royalties 11 Current Business ▪ $7.4 million in contract manufacturing and services revenues during the twelve - month period ended December 31, 2013 ▪ Six customers – Twelve products and sixteen SKUs Future Opportunities ▪ One contract customer awaiting FDA approval – One product and two SKUs ▪ Potential future royalty: Teva’s generic Androgel ™
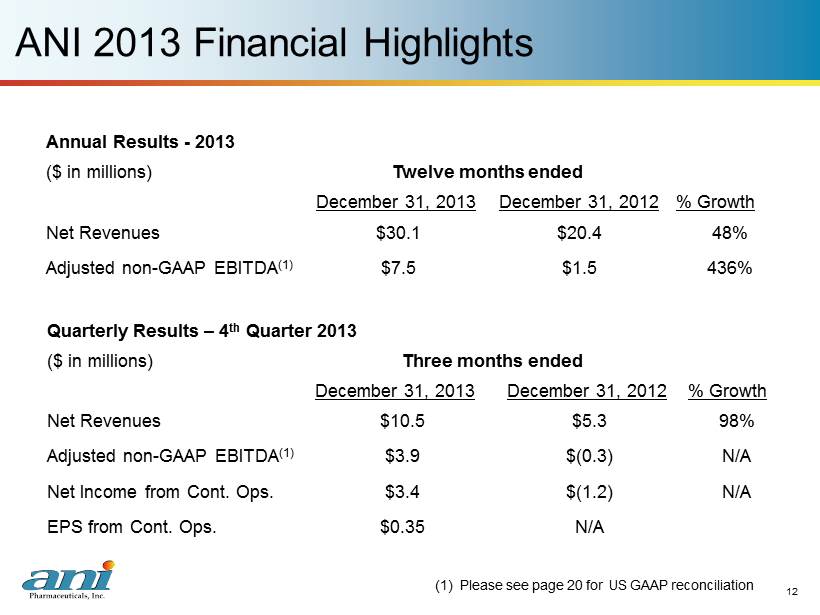
12 ANI 2013 Financial Highlights 12 Annual Results - 2013 ($ in millions) Twelve months ended December 31, 2013 December 31, 2012 % Growth Net Revenues $30.1 $20.4 48% Adjusted non - GAAP EBITDA (1) $7.5 $1.5 436% Quarterly Results – 4 th Quarter 2013 ($ in millions) Three months ended December 31, 2013 December 31, 2012 % Growth Net Revenues $10.5 $5.3 98% Adjusted non - GAAP EBITDA (1) $3.9 $(0.3) N/A Net Income from Cont. Ops. $3.4 $(1.2) N/A EPS from Cont. Ops. $0.35 N/A (1) Please see page 20 for US GAAP reconciliation
13 13 Product Development / Business Development Overview
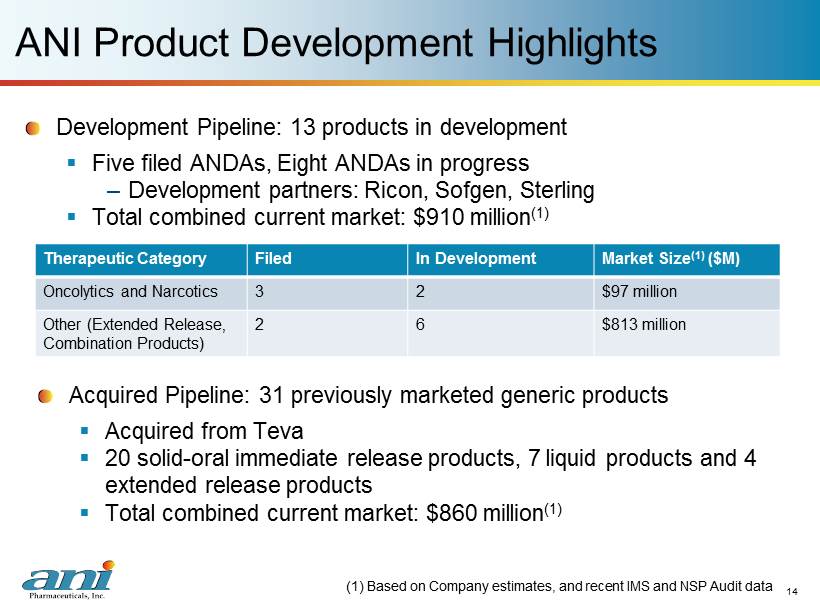
14 14 ANI Product Development Highlights Development Pipeline: 13 p roducts in development ▪ Five filed ANDAs, Eight ANDAs in progress – Development partners: Ricon , Sofgen , Sterling ▪ Total combined current market: $910 million (1) (1) Based on Company estimates, and recent IMS and NSP Audit data Therapeutic Category Filed In Development Market Size (1) ($M) Oncolytics and Narcotics 3 2 $97 million Other (Extended Release, Combination Products) 2 6 $813 million Acquired Pipeline : 31 previously marketed generic products ▪ Acquired from Teva ▪ 20 solid - oral immediate release products, 7 liquid products and 4 extended release products ▪ Total combined current market: $860 million (1)
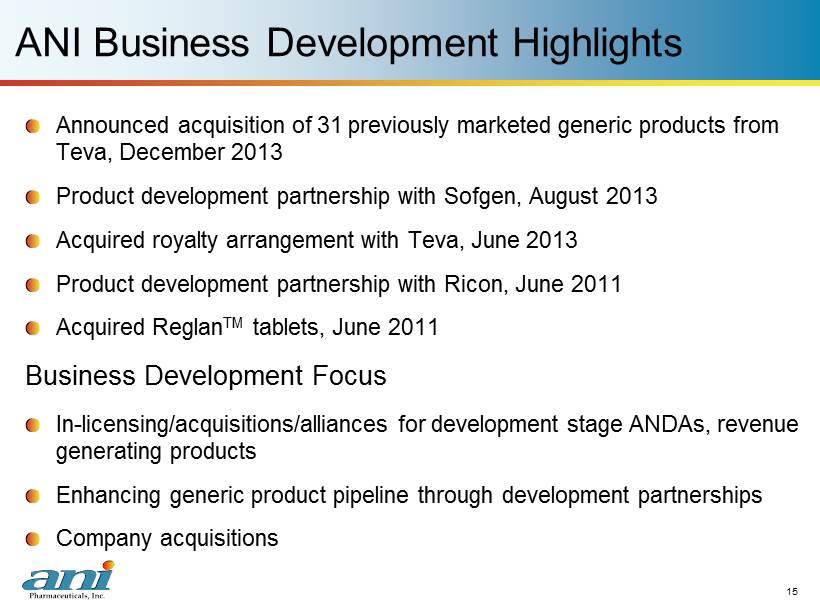
15 15 ANI Business Development Highlights Announced acquisition of 31 previously marketed generic products from Teva , December 2013 Product development partnership with Sofgen , August 2013 Acquired royalty arrangement with Teva , June 2013 Product development partnership with Ricon , June 2011 Acquired Reglan TM tablets, June 2011 Business Development Focus In - licensing/acquisitions/alliances for development stage ANDAs, revenue generating products Enhancing generic product pipeline through development partnerships Company acquisitions
16 16 Manufacturing Overview
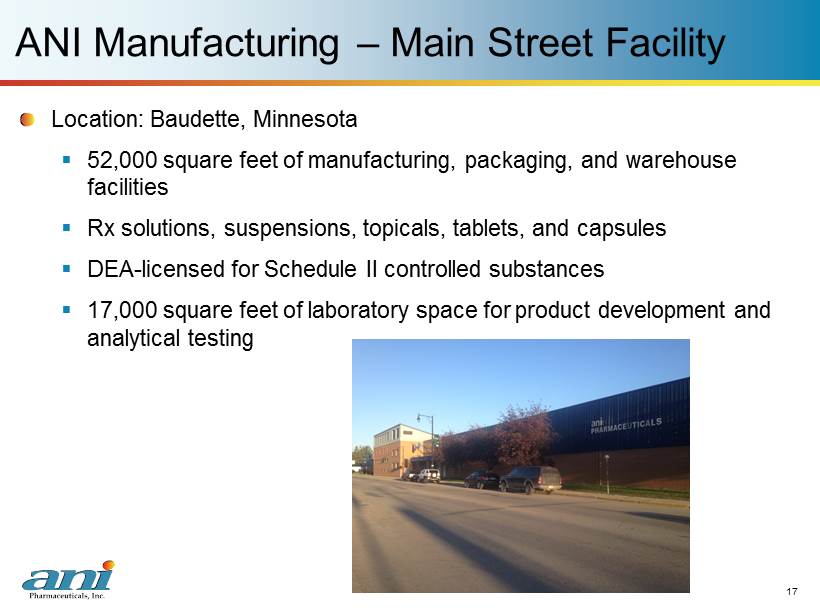
17 17 ANI Manufacturing – Main Street Facility Location: Baudette , Minnesota ▪ 52,000 square feet of manufacturing , packaging, and warehouse facilities ▪ Rx solutions , suspensions , topicals , tablets , and capsules ▪ DEA - licensed for Schedule II controlled substances ▪ 17,000 square feet of laboratory space for product development and analytical testing
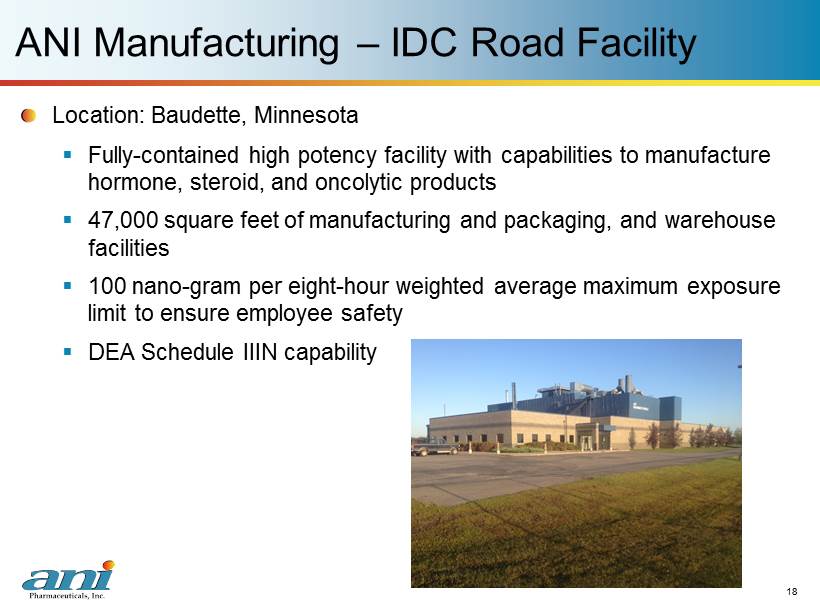
18 18 ANI Manufacturing – IDC Road Facility Location: Baudette, Minnesota ▪ Fully - contained h igh potency facility with capabilities to manufacture h ormone , steroid , and oncolytic products ▪ 47,000 square feet of manufacturing and packaging, and warehouse facilities ▪ 100 nano - gram per eight - hour weighted average maximum exposure limit to ensure employee safety ▪ DEA Schedule IIIN capability
19 ANI Summary ANI is an integrated specialty/generic pharmaceutical firm with: ▪ Profitable base business generating organic growth ▪ Well capitalized balance sheet ▪ Experienced management team ANI is focused on: ▪ Internal product development ▪ Partnerships/strategic alliances ▪ Accretive acquisitions 19
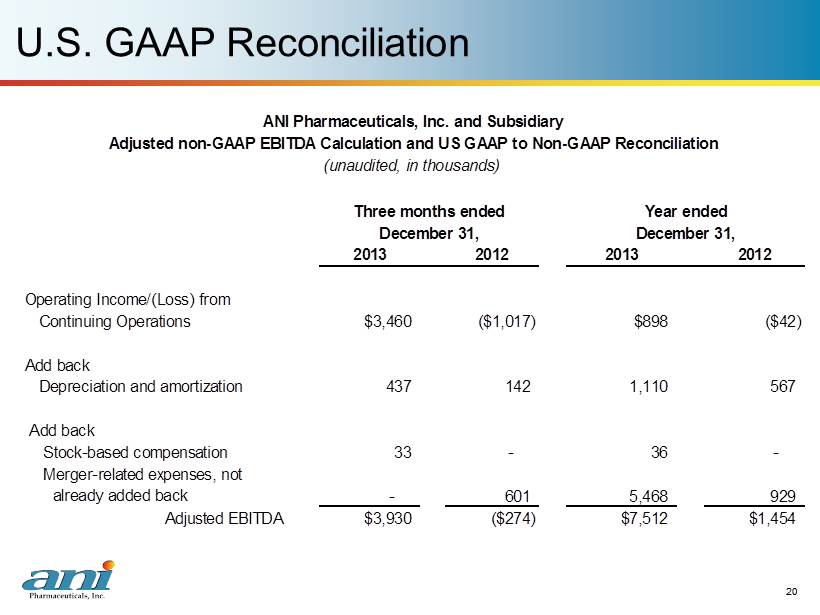
20 U.S. GAAP Reconciliation 20 2013 2012 2013 2012 Operating Income/(Loss) from Continuing Operations Add back Depreciation and amortization 437 142 1,110 567 Add back Stock-based compensation 33 - 36 - Merger-related expenses, not already added back Adjusted EBITDA $3,930 ($274) $7,512 $1,454 ANI Pharmaceuticals, Inc. and Subsidiary Adjusted non-GAAP EBITDA Calculation and US GAAP to Non-GAAP Reconciliation (unaudited, in thousands) Three months ended December 31, Year ended December 31, 929 $898 ($42) - 601 5,468 $3,460 ($1,017)