Attached files
| file | filename |
|---|---|
| 8-K - 8-K - Nimble Storage Inc | d684988d8k.htm |
| EX-99.2 - EX-99.2 - Nimble Storage Inc | d684988dex992.htm |
Exhibit 99.1
Nimble Storage, Inc. Q4FY14 and FY14 Year-End Shareholder Letter
This is our first quarter as a public company, and we would like to start by thanking all of our shareholders for your belief in us. We firmly believe that the IPO is merely the first step towards building an enduring company. Having said that, it is also a significant milestone made possible only by the dedication and hard work of our Nimble employees, the goodwill of our 2,600+ end-customers, and our 900+ channel partners. We would like to thank them all on behalf of the entire executive team.
Our Platform: CASL File System Software and InfoSight Cloud-Based Management Software
Given that this is our first update to shareholders, we wanted to start by reiterating the core innovation that Nimble Storage has brought to the industry.
Nimble was founded on the premise that we could transform storage architectures by leveraging two key external disruptions, flash and cloud connectivity. Our belief was that flash required a fundamental redesign of the storage system from the ground up and that incumbent vendors that were incorporating flash into disk-centric storage architectures would not be competitive. We also believed that the traditional approach of deploying on-premise software to monitor storage was archaic and that cloud-based monitoring could radically simplify storage management.
We translated our founding belief into a platform built on two fundamental innovations – our CASL file system software and our InfoSight cloud-based management software.
Our CASL file system software has been designed from the ground up to leverage the complementary characteristics of flash and disk resources and delivers a compelling value proposition to end-customers:
| • | Efficiency: CASL simultaneously delivers dramatically better capacity/$ as well as better performance/$ than any competing architecture, thus reducing capital costs as well as ongoing operating costs. |
| • | Scale-to-Fit: CASL allows customers to start with very small deployments and non-disruptively grow them into very large environments, flexibly addressing a broad set of workloads ranging from those that need “all-flash” performance to those that need the cost profile of “all-disk” arrays. |
| • | Integrated Protection: When end-customers deploy Nimble Storage arrays, they are able to advance from a typical regime of having daily backups as their protection mechanism to being able to store hundreds of integrated backups that provide for orders of magnitude better data protection. |
An illustrative example of a customer that has deployed us during FY14 is that of a global energy company that chose Nimble initially because CASL was able to deliver dramatic benefits in its VDI environment: 72% lower cost of performance, 37% data compression coupled with being able to use
| 1 |
low-cost nearline HDDs to store that data, 50% faster recovery of virtual desktops and a much simpler to manage environment. This same customer has since expanded its use of Nimble to its Exchange environment that hosts over 11,000 mailboxes and to its VMware server farm environment where it hosts over 600 virtual machines across three data centers.
Our InfoSight cloud-based management software leverages deep data analytics and the rich telemetry capabilities embedded across our platform to proactively monitor the health, capacity and performance of our customer-deployed systems and provide real-time operational insights to our end-customers and to us – thus radically simplifying storage operations and improving the quality of support.
Q4FY14 and FY14 Revenue Growth
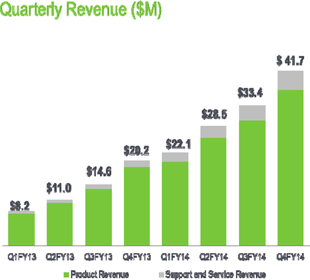
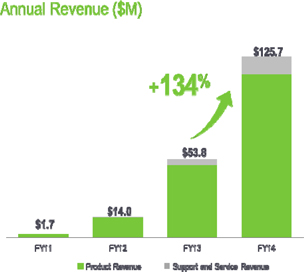
Q4FY14 was a strong quarter as our revenue grew 107% over Q4FY13 to $41.7M, capping off a strong year, which saw our FY14 revenue grow by 134% over FY13 to $125.7M.
This growth stems from strong execution along all of our growth dimensions:
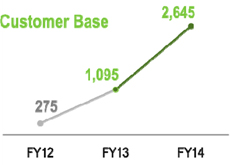
| • | New customer acquisition: New customer acquisition is a key growth driver for us and we set a record pace during Q4 as we added 527 new end-customers, ending the year with an installed base of 2,645 end-customers – an increase of 142% over the 1,095 end-customers that we had at the end of FY13. Our end-customers represent a broad range of industries, and no single end-customer accounts for over 1% of orders during FY14. |
| ||
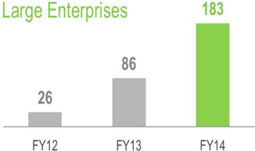
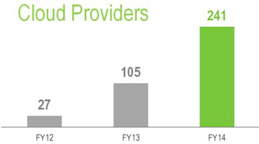
| • | Large enterprise and cloud service provider customer base: Even as we grow the base of mid-sized enterprises, we are executing well on diversifying our customer focus to add large enterprises (defined as the 5000 of the largest companies by revenue globally) and cloud service providers (companies providing hosting services by leveraging our platform as the underlying storage). We now have over 180 large enterprises, including many in the Fortune 500 category, and 240 cloud service providers within our customer base. |
| ||
| • | International expansion: EMEA and APJ contributed ~17% to our bookings during Q4 – the highest contribution ever for us, reflecting continued investment in creating sales capacity internationally as we now have direct sales presence in 12 countries, and distribution arrangements in 16 additional countries. During the quarter, we were pleased to have finalized a distribution relationship with Toshiba Corporation, which we believe will be key to better addressing the Japanese market. |
| ||
| 2 |
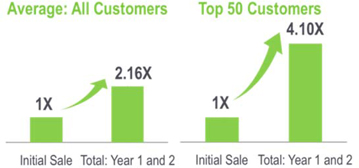
| • | Land and expand business model: A key reason for our focus on customer acquisition is the high lifetime value of a customer. Even as we added new end-customers at a record pace during Q4FY14, over a third of our bookings came from existing end-customers. Across our entire customer base, an end-customer that spends $100 initially with us spends an incremental $116 in the next two years. The lifetime value of a customer is substantially larger for larger end-customers. |
|
Market Validation
The growth that we saw in FY14 and during Q4FY14 is evidence of our broader market opportunity, as the storage industry transitions from disk-centric architectures to flash-optimized storage platforms. As a leading provider of flash-optimized storage platforms, we are well positioned to capitalize on this shift, and our momentum continued to accelerate during Q4FY14.
We received numerous accolades throughout the year for our technology leadership and execution. During FY14, Nimble Storage was named a visionary in its first appearance in Gartner’s General-Purpose Disk Arrays Magic Quadrant. During Q4, TechTarget recognized us as offering the Best Hybrid Flash Product in its Modern Impact Awards. CRN named Nimble a 2013 Emerging Technology Vendor for the third time.
Our market momentum is allowing us to build a robust channel partner ecosystem, and fueling growth for us, with ~97% of our bookings during FY14 flowing through channel partners. We more than doubled our channel partner base during FY14 to over 900 channel partners. More importantly, our focus on deepening our engagement with our channel partners is paying rich dividends as we invest in training and demand generation programs in conjunction with our channel partners. During the quarter, we successfully transitioned the majority of our resellers in the US into a two-tier structure, as we added Avnet as a value-added distributor to help scale our channel programs further.
Our investment in SmartStack solutions – pre-validated converged infrastructure solutions with partners such as Cisco, VMware, Microsoft, Oracle, Citrix and CommVault – has seen strong and increasing customer adoption as well as enabling channel partner recruitment.
| 3 |
Product Momentum
We shipped a record 916 systems in Q4 and our installed base of storage arrays more than doubled during FY14. Given that our systems can span a broad range of performance and capacity profiles, we are deployed in a wide variety of workloads, underscoring the broad applicability and horizontal nature of our platform.
We are also pleased at having expanded the number of production systems that are deployed with our scale-out (Nimble 2.0) software and we are well on target to achieving GA status for our scale-out software release in the near future. Scale-out complements the scale-up and scale-deep functionality within our software, and is a key enabler for us to scale from small systems to very large environments. It is also a major competitive differentiator given that very few storage products within our industry are able to support scale-out functionality.
InfoSight has been a key enabler in simplifying storage management and delivering a dramatically better support experience to our end-customers. As an illustration of the impact of InfoSight, ~92% of all customer support cases in 2HFY14 were originated by Nimble instead of the customer because of InfoSight’s predictive ability, and 82% of all support cases were automatically resolved with no manual intervention. During Q4, we announced the Beta availability of a key capability within InfoSight that allows our channel partners to monitor customer-deployed systems, upon customer delegated authorization. We also announced the Beta availability of advanced performance monitoring capabilities, among other enhancements. We expect all of the Beta features to become GA in the near future.
As we look ahead, we have a rich roadmap of features planned that build on our core platform. For instance, a key product enhancement that will enable us to better address large enterprises is support for Fibre Channel environments, and we remain on track to deliver that capability by the end of FY15.
Organizational Foundation
We are pleased with the organizational foundation that has underpinned our execution.
Our focus on operations and supply chain management was key to delivering strong margins during the quarter. At the same time, our focus on working capital management translated into strong cash flow performance during the quarter. Our investments in automation of all of our key business processes are helping us scale rapidly and will continue to be an area of focus for us.
We would not be where we are today without the dedication of our Nimble employees. During the fourth quarter, we added 64 people, a sequential increase of 12%. During the fiscal year, we added 252 people, a 74% increase over FY13, across all functions.
During Q4, our employees were thrilled to move into a new corporate headquarters facility in San Jose. Even as we grow the organization rapidly, we remain very focused on attracting the industry’s best talent and we were pleased to have been recognized by the Bay Area News Group as a Top Workplace in the Bay Area.
| 4 |
Q4FY14 and FY14 Financial Results
Q4 FY14 was a record financial quarter for Nimble. Revenue and Gross Margin were at an all-time high as we completed a very strong growth year for the company. During FY14, we demonstrated significant increases in all of our key metrics, continued to increase our market share, and made significant progress towards achieving our long-term target financial model. In addition, we strengthened our balance sheet and cash position by completing our initial public offering in December 2013.
As a reminder, all results presented in this letter are on a non-GAAP basis except for Revenue and the Balance Sheet. Non-GAAP results exclude the impact of stock-based compensation.
Q4 FY14 Highlights
| • | Revenue of $41.7M was up 25% from Q3 and 107% from Q4 FY13 |
| • | Non-GAAP Gross Margin of 67.2% vs. 66.4% in Q3 and 61.8% in Q4 FY13 |
| • | Non-GAAP Operating Margin was negative 21% compared to negative 24% in Q3 and negative 46% in Q4 FY13 |
| • | Non-GAAP EPS was a loss of $0.14 per share compared to a loss of $0.13 per share in Q3 FY14 and a loss of $0.16 per share in Q4 FY13 |
FY 2014 Highlights
| • | Revenue of $125.7M was up by 134% vs. fiscal 2013 |
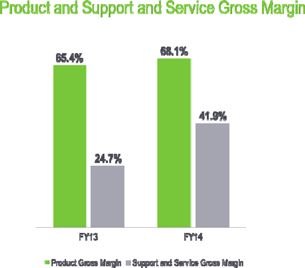
| • | Non-GAAP Gross Margin of 65.4% vs. 62.3% in fiscal 2013 |
| • | Non-GAAP Operating Margin was negative 27% compared to negative 47% in fiscal 2013, an improvement by approximately 2000 basis points |
| • | Non-GAAP EPS was a loss of $0.56 per share compared to a loss of $0.46 per share in fiscal 2013 |
| Q4 FY14 Results
Revenue was a record high of $41.7M for Q4 FY14, an increase of 25% sequentially from Q3 and a more than doubling from $20.2M during Q4 of last year. Product revenue increased to $37.2M, representing 89% of total revenue and a sequential increase of 24% from Q3. Support and Service revenue, which includes our maintenance entitlement and InfoSight service, increased to $4.6M, representing 11% of total revenue and a sequential increase of 29% from Q3. In Q4, North America represented approximately 84% of product revenue and International was approximately 16%. |
|
| 5 |
Gross Margin also reached an all-time high at 67.2% in Q4, up from 66.4% in Q3. Product Gross Margin increased to 69.2% from 69.0% in Q3 as a result of a reduction in component costs. Support and Service Gross Margins increased to 51.0% in Q4 from 44.9% in Q3 due to higher revenue and leverage from our support infrastructure. We expect to see fluctuations in both product and support and services gross margin due to investments and strategic initiatives we continue to make investments to drive top line growth.
Q4 FY14 Research and Development (R&D) spending was $10.2M or 24% of revenue compared to Q3 spending of $8.6M or 26% of revenue. Our investments in R&D continued as headcount increased to 172 employees vs. 99 employees at the end of Q4 last year. Q4 FY14 Sales and Marketing (S&M) spending was $22.1M or 53% of revenue compared to Q3 spending of $19.1M or 57% of revenue. We ended Q4 with S&M headcount of 311 employees vs. 177 employees at the end of Q4 last year. Q4 FY14 General and Administrative (G&A) spending was $4.5M or 11% of revenue compared to Q3 spending of $2.7M or 8% of revenue. Our non-GAAP G&A expenses in Q4 included approximately $0.6M in litigation related legal expenses, additional costs related to being a newly public company, and higher expenses for our new corporate headquarters in San Jose, California. We ended Q4 with G&A headcount of 50 employees vs. 26 employees at the end of Q4 last year, as we built out our administrative functions to scale our business and enhance our public company readiness.
Q4 FY14 total non-GAAP operating expenses were $36.8M or 88% of revenue compared to Q3 operating expenses of $30.3M or 91% of revenue. We saw an improvement in operating leverage compared to Q4 FY13 when total operating expenses were 108% of revenue, even as we increased overall headcount by 252 during FY14 to 592 employees from 340 at the end of last fiscal year. Given our market opportunity and our success to date, we intend to continue to invest in our S&M, Support, and R&D organizations, while also demonstrating progress toward our long term financial model.
As a result of our increased investments, our Q4 FY14 non-GAAP operating loss was $8.7M vs. an operating loss of $8.1M in Q3, and an operating loss of $9.2M in Q4 last year. Due to higher gross margin, and better operating expense leverage, our Q4 non-GAAP Operating Margin improved to negative 21% compared to negative 24% in Q3 and negative 46% in Q4 FY13. Q4 non-GAAP EPS was a loss of $0.14 per share on approximately 65.1M weighted average basic shares outstanding compared to a loss of $0.13 per share in Q3 and a loss of $0.16 per share in Q4 FY13.
| 6 |
| FY 2014 Results |
||
| Revenue was $125.7M for FY14, an increase of 134% sequentially from $53.8M last year. Product revenue increased to $112.8M, representing 90% of total revenue compared to 92% in FY13. Support and Service revenue increased to $12.9M, representing 10% of total revenue compared to 8% in FY13. In FY14, North America represented approximately 85% of product revenue (vs. 91% in FY13) and International was approximately 15% (vs. 9% in FY13). |
| |
| Gross Margin was 65.4% in FY14, up from 62.3% in FY13. Product Gross Margin increased to 68.1% from 65.4% in FY13 as a result of the benefits of scale and leverage from our operations infrastructure. Support and Service Gross Margin increased to 41.9% in FY14 from 24.7% in FY13 due to higher revenue from a larger installed base of end-customers and leverage from our support infrastructure.
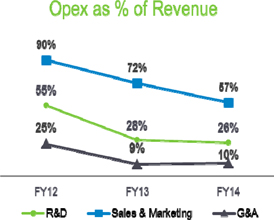
FY14 R&D spending was $32.2M or 26% of revenue compared to FY13 spending of $15.3M or 28% of revenue. FY14 S&M spending was $71.4M or 57% of revenue compared to FY13 spending of $38.8M or 72% of revenue. FY14 G&A spending was $12.0M or 10% of revenue compared to FY13 spending of $4.6M or 9% of revenue. FY14 total non-GAAP operating expenses were $115.6M or 92% of revenue compared to FY13 operating expenses of $58.7M or 109% of revenue. |
| |
| The improvement in operating expense leverage as well as the gross margin increase resulted in our non-GAAP Operating Margin improving to negative 27% in FY14 compared to negative 47% in FY13. During FY14, our income tax expense and other non-operating expense was $0.6M vs. $0.1M in FY13. Our non-GAAP net loss in FY14 was $34.0M vs. our net loss of $25.3M in FY13. Non-GAAP EPS loss was $0.56 in FY14 vs. non-GAAP EPS loss of $0.46 in FY13. |
| |
| 7 |
While we are primarily focused on increasing market share and driving revenue growth, we expect to continue to make progress towards achieving our long term target financial model by delivering sequential improvement in operating margin every year. As a reminder, our long term financial model represents non-GAAP Gross Margin in the 63% to 65% range, non-GAAP R&D expense as a percent of revenue of 11% to 13%, non-GAAP S&M expense as a percent of revenue of 28% to 31%, non-GAAP G&A expense as a percent of revenue of 5% to 6%, and non-GAAP Operating Margin of 16% to 20%.
Balance Sheet
We ended January with cash and cash equivalents of $208M, which included $177M in net proceeds from our IPO. For Q4 FY14, our cash conversion cycle was zero, as Days Sales Outstanding (DSO) improved to 32 days vs. 37 days in Q3 and 50 days in Q4 FY13. In addition, Days Sales in Inventory (DSI) improved to 38 days vs. 50 days in Q3 and 44 days in Q4 FY13, and Days Payable Outstanding (DPO) was 70 days vs. 78 days in Q3 and 70 days in Q4 FY13. Our target cash conversion cycle is approximately 20 days.
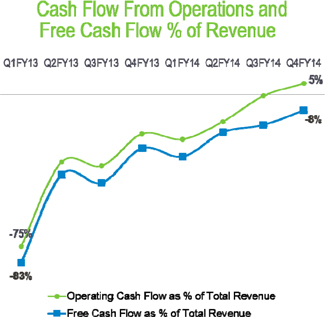
The improvement in working capital in Q4 drove positive cash flow from operations of $2.2M, a milestone in the company’s history. Capex spend was $5.5M during Q4, resulting in negative free cash flow (FCF) of $3.3M for the quarter. This represented an improvement compared to negative FCF of $5.0M in Q3 and negative FCF of $5.3M in Q4 FY13.
We ended Q4 with deferred revenue of $33.5M, an increase of $7.1M from the Q3 balance of $26.4M, and an increase of $22.6M from $10.9M in Q4 FY13. Our deferred revenue consists primarily of payments received for support and service agreements which have an average life of approximately 3 years.
| During FY14, our cash flow from operations was negative $6.7M vs. negative $18.8M in FY13. FCF was negative $20.4M vs. negative $22.7M in FY13. Our capex spend in FY14 was $13.6M vs. $4.0M in FY13 as we completed the first phase of leasehold improvements to our new corporate headquarters. |
|
| 8 |
In closing, Nimble Storage was founded on the belief that a major transformation in storage architectures is underway, and we believe we have an opportunity to lead that transition. Our execution during Q4FY14 and in all of FY14 brings us one step closer to that goal.
We want to thank our customers and partners once again for embracing us, our investors for their confidence in us, and our employees for their dedication and flawless execution.

|

| |
| Suresh Vasudevan, CEO | Anup Singh, CFO | |
| 9 |
Conference Call Information:
As previously announced, Nimble Storage will host a live question & answer conference call and webcast today at 5:00 p.m. ET (2:00 p.m. PT) to discuss its financial results for the fourth quarter and fiscal year ended January 31, 2014.
To access the conference call, dial 877-941-8416, using conference code 4667492. Callers outside the U.S. and Canada should dial 480-629-9808, using conference code 4667492. A replay of the conference call will be available through Thursday, March 6, 2014. To access the replay, please dial 800-406-7325 and enter pass code 4667492. Callers outside the U.S. and Canada should dial 303-590-3030 and enter pass code 4667492.
The live webcast will be accessible on Nimble Storage’s investor relations website at http://investors.nimblestorage.com/ and will be archived and available on this site for 45 days.
Non-GAAP Financial Measures
To provide investors with additional information regarding its financial results, Nimble Storage has disclosed in this release non-GAAP financial measures that are not calculated in accordance with generally accepted accounting principles in the United States, or GAAP. The Company provides non-GAAP gross margin, non-GAAP operating margin, non-GAAP net loss and non-GAAP net loss per share. In computing these non-GAAP financial measures, the Company excludes the effects of stock-based compensation, which is a recurring expense for the Company. The Company has provided a reconciliation below of non-GAAP financial measures to the most directly comparable GAAP financial measures.
The Company discloses these non-GAAP financial measures because they are key measures used by the Company’s management and board of directors to understand and evaluate the core operating performance and trends, to prepare and approve the annual budget and to develop short-term and long-term operational and compensation plans. In particular, the exclusion of certain expenses in calculating non-GAAP financial measures can provide a useful measure for period-to-period comparisons of the Company’s core business. Accordingly, the Company believes that these non-GAAP financial measures provide useful information to investors and others in understanding and evaluating the Company’s operating results in the same manner as the Company’s management and board of directors.
| 10 |
The use of non-GAAP financial measures has limitations as analytical tools. As such, non-GAAP financial measures should not be considered in isolation or as substitutes for analysis of the Company’s results as reported under GAAP. Some of these limitations are:
| • | Non-GAAP financial measures do not consider the potentially dilutive impact of equity-based compensation, which is an ongoing expense for the Company; and |
| • | Other companies, including companies in our industry, may calculate non-GAAP financial measures differently, which reduces their usefulness as comparative measures. |
Nimble Storage, Inc.
Reconciliation of GAAP to Non-GAAP Financial Measures
(In thousands, except per share amounts)
(Unaudited)
| Three Months Ended January 31, |
Year Ended January 31, |
|||||||||||||||
| 2014 | 2013 | 2014 | 2013 | |||||||||||||
| GAAP gross margin |
$ | 27,739 | $ | 12,413 | $ | 81,522 | $ | 33,390 | ||||||||
| Stock-based compensation |
312 | 66 | 700 | 162 | ||||||||||||
|
|
|
|
|
|
|
|
|
|||||||||
| Non-GAAP gross margin |
$ | 28,051 | $ | 12,479 | $ | 82,222 | $ | 33,552 | ||||||||
|
|
|
|
|
|
|
|
|
|||||||||
| GAAP operating margin |
$ | (12,813 | ) | $ | (10,126 | ) | $ | (42,569 | ) | $ | (27,764 | ) | ||||
| Stock-based compensation |
4,102 | 882 | 9,149 | 2,604 | ||||||||||||
|
|
|
|
|
|
|
|
|
|||||||||
| Non-GAAP operating margin |
$ | (8,711 | ) | $ | (9,244 | ) | $ | (33,420 | ) | $ | (25,160 | ) | ||||
|
|
|
|
|
|
|
|
|
|||||||||
| GAAP net loss |
$ | (13,153 | ) | $ | (10,211 | ) | $ | (43,123 | ) | $ | (27,857 | ) | ||||
| Stock-based compensation |
4,102 | 882 | 9,149 | 2,604 | ||||||||||||
|
|
|
|
|
|
|
|
|
|||||||||
| Non-GAAP net loss |
$ | (9,051 | ) | $ | (9,329 | ) | $ | (33,974 | ) | $ | (25,253 | ) | ||||
|
|
|
|
|
|
|
|
|
|||||||||
| GAAP net loss per share, basic and diluted |
$ | (0.29 | ) | $ | (0.53 | ) | $ | (1.61 | ) | $ | (1.53 | ) | ||||
| Stock-based compensation |
0.09 | 0.05 | 0.34 | 0.14 | ||||||||||||
| Impact of difference in number of GAAP and non-GAAP shares |
0.06 | 0.32 | 0.71 | 0.93 | ||||||||||||
|
|
|
|
|
|
|
|
|
|||||||||
| Non-GAAP net loss per share |
$ | (0.14 | ) | $ | (0.16 | ) | $ | (0.56 | ) | $ | (0.46 | ) | ||||
|
|
|
|
|
|
|
|
|
|||||||||
| Shares used to compute GAAP net loss per share attributable to common stockholders, basic and diluted |
45,278 | 19,218 | 26,772 | 18,236 | ||||||||||||
| Weighted average effect of the assumed conversion of convertible preferred stock from the date of issuance |
19,856 | 38,868 | 34,076 | 36,651 | ||||||||||||
|
|
|
|
|
|
|
|
|
|||||||||
| Shares used to compute Non-GAAP net loss per share |
65,134 | 58,086 | 60,848 | 54,887 | ||||||||||||
|
|
|
|
|
|
|
|
|
|||||||||
| 11 |
Forward-Looking Statements
This press release contains “forward-looking” statements that are based on our management’s beliefs and assumptions and on information currently available to management. We intend for such forward-looking statements to be covered by the safe harbor provisions for forward-looking statements contained in the U.S. Private Securities Litigation Reform Act of 1995. Forward-looking statements include all statements other than statements of historical fact contained in this presentation, including information concerning our business plans and objectives, potential growth opportunities, competitive position, industry environment and potential market opportunities.
Forward-looking statements are subject to known and unknown risks, uncertainties, assumptions and other factors including, but not limited to, those related to our future financial performance, market acceptance of our solutions, our ability to increase sales of our solutions, including to attract and retain customers and to selling additional solutions to our existing customers, our ability to develop new solutions and bring them to market in a timely manner, pricing pressure (as a result of competition or otherwise), our ability to maintain, protect and enhance our brand and intellectual property, and our ability to continue to expand our business and manage our growth. Moreover, we operate in very competitive and rapidly changing environments, and new risks may emerge from time to time. It is not possible for our management to predict all risks, nor can we assess the impact of all factors on our business or the extent to which any factor, or combination of factors, may cause actual results to differ materially from those contained in any forward-looking statements we may make. Further information on these and other factors that could affect our financial results are included in our filings we make with the Securities and Exchange Commission, and may cause our actual results, performance or achievements to differ materially and adversely from those anticipated or implied by our forward-looking statements.
You should not rely upon forward-looking statements as predictions of future events. Although our management believes that the expectations reflected in our forward-looking statements are reasonable, we cannot guarantee that the future results, levels of activity, performance or events and circumstances described in the forward-looking statements will be achieved or occur. Moreover, neither we, nor any other person, assume responsibility for the accuracy and completeness of the forward-looking statements. We undertake no obligation to publicly update any forward-looking statements for any reason after the date of this presentation to conform these statements to actual results or to changes in our expectations, except as required by law.
Any unreleased services, features or functions referenced in this document, Nimble Storage’s website or other press releases or public statements that are not currently available are subject to change at Nimble Storage’s discretion and may not be delivered as planned or at all. Customers who purchase Nimble Storage’s products and services should make their purchase decisions based upon services, features and functions that are currently available.
| 12 |
© Nimble Storage. CASL, InfoSight, SmartStack and NimbleConnect are trademarks or registered trademarks of Nimble Storage. Other trade names or words used in this document are the properties of their respective owners.
Press Contact:
Kristalle Cooks
650-346-7810
kristalle@nimblestorage.com
Investor Relations Contact:
Cynthia Hiponia and Alice Kousoum
The Blueshirt Group
408-514-3475
IR@nimblestorage.com
| 13 |