Attached files
| file | filename |
|---|---|
| 8-K - 8-K - UNITED THERAPEUTICS Corp | a14-6575_18k.htm |
Exhibit 99.1
For Immediate Release
Contact: Andrew Fisher
(202) 483-7000
Afisher@unither.com
UNITED THERAPEUTICS CORPORATION REPORTS
2013 FOURTH QUARTER AND ANNUAL FINANCIAL RESULTS
· Total Annual Revenues of $1.1 billion
· Annual Earnings per Share of $3.49 per Basic Share or $3.28 per Diluted Share
· Annual Non-GAAP Earnings of $10.88 per Basic Share or $10.23 per Diluted Share
Silver Spring, MD, February 25, 2014: United Therapeutics Corporation (NASDAQ: UTHR) today announced its financial results for the fourth quarter and year ended December 31, 2013.
“United Therapeutics continued to deliver strong results in 2013, reflecting growing demand for our Remodulin®, Tyvaso® and Adcirca® products,” remarked Martine Rothblatt, Ph.D., United Therapeutics’ Chairman and Chief Executive Officer. “In addition we successfully brought a fourth product, OrenitramTM, to FDA approval and continued enrolling patients in two pivotal trials with the goal of demonstrating that our oral prostacyclin analogues reduce morbidity and mortality in patients with pulmonary arterial hypertension. We feel blessed to be able to help PAH patients with medicines that have leading shares of their market segments, and are excited about our pipeline of several promising new therapies.”
Total revenues for the quarter ended December 31, 2013 were $289.0 million, up from $243.8 million for the quarter ended December 31, 2012. Net loss for the quarter ended December 31, 2013 was $30.3 million or $0.60 net loss per basic share, compared to net income of $83.3 million or $1.65 per basic share for the quarter ended December 31, 2012. For the year ended December 31, 2013, we had net income of $174.6 million, or $3.49 per basic share and $3.28 per diluted share, compared to $304.4 million, or $5.84 per basic share and $5.71 per diluted share, for the year ended December 31, 2012. Non-GAAP earnings(1) for the quarter ended December 31, 2013, were $160.2 million or $3.19 per basic share, compared to $84.6 million or $1.67 per basic share for the quarter ended December 31, 2012. Non-GAAP earnings for the year ended December 31, 2013, were $544.7 million or $10.88 per basic share, compared to $383.2 million or $7.36 per basic share for the year ended December 31, 2012.
(1) See definition of non-GAAP earnings, a non-GAAP financial measure, and a reconciliation of net income to non-GAAP earnings below.
Operating Results
Revenues
The table below summarizes the components of revenues (in thousands):
|
|
|
Three Months Ended |
|
Year Ended |
| ||||||||
|
|
|
2013 |
|
2012 |
|
2013 |
|
2012 |
| ||||
|
Cardiopulmonary products: |
|
|
|
|
|
|
|
|
| ||||
|
Remodulin |
|
$ |
119,865 |
|
$ |
116,214 |
|
$ |
491,179 |
|
$ |
457,969 |
|
|
Tyvaso |
|
114,385 |
|
86,036 |
|
438,793 |
|
325,614 |
| ||||
|
Adcirca |
|
52,047 |
|
38,182 |
|
176,972 |
|
122,540 |
| ||||
|
Other |
|
2,720 |
|
3,385 |
|
10,040 |
|
9,953 |
| ||||
|
Total revenues |
|
$ |
289,017 |
|
$ |
243,817 |
|
$ |
1,116,984 |
|
$ |
916,076 |
|
Revenues for the quarter ended December 31, 2013 increased by $45.2 million compared to the quarter ended December 31, 2012. The growth in revenues corresponded to the continued increase in the number of patients being treated with our cardiopulmonary products.
Expenses
The table below summarizes research and development expense by major project and non-project component (in thousands):
|
|
|
Three Months Ended |
|
Year Ended |
| ||||||||
|
|
|
2013 |
|
2012 |
|
2013 |
|
2012 |
| ||||
|
Project and non-project: |
|
|
|
|
|
|
|
|
| ||||
|
Cardiopulmonary |
|
$ |
32,242 |
|
$ |
30,892 |
|
$ |
116,137 |
|
$ |
122,350 |
|
|
Share-based compensation expense (benefit) |
|
76,422 |
|
(3,722 |
) |
134,706 |
|
11,237 |
| ||||
|
Other |
|
12,888 |
|
10,306 |
|
48,505 |
|
39,800 |
| ||||
|
Total research and development expense |
|
$ |
121,552 |
|
$ |
37,476 |
|
$ |
299,348 |
|
$ |
173,387 |
|
Share-based compensation. The $80.1 million increase in share-based compensation expense for the quarter ended December 31, 2013 over the same quarter in 2012 reflects the 43 percent appreciation in the price of our common stock during the quarter ended December 31, 2013, compared to a 4 percent decline in our stock price for the same quarter in 2012.
The table below summarizes selling, general and administrative expense by major category (in thousands):
|
|
|
Three Months Ended |
|
Year Ended |
| ||||||||
|
|
|
2013 |
|
2012 |
|
2013 |
|
2012 |
| ||||
|
Category: |
|
|
|
|
|
|
|
|
| ||||
|
General and administrative |
|
$ |
38,112 |
|
$ |
31,118 |
|
$ |
140,235 |
|
$ |
116,899 |
|
|
Sales and marketing |
|
21,038 |
|
15,788 |
|
73,871 |
|
67,220 |
| ||||
|
Share-based compensation expense (benefit) |
|
98,028 |
|
(6,833 |
) |
179,904 |
|
17,627 |
| ||||
|
Total selling, general and administrative expense |
|
$ |
157,178 |
|
$ |
40,073 |
|
$ |
394,010 |
|
$ |
201,746 |
|
General and administrative. The $7.0 million increase in general and administrative expenses for the quarter ended December 31, 2013 compared to the same quarter in 2012 was attributable principally to increases of $3.1 million in professional and consulting fees and $1.2 million in salaries and related expenses as a result of general corporate growth during 2013.
Sales and marketing. The $5.3 million increase in sales and marketing expenses for the quarter ended December 31, 2013 compared to the same quarter in 2012 was driven by an increase of $3.2 million in marketing and advertising expenses, as well as a $1.8 million increase in salaries and related expenses due to the growth of our sales force.
Share-based compensation. The $104.9 million increase in share-based compensation expense for the quarter ended December 31, 2013 compared to the same quarter in 2012 reflects the 43 percent appreciation in the price of our common stock during the quarter ended December 31, 2013, compared to a 4 percent decline in the price of our common stock for the same quarter in 2012.
Non-GAAP Earnings
Non-GAAP earnings is defined as net income, adjusted for the following non-cash charges, as applicable: (1) interest; (2) non-cash license fees; (3) depreciation and amortization; (4) impairment charges; and (5) share-based compensation (stock option, share tracking award and employee stock purchase plan expense).
A reconciliation of net income to non-GAAP earnings is presented below (in thousands, except per share data):
|
|
|
Year Ended |
|
Three Months Ended |
| ||||||||||||||
|
|
|
2013 |
|
2012 |
|
2011 |
|
2010 |
|
2013 |
|
2012 |
| ||||||
|
|
|
|
|
|
|
|
|
|
|
|
|
|
| ||||||
|
Net income (loss), as reported |
|
$ |
174,560 |
|
$ |
304,442 |
|
$ |
217,868 |
|
$ |
105,916 |
|
$ |
(30,314 |
) |
$ |
83,255 |
|
|
Add (subtract) non-cash charges (benefits): |
|
|
|
|
|
|
|
|
|
|
|
|
| ||||||
|
Interest expense |
|
18,058 |
|
16,639 |
|
21,372 |
|
19,714 |
|
4,562 |
|
4,490 |
| ||||||
|
Non-cash license fees |
|
— |
|
— |
|
37,049 |
|
— |
|
— |
|
— |
| ||||||
|
Depreciation and amortization |
|
31,259 |
|
27,145 |
|
20,535 |
|
17,919 |
|
7,753 |
|
7,290 |
| ||||||
|
Impairment charges |
|
— |
|
4,839 |
|
— |
|
7,688 |
|
— |
|
— |
| ||||||
|
Share-based compensation expense (benefit) |
|
320,786 |
|
30,115 |
|
(15,715 |
) |
113,942 |
|
178,202 |
|
(10,453 |
) | ||||||
|
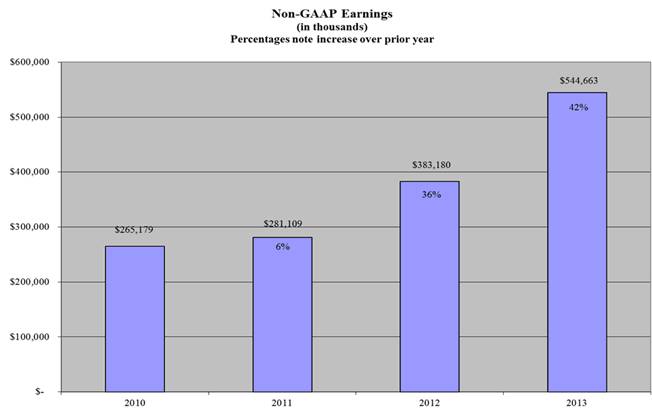
Non-GAAP earnings |
|
$ |
544,663 |
|
$ |
383,180 |
|
$ |
281,109 |
|
$ |
265,179 |
|
$ |
160,203 |
|
$ |
84,582 |
|
|
|
|
|
|
|
|
|
|
|
|
|
|
|
| ||||||
|
Non-GAAP earnings per share: |
|
|
|
|
|
|
|
|
|
|
|
|
| ||||||
|
Basic |
|
$ |
10.88 |
|
$ |
7.36 |
|
$ |
4.92 |
|
$ |
4.72 |
|
$ |
3.19 |
|
$ |
1.67 |
|
|
Diluted |
|
$ |
10.23 |
|
$ |
7.19 |
|
$ |
4.73 |
|
$ |
4.46 |
|
$ |
2.88 |
|
$ |
1.62 |
|
|
|
|
|
|
|
|
|
|
|
|
|
|
|
| ||||||
|
Weighted average number of common shares outstanding: |
|
|
|
|
|
|
|
|
|
|
|
|
| ||||||
|
Basic |
|
50,076 |
|
52,093 |
|
57,163 |
|
56,142 |
|
50,281 |
|
50,503 |
| ||||||
|
Diluted |
|
53,231 |
|
53,280 |
|
59,395 |
|
59,516 |
|
55,648 |
|
52,133 |
| ||||||
Conference Call
We will host a half-hour teleconference on Tuesday, February 25, 2014, at 9:00 a.m. Eastern Time. The teleconference is accessible by dialing 1-877-351-5881, with international callers dialing 1-970-315-0533. A rebroadcast of the teleconference will be available for one week by dialing 1-855-859-2056, with international callers dialing 1-404-537-3406 and using access code 58833697.
This teleconference is also being webcast and can be accessed via our website at http://ir.unither.com/events.cfm.
About United Therapeutics
United Therapeutics Corporation is a biotechnology company focused on the development and commercialization of unique medicinal products.
Non-GAAP Financial Information
This press release contains a financial measure, non-GAAP earnings, that does not comply with generally accepted accounting principles in the United States (GAAP). This measure supplements our financial results prepared in accordance with GAAP as reported below.
We use non-GAAP earnings to assist us in: (1) planning, including the preparation of our annual operating budget; (2) allocating resources in an effort to enhance the financial performance of our business; (3) evaluating the effectiveness of our operational strategies; and (4) assessing our capacity to fund capital expenditures and expand our business. We believe this non-GAAP financial measure improves investors’ understanding of our financial results by excluding certain expenses that we do not consider when evaluating and comparing the performance of our core operations and making operating decisions. However, there are limitations in the use of this non-GAAP financial measure in that it excludes certain operating expenses that are recurring in nature. In addition, our calculation of this non-GAAP financial measure may differ from the methodology used by other companies. The presentation of this non-GAAP financial measure should not be considered in isolation or as a substitute for our financial results prepared in accordance with GAAP. A reconciliation of net income, the most directly comparable GAAP financial measure, to non-GAAP earnings can be found in the table above under the heading, Non-GAAP Earnings.
Forward-looking Statements
Statements included in this press release that are not historical in nature are “forward-looking statements” within the meaning of the Private Securities Litigation Reform Act of 1995. Forward-looking statements include, among others, our expectations about the growing demand for our products, the impact of the FDA’s approval of Orenitram, the goal of our two pivotal trials of our oral prostacyclin analogues, and the potential of our pipeline to deliver promising new therapies. These forward-looking statements are subject to certain risks and uncertainties, such as those described in our periodic reports filed with the Securities and Exchange Commission, that could cause actual results to differ materially from anticipated results. Consequently, such forward-looking statements are qualified by the cautionary statements, cautionary language and risk factors set forth in our periodic reports and documents filed with the Securities and Exchange Commission, including our most recent Annual Report on Form 10-K, Quarterly Reports on Form 10-Q, and Current Reports on Form 8-K. We claim the protection of the safe harbor contained in the Private Securities Litigation Reform Act of 1995 for forward-looking statements. We are providing this information as of February 25, 2014, and assume no obligation to update or revise the information contained in this press release whether as a result of new information, future events or any other reason. [uthr-g]
Orenitram is a trademark, and Remodulin and Tyvaso are registered trademarks, of United Therapeutics Corporation.
Adcirca is a registered trademark of Eli Lilly and Company.
UNITED THERAPEUTICS CORPORATION
CONSOLIDATED STATEMENTS OF OPERATIONS
(In thousands, except per share data)
|
|
|
Three Months Ended December 31, |
|
Year Ended December 31, |
| ||||||||
|
|
|
2013 |
|
2012 |
|
2013 |
|
2012 |
| ||||
|
Revenues: |
|
|
|
|
|
|
|
|
| ||||
|
Net product sales |
|
$ |
286,297 |
|
$ |
240,431 |
|
$ |
1,106,944 |
|
$ |
906,123 |
|
|
Other |
|
2,720 |
|
3,386 |
|
10,040 |
|
9,953 |
| ||||
|
Total revenue |
|
289,017 |
|
243,817 |
|
1,116,984 |
|
916,076 |
| ||||
|
Operating expenses: |
|
|
|
|
|
|
|
|
| ||||
|
Research and development |
|
121,552 |
|
37,476 |
|
299,348 |
|
173,387 |
| ||||
|
Selling, general and administrative |
|
157,178 |
|
40,073 |
|
394,010 |
|
201,746 |
| ||||
|
Cost of product sales |
|
38,778 |
|
37,665 |
|
131,127 |
|
119,297 |
| ||||
|
Total operating expenses |
|
317,508 |
|
115,214 |
|
824,485 |
|
494,430 |
| ||||
|
Operating (loss) income |
|
(28,491 |
) |
128,603 |
|
292,499 |
|
421,646 |
| ||||
|
Other (expense) income: |
|
|
|
|
|
|
|
|
| ||||
|
Interest income |
|
1,111 |
|
716 |
|
3,827 |
|
3,941 |
| ||||
|
Interest expense |
|
(4,562 |
) |
(4,490 |
) |
(18,058 |
) |
(16,639 |
) | ||||
|
Other, net |
|
312 |
|
123 |
|
635 |
|
31,723 |
| ||||
|
Total other (expense) income, net |
|
(3,139 |
) |
(3,651 |
) |
(13,596 |
) |
19,025 |
| ||||
|
(Losses) earnings before income taxes |
|
(31,630 |
) |
124,952 |
|
278,903 |
|
440,671 |
| ||||
|
Income tax benefit (expense) |
|
1,316 |
|
(41,697 |
) |
(104,343 |
) |
(136,229 |
) | ||||
|
Net (loss) income |
|
$ |
(30,314 |
) |
$ |
83,255 |
|
$ |
174,560 |
|
$ |
304,442 |
|
|
Net (loss) income per common share: |
|
|
|
|
|
|
|
|
| ||||
|
Basic |
|
$ |
(0.60 |
) |
$ |
1.65 |
|
$ |
3.49 |
|
$ |
5.84 |
|
|
Diluted |
|
$ |
(0.60 |
) |
$ |
1.60 |
|
$ |
3.28 |
|
$ |
5.71 |
|
|
Weighted average number of common shares outstanding: |
|
|
|
|
|
|
|
|
| ||||
|
Basic |
|
50,281 |
|
50,503 |
|
50,076 |
|
52,093 |
| ||||
|
Diluted |
|
50,281 |
|
52,133 |
|
53,231 |
|
53,280 |
| ||||
SELECTED CONSOLIDATED BALANCE SHEET DATA
(In millions)
|
|
|
December 31, |
| ||||
|
|
|
2013 |
|
2012 |
| ||
|
Cash, cash equivalents and marketable securities (excluding restricted amounts of $5.4 million as of December 31, 2013 and 2012) |
|
$ |
1,136.7 |
|
$ |
784.9 |
|
|
Total assets |
|
2,087.6 |
|
1,626.6 |
| ||
|
Total liabilities and temporary equity |
|
828.3 |
|
542.6 |
| ||
|
Total stockholders’ equity |
|
1,259.3 |
|
1,084.0 |
| ||