Attached files
| file | filename |
|---|---|
| 8-K - FORM 8-K - Cooper-Standard Holdings Inc. | d680607d8k.htm |
 DRIVE
FOR PROFITABLE
GROWTH
Fourth Quarter and
Full Year Earning Call
February 25, 2014
Exhibit 99.1 |
 2
2
2
Forward-Looking Statements
This
presentation
includes
“forward-looking
statements”
within
the
meaning
of
U.S.
federal
securities
laws,
and
we
intend
that
such
forward-looking
statements
be
subject
to
the
safe
harbor
created
thereby.
We
make
forward-looking
statements
in
this
presentation
and
may
make
such
statements
in
future
filings
with
the
SEC.
We
may
also
make
forward-looking
statements
in
our
press
releases
or
other
public
or
stockholder
communications.
These
forward-looking
statements
include
statements
concerning
our
plans,
objectives,
goals,
strategies,
future
events,
future
revenue
or
performance,
capital
expenditures,
financing
needs,
plans
or
intentions
relating
to
acquisitions,
business
trends,
and
other
information
that
is
not
historical
information.
When
used
in
this
presentation,
the
words
“estimates,”
“expects,”
“anticipates,”
“projects,”
“plans,”
“intends,”
“believes,”
“forecasts,”
or
future
or
conditional
verbs,
such
as
“will,”
“should,”
“could,”
or
“may,”
and
variations
of
such
words
or
similar
expressions
are
intended
to
identify
forward-looking
statements.
All
forward-looking
statements,
including,
without
limitation,
management’s
examination
of
historical
operating
trends
and
data
are
based
upon
our
current
expectations
and
various
assumptions.
Our
expectations,
beliefs,
and
projections
are
expressed
in
good
faith
and
we
believe
there
is
a
reasonable
basis
for
them.
However,
no
assurances
can
be
made
that
these
expectations,
beliefs
and
projections
will
be
achieved.
Forward-looking
statements
are
not
guarantees
of
future
performance
and
are
subject
to
significant
risks
and
uncertainties
that
may
cause
actual
results
or
achievements
to
be
materially
different
from
the
future
results
or
achievements
expressed
or
implied
by
the
forward-looking
statements.
There
are
a
number
of
risks
and
uncertainties
that
could
cause
our
actual
results
to
differ
materially
from
the
forward-looking
statements
contained
in
this
presentation.
Important
factors
that
could
cause
our
actual
results
to
differ
materially
from
the
forward-looking
statements
we
make
herein
include,
but
are
not
limited
to:
cyclicality
of
the
automotive
industry
with
the
possibility
of
further
material
contractions
in
automotive
sales
and
production
effecting
the
viability
of
our
customers
and
financial
condition
of
our
customers;
global
economic
uncertainty,
particularly
in
Europe;
loss
of
large
customers
or
significant
platforms;
our
ability
to
generate
sufficient
cash
to
service
our
indebtedness,
and
obtain
future
financing;
operating
and
financial
restrictions
imposed
on
us
by
our
bond
indentures
and
credit
agreement;
our
underfunded
pension
plans;
supply
shortages;
escalating
pricing
pressures
and
decline
of
volume
requirements
from
our
customers;
our
ability
to
meet
significant
increases
in
demand;
availability
and
increasing
volatility
in
cost
of
raw
materials
or
manufactured
components;
our
ability
to
continue
to
compete
successfully
in
the
highly
competitive
automotive
parts
industry;
risks
associated
with
our
non-U.S.
operations;
foreign
currency
exchange
rate
fluctuations;
our
ability
to
control
the
operations
of
joint
ventures
for
our
benefit;
the
effectiveness
of
our
continuous
improvement
program
and
other
cost
savings
plans;
product
liability
and
warranty
and
recall
claims
that
may
be
brought
against
us;
work
stoppages
or
other
labor
conditions;
natural
disasters;
our
ability
to
meet
our
customers’
needs
for
new
and
improved
products
in
a
timely
manner
or
cost-
effective
basis;
the
possibility
that
our
acquisition
strategy
may
not
be
successful;
our
legal
rights
to
our
intellectual
property
portfolio;
environmental
and
other
regulations;
the
possible
volatility
of
our
annual
effective
tax
rate;
significant
changes
in
discount
rates
and
the
actual
return
on
pension
assets;
the
possibility
of
future
impairment
charges
to
our
goodwill
and
long-lived
assets;
and
the
interests
of
our
major
stockholders
may
conflict
with
our
interests.
There
may
be
other
factors
that
may
cause
our
actual
results
to
differ
materially
from
the
forward-looking
statements.
All
forward-looking
statements
attributable
to
us
or
persons
acting
on
our
behalf
apply
only
as
of
the
date
of
this
presentation
and
are
expressly
qualified
in
their
entirety
by
the
cautionary
statements
included
herein.
We
undertake
no
obligation
to
update
or
revise
forward-looking
statements
to
reflect
events
or
circumstances
that
arise
after
the
date
made
or
to
reflect
the
occurrence
of
unanticipated
events. |
 3
Jeff Edwards
Chairman and
Chief Executive Officer |
 4
4
4
Industry Landscape
•
Global light vehicle production expected to grow 3.1% in 2014
–
North American vehicle production remains strong
–
European vehicle production stabilizing and is forecasted to grow by 1.6%
–
Emerging markets are mixed with strong growth continuing for China,
with slight softening in India and Russia
•
Material pricing and availability stable
•
North America supply base adjusting to current production run rates
|
 5
5
5
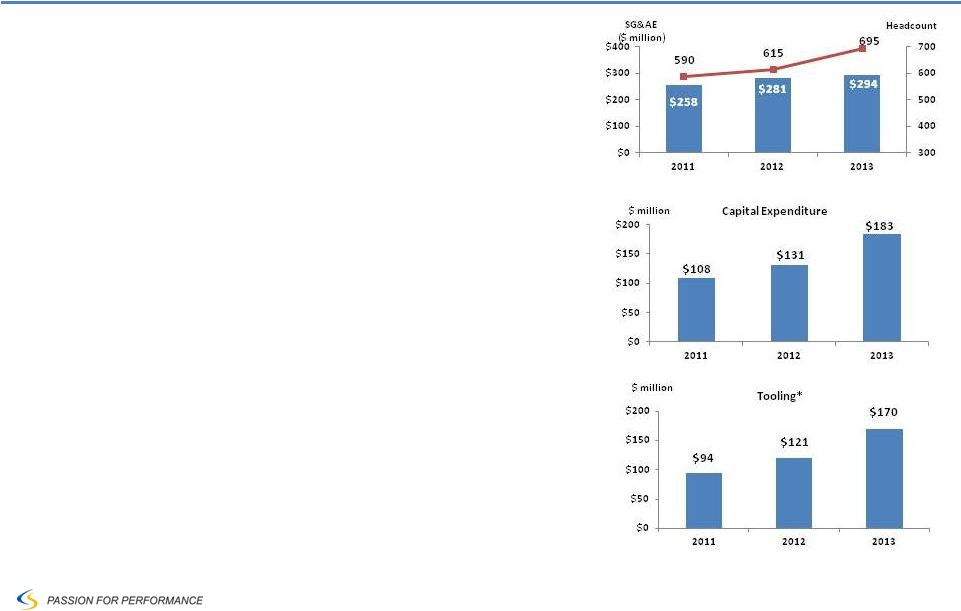
2013 Business Update
•
Cooper Standard global sales grew by 7.3% year-over-year
•
Full year adjusted EBITDA margin of 9.3% of sales
–
Sealing and Trim launch and significant product challenges impacting financial
performance
•
Investing in people, process improvements, technology and working closely
with our customers to address challenges
•
Expect to move past these issues by end of second quarter
•
Capital expenditure at 5.9% of sales as we invest for future growth
Asia Pacific 9.2%
North America and others 4.8%
South America 7.4%
Europe 6.8%
•
Returned $217.5 million to shareholders through share repurchases
|
 6
6
6
Transition for Profitable Growth
•
Investing in people
–
Restaffing for execution
–
Product development
–
Innovation
•
Investing in capital
–
Asian growth
–
Europe restructuring
–
New product launches
–
Global technology processes
•
Investing in future programs
–
Tooling expenditures increasing working capital
–
Growing tooling requirements due to product
complexity
* Includes short-term and long-term tooling balances |
 7
7
7
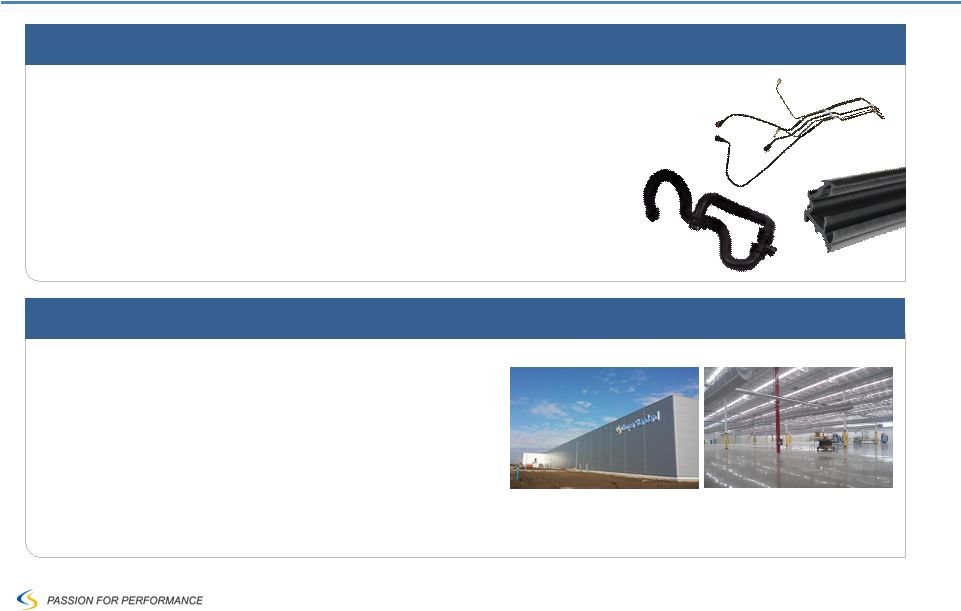
Transition for Profitable Growth
Product Strategy
•
Focusing on Sealing & Trim, Fuel & Brake
Delivery and Fluid Transfer Systems
–
Delivering innovation
–
Achieve #1 or #2 market leadership
–
Global product teams driving increased ROIC
–
Sell Thermal & Emissions business
Optimizing Footprint
•
Serbia start-up on schedule
–
Net annualized labor savings of $25M
•
Expansion in Aguascalientes nearing
completion
•
Establishing Shanghai Tech Center
Sremska Mitrovica,
Serbia
Aguascalientes, Mexico |
 8
Allen Campbell
Executive Vice President and
Chief Financial Officer |
 9
9
9
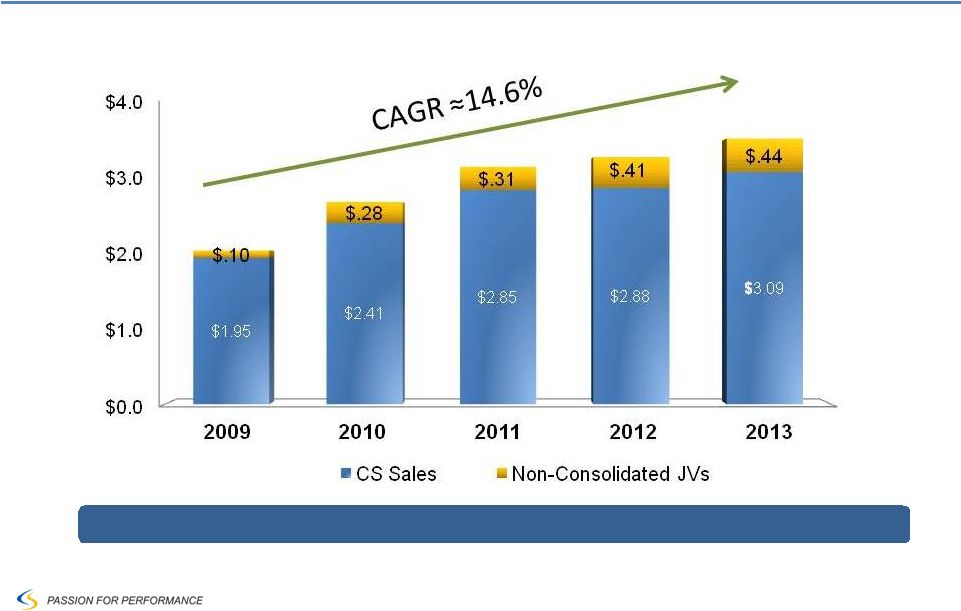
Track Record of Growing Sales
$ USD Billions
Note:
CAGR includes non-consolidated JV revenue
Numbers subject to rounding
Exceeding global light vehicle production CAGR of 9.1% |
 10
10
Q4 and Full Year 2013 Revenue
$ USD Millions
Note: Numbers subject to rounding
Q4 2012 -
$697
Q4 2013 -
$794
Full Year 2012 -
$2,881
Full Year 2013 -
$3,091
Q4 2013
Full Year 2013 |
 11
11
Non-Consolidated Joint Venture Revenue
Joint Venture
Partner
Product
Country
Huayu-Cooper Sealing
SAIC/HASCO
Sealing
China
Nishikawa Cooper
Nishikawa Rubber
Sealing
U.S.
Nishikawa Tachaplalert Cooper
Nishikawa Rubber
Sealing
Thailand
Sujan CSF India
Magnum Elastomers
AVS
India
$ million |
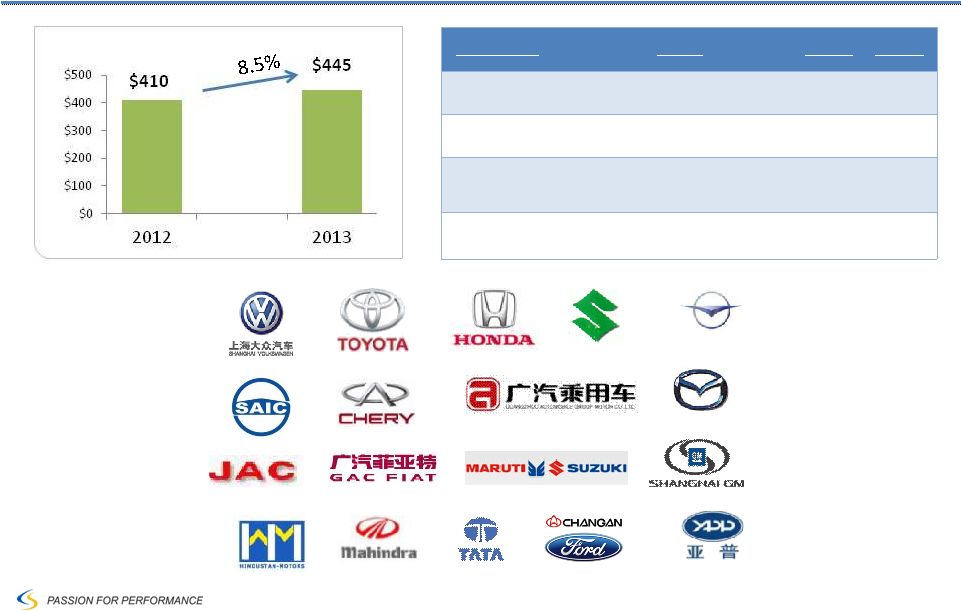
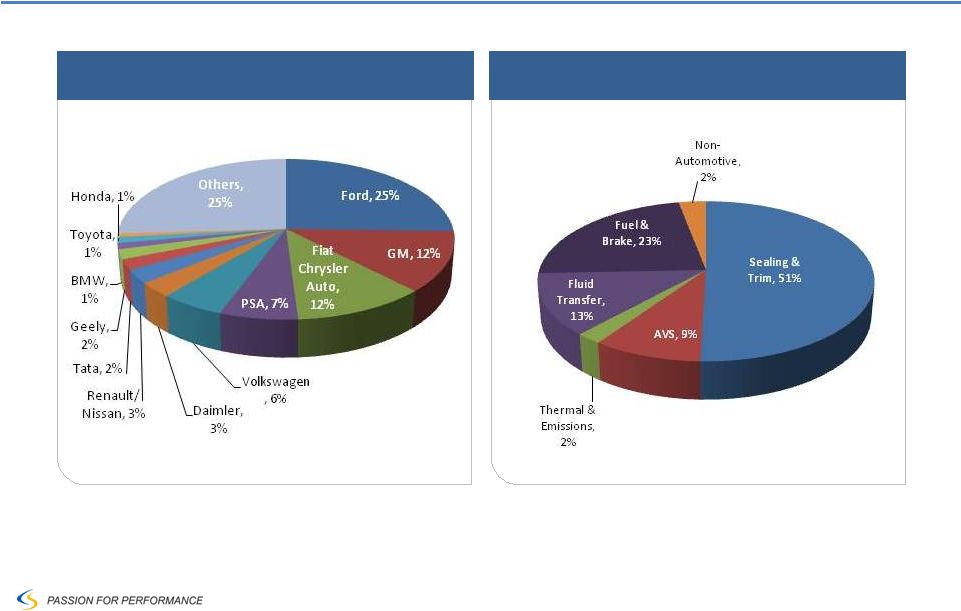 12
12
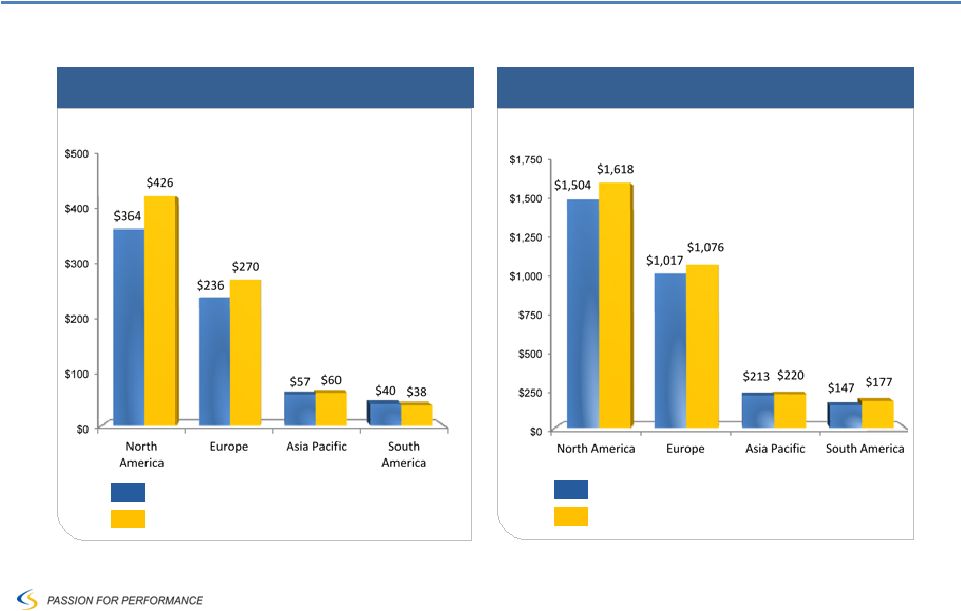
2013 Revenue by Customers and Product
$ USD Millions
Note: Numbers subject to rounding
2013 Revenue -
$3,091
Revenue by Customers
Revenue by Product |
 13
13
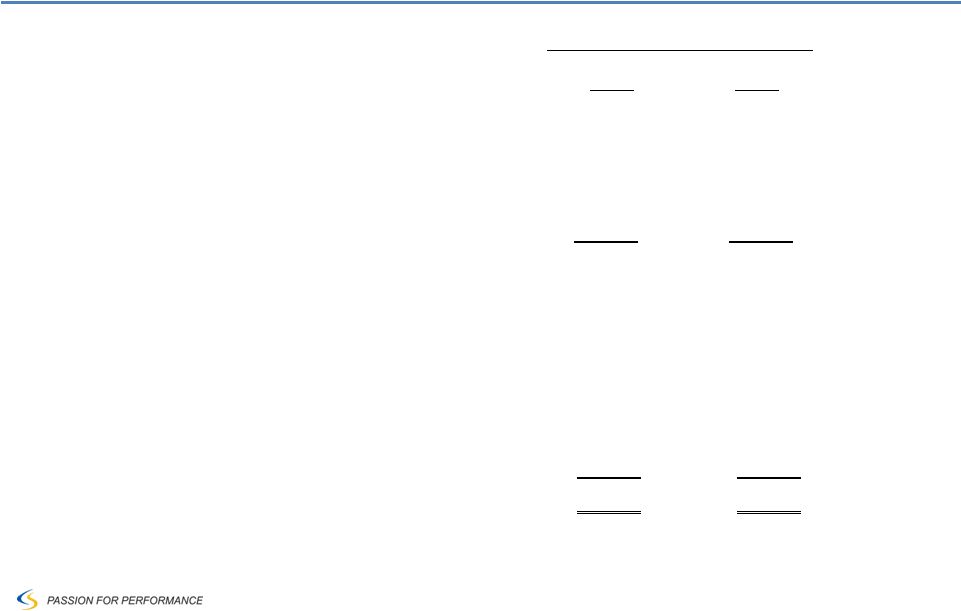
Q4 and FY 2013 Performance
$ USD Millions, except EPS / %
Note: Numbers subject to rounding
Fourth Quarter
Full Year
2012
2013
2012
2013
$697.1
$794.2
Sales
$2,880.9
$3,090.5
99.7
105.1
Gross Profit
438.9
472.7
14.3 %
13.2%
% Margin
15.2%
15.3%
74.8
72.6
SA&E
281.3
293.4
(2.1)
14.6
Operating Profit (Loss)
103.3
142.1
(0.3%)
1.8%
% Margin
3.6%
4.6%
($9.9)
($20.8)
Net Income (Loss)
$102.8
$47.9
($0.70)
($1.44)
Fully Diluted EPS
$4.14
$2.24
$70.9
$58.7
Adjusted EBITDA
$298.0
$287.4
10.2%
7.4%
% Margin
10.3%
9.3% |
 14
14
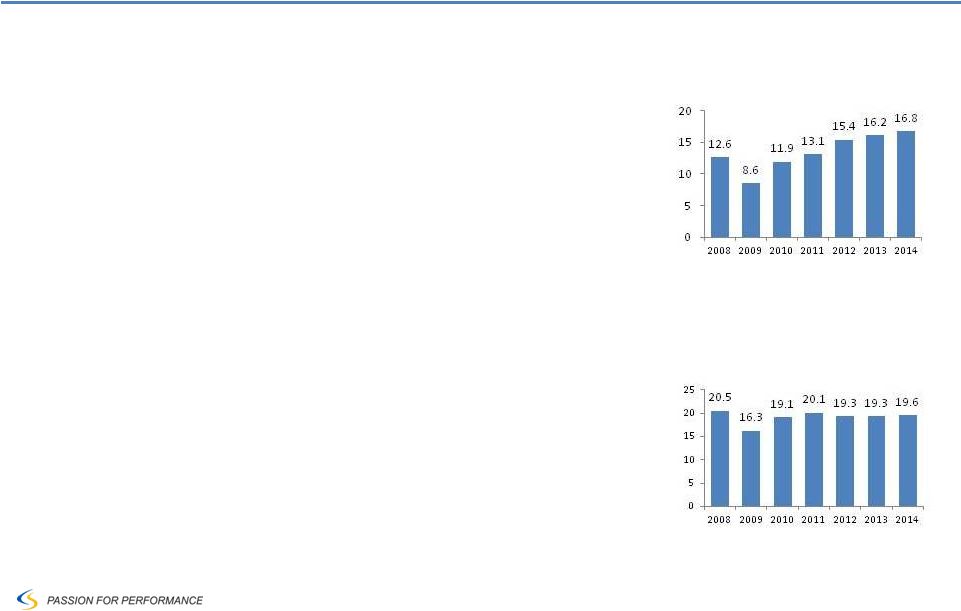
•
North America
–
Execution challenges related to ramp up of new
technologies and product offerings in Sealing &
Trim
•
Net $13M of excess nonrecurring costs in fourth quarter
–
Additional operating costs to meet accelerated
production volume
•
Europe
–
Excess manufacturing capacity and country mix
–
Weak volume at key customers
North America and Europe Operating Challenges
North America
Production Volume
Europe
Production Volume
millions
millions |
 15
15
EBITDA and Adjusted EBITDA Reconciliation
$ USD Millions
2012
2013
Net income
Income tax expense (benefit)
EBITDA
Restructuring, net of noncontrolling interest
Adjusted EBITDA
Twelve Months Ended Dec 31,
Interest expense, net of interest income
Depreciation and amortization
EBITDA and Adjusted EBITDA are Non-GAAP measures. See appendix.
$ 102.8
$ 298.0
$ 287.4
$ 47.9
Note: Numbers subject to rounding
Stock based compensation
Payment to former CEO and transition cost
(31.5)
44.8
122.7
$ 238.8
25.8
9.8
11.5
Noncontrolling interest deferred tax valuation reversal
2.0
45.6
54.9
111.1
$ 259.5
21.2
5.2
-
Acquisition related and other costs
1.5
-
-
Impairment charges
10.1
- |
 16
16
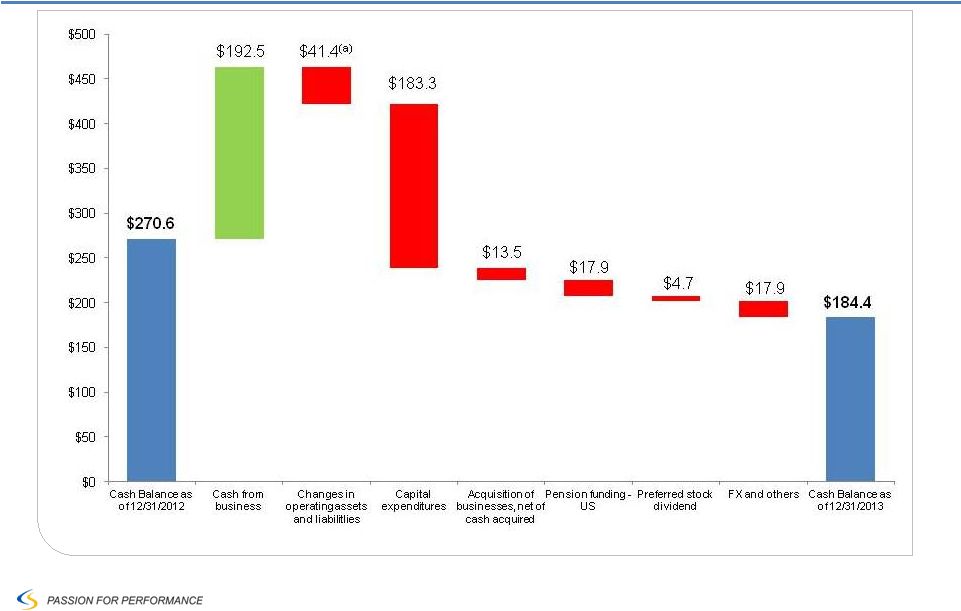
Full Year 2013 Cash Flow
Note: Numbers subject to rounding
$ USD Millions
(a) Includes $30 million tooling expense |
 17
17
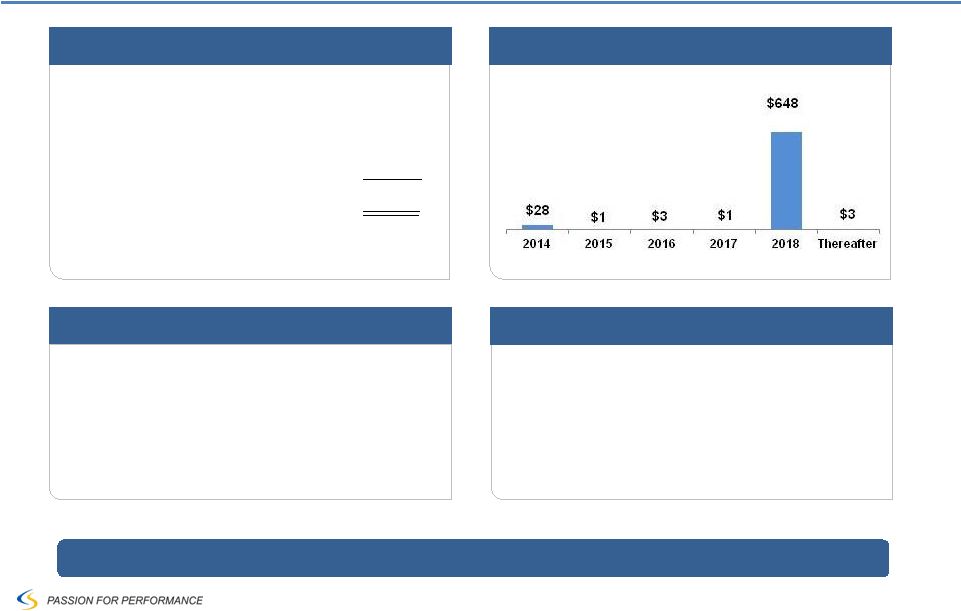
Strong Capital Structure and Liquidity
Cash on Balance Sheet
$184.4
ABL Revolver commitments
(1)
150.0
Letters of Credit
(36.7)
$ 297.7
(1) Availability limited by borrowing base
Sufficient liquidity to support growth
•
Net leverage:
$ 500.0 M
•
Net leverage ratio:
1.7
•
Interest coverage ratio:
5.2 x
Key Financial Ratios
$ USD Millions
Liquidity
Pension Liability
•
Substantially all US Pension frozen with
minimum accrued interest requirements
•
2014 Pension contributions approximately
$15.0 million
$ USD Millions
Debt Maturity Table |
 18
18
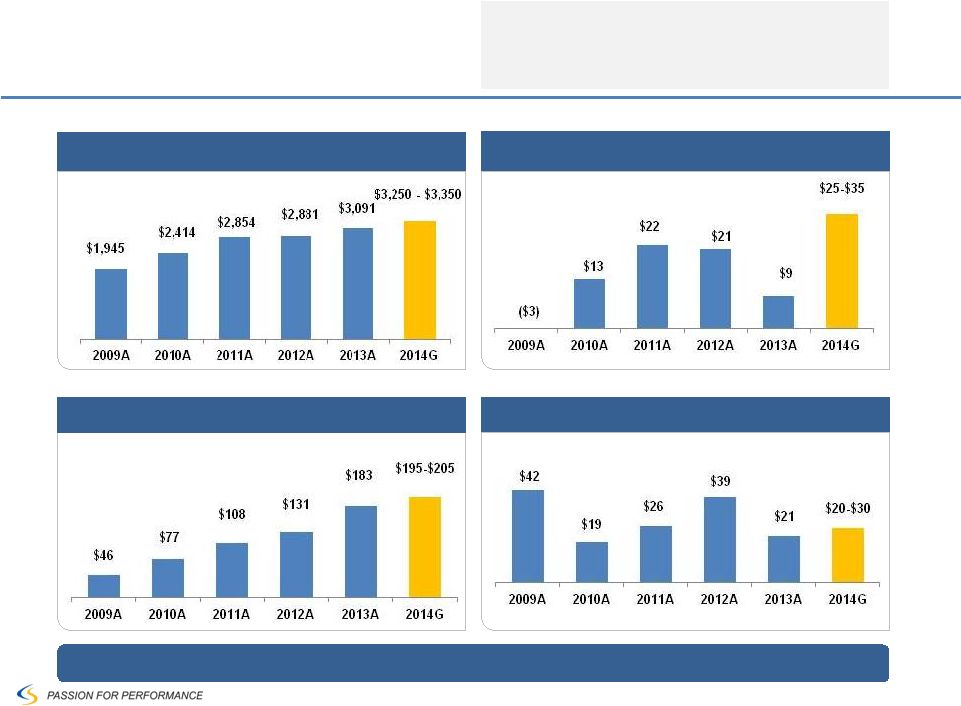
2014 Guidance
Key Assumptions:
North American production
16.8 million
European (including Russia) production
19.6 million
Average full year exchange rate
$1.28/Euro
$ USD Millions
*G=Guidance
Revenues
Cash Taxes
Cash Restructuring
Return to double digit adjusted EBITDA margin and improved ROIC
$ USD Millions
Capital Expenditures
$ USD Millions
$ USD Millions |
 19
19
Summary
•
Focused on stabilizing North America and Europe businesses performance
–
Addressing launch and product complexity in Sealing & Trim business
•
Continue to make necessary infrastructure / capacity investments
–
Asia growth strategy
–
Serbia expansion
•
Evaluate partnerships and acquisition opportunities to advance our
strategic plan
Laser
focus
on
new
launches
and
achieving
double digit adjusted EBITDA margins |
 20
Q&A |
 21
Appendix |
 22
22
Net Leverage Ratio and Adj. EBITDA % Margin
as of December 31, 2013
($ USD Millions)
(1)
Includes non-cash restructuring.
(2)
Proportionate share of restructuring costs related to Cooper Standard France joint
venture. (3)
Non-cash stock amortization expense and non-cash stock option expense for grants
issued at time of the Company's 2010 reorganization. (4)
Write-up of inventory to fair value for the Jyco acquisition
(5)
Costs incurred in relation to the Jyco acquisition
Note: Numbers subject to rounding
Three Months Ended
Twelve Months
Ended
Mar 31,
2013
Jun 30,
2013
Sep 30,
2013
Dec 31,
2013
Dec 31, 2013
Net income (loss)
$ 20.7
$ 27.4
$ 20.6
$ (20.8)
$
47.9 Income tax expense
7.9
12.2
4.5
21.0
45.6
Interest expense, net of interest income
11.2
13.6
15.2
14.9
54.9
Depreciation and amortization
29.8
28.2
25.2
27.9
111.1
EBITDA
$ 69.6
$ 81.4
$ 65.5
$ 43.0
$ 259.5
Restructuring
(1)
4.8
1.0
1.9
14.0
21.7
Noncontrolling interest restructuring
(2)
(0.7)
(0.1)
-
0.3
(0.5)
Stock-based compensation
(3)
2.7
0.5
1.1
0.9
5.2
Inventory write-up
(4)
-
-
0.3
-
0.3
Acquisition costs
(5)
-
-
0.7
0.2
0.9
Other
0.3
(0.3)
-
0.3
0.3
Adjusted EBITDA
$ 76.7
$ 82.5
$ 69.5
$ 58.7
$ 287.4
Net Leverage
Debt payable within one year
28.3
Long-term debt
656.1
Less: cash and cash equivalents
(184.4)
Net Leverage
$ 500.0
Net Leverage Ratio
1.7
Interest coverage ratio
5.2
Sales
$ 747.6
$ 784.7
$ 764.1
$ 794.2
$ 3,090.5
Adjusted EBITDA as a percent of Sales
10.3%
10.5%
9.1%
7.4%
9.3% |
 23
23
EBITDA and Adjusted EBITDA –
Twelve Months Ended December 31, 2012
Note: Numbers subject to rounding
($ USD Millions)
(1)
Includes cash and non-cash restructuring.
(2)
Proportionate
share
of
restructuringcosts
related
to
FMEA
joint
venture.
(3)
Non-cash stock amortization expense and non-cash stock option expense for grants
issued at emergence from bankruptcy. (4)
Impairment charges related to goodwill ($2.8 million) and fixed assets ($7.3 million)
(5)
Executive compensation for retired CEO and recruiting costs related to search for new
CEO (6)
Noncontrolling interest deferred tax valuation reversal
Three Months Ended
Twelve
Months
Ended
Mar 31,
2012
Jun 30,
2012
Sep 30,
2012
Dec 31,
2012
Dec 31,
2012
Net income (loss)
$ 23.8
$ 77.3
$ 11.6
$ (9.9)
$ 102.8
Provision for income tax expense (benefit)
8.1
(46.2)
5.4
1.2
(31.5)
Interest expense, net of interest income
11.2
10.8
11.3
11.5
44.8
Depreciation and amortization
31.6
30.5
29.1
31.5
122.7
EBITDA
$ 74.7
$ 72.4
$ 57.4
$ 34.3
$ 238.8
Restructuring
(1)
6.1
(0.5)
10.2
13.0
28.8
Noncontrolling interest restructuring
(2)
(0.3)
-
(0.2)
(2.5)
(3.0)
Stock-based compensation
(3)
2.7
2.2
2.4
2.5
9.8
Impairment charges
(4)
-
-
-
10.1
10.1
Payment to former CEO and transition cost
(5)
-
-
-
11.5
11.5
Noncontrolling deferred tax valuation reversal
(6)
-
-
-
2.0
2.0
Adjusted EBITDA
$ 83.2
$ 74.1
$ 69.8
$ 70.9
$ 298.0
Sales
765.3
734.5
684.0
697.1
2,880.9
Adjusted EBITDA as a percent of Sales
10.9%
10.1%
10.2%
10.2%
10.3% |
 24
24
Non-GAAP Financial Measures
EBITDA and adjusted EBITDA are measures not recognized under Generally Accepted
Accounting Principles (GAAP) which exclude certain non-cash and non-recurring items.
When analyzing the company’s operating performance, investors should use EBITDA
and adjusted EBITDA in addition to, and not as alternatives for, net
income (loss), operating
income, or any other performance measure derived in accordance with GAAP, or as an
alternative to cash flow from operating activities as a measure of the company’s
performance. EBITDA and adjusted EBITDA have limitations as analytical tools and should
not
be
considered
in
isolation
or
as
substitutes
for
analysis
of
the
company’s
results
of
operations as reported under GAAP. Other companies may report EBITDA and adjusted
EBITDA differently and therefore Cooper Standard’s results may not be comparable to
other similarly titled measures of other companies. |