Attached files
| file | filename |
|---|---|
| 8-K - 8-K - STIFEL FINANCIAL CORP | d682695d8k.htm |
| EX-99.1 - EX-99.1 - STIFEL FINANCIAL CORP | d682695dex991.htm |
 4
th
Quarter and Full-Year 2013
Financial Results Presentation
February 24, 2014
Exhibit 99.2 |
 Disclaimer
Forward-Looking Statements
This
presentation
may
contain
“forward-looking
statements”
within
the
meaning
of
the
Private
Securities
Litigation
Reform
Act
of
1995
that
involve
significant
risks,
assumptions,
and
uncertainties,
including
statements
relating
to
the
market
opportunity
and
future
business
prospects
of
Stifel
Financial
Corp.,
as
well
as
Stifel,
Nicolaus
&
Company,
Incorporated
and
its
subsidiaries
(collectively,
“SF”
or
the
“Company”).
These
statements
can
be
identified
by
the
use
of
the
words
“may,”
“will,”
“should,”
“could,”
“would,”
“plan,”
“potential,”
“estimate,”
“project,”
“believe,”
“intend,”
“anticipate,”
“expect,”
and
similar
expressions.
In
particular,
these
statements
may
refer
to
our
goals,
intentions,
and
expectations,
our
business
plans
and
growth
strategies,
our
ability
to
integrate
and
manage
our
acquired
businesses,
estimates
of
our
risks
and
future
costs
and
benefits,
and
forecasted
demographic
and
economic
trends
relating
to
our
industry.
You
should
not
place
undue
reliance
on
any
forward-looking
statements,
which
speak
only
as
of
the
date
they
were
made.
We
will
not
update
these
forward-looking
statements,
even
though
our
situation
may
change
in
the
future,
unless
we
are
obligated
to
do
so
under
federal securities
laws.
Actual
results
may
differ
materially
and
reported
results
should
not
be
considered
as
an
indication
of
future
performance.
Factors
that
could
cause
actual
results
to
differ
are
included
in
the
Company’s
annual
and
quarterly
reports
and
from
time
to
time
in
other
reports
filed
by
the
Company
with
the
Securities
and
Exchange
Commission
and
include,
among
other
things,
changes
in
general
economic
and
business
conditions,
actions
of
competitors,
regulatory
and
legal
actions,
changes
in
legislation,
and
technology
changes.
Use of Non-GAAP Financial Measures
The
Company
utilized
non-GAAP
calculations
of
presented
net
revenues,
compensation
and
benefits,
non-compensation
operating
expenses,
income
before
income
taxes,
provision
for
income
taxes,
net
income,
compensation
and
non-compensation
operating
expense
ratios,
pre-tax
margin
and
diluted
earnings
per
share
as
an
additional
measure
to
aid
in
understanding
and
analyzing
the
Company’s
financial
results
for
the
three
and
six
months
ended
June
30,
2013.
Specifically,
the
Company
believes
that
the
non-GAAP
measures
provide
useful
information
by
excluding
certain
items
that
may
not
be
indicative
of
the
Company’s
core
operating
results
and
business
outlook.
The
Company
believes
that
these
non-GAAP
measures
will
allow
for
a
better
evaluation
of
the
operating
performance
of
the
business
and
facilitate
a
meaningful
comparison
of
the
Company’s
results
in
the
current
period
to
those
in
prior
periods
and
future
periods.
Reference
to
these
non-GAAP
measures
should
not
be
considered
as
a
substitute
for
results
that
are
presented
in
a
manner
consistent
with
GAAP.
These
non-GAAP
measures
are
provided
to
enhance
investors'
overall
understanding
of
the
Company’s
financial
performance. |
 Chairman’s
Comments “We
are
very
pleased
to
post
our
18th
consecutive
year
of
record
net
revenues.
This
speaks
to
the
dedication
of
our
over
5,800
professionals,
as
well
as
to
our
balanced
business
model.
Non-GAAP
net
income
from
continuing
operations
for
the
year
improved
over
the
prior
year
as
a
result
of
both
better
market
conditions
and
the
benefits
of
our
recent
acquisitions.
Looking
forward,
we
will
continue
to
take
advantage
of
opportunities
in
the
marketplace
that
add
to
shareholder
value.” |
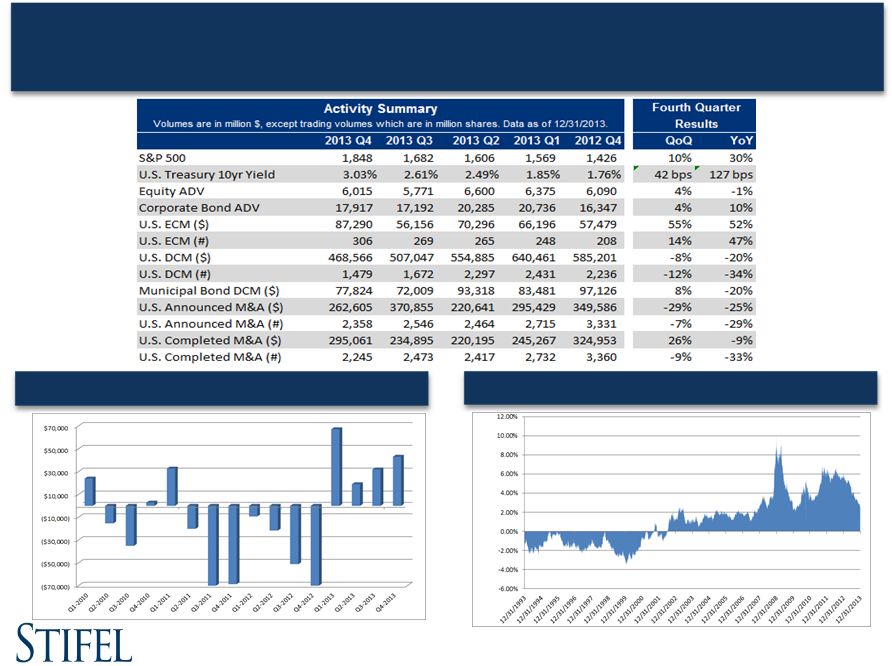 Market
Overview Domestic Equity Flows
Equity Risk Premium
(1)
(1)
Based on the Daily Treasury Yield Curve Rates I10 year)
Source: Investment Company Institute |
 2013: A Year in
Review Stifel’s 18
th
Consecutive Year of Record Net Revenues
•
Successfully completed the merger and integration with KBW.
•
Acquired and integrated the fixed income business of Knight Capital Group in July of 2013,
adding to Stifel’s already impressive fixed income capabilities.
•
The Institutional Group achieved record flow levels and record investment banking
revenues. Continued to
gain market share in the year and completed a number of unique and high profile financings for
clients. •
Assets at Stifel Bank reached $5.1 billion, while the risk profile remained
conservative. •
Welcomed Ziegler Lotsoff Capital Management to the firm’s asset management efforts.
•
Welcomed 138 new Financial Advisors to the Private Client Group and opened 11 new offices in
2013. •
Strong stock performance, which ended the year at $47.92 up 49% from the start of the year. In
the last fifteen years SF is up over 1,340%. |
 Stifel’s
Stock Performance |
 Top Performing
Stock Cumulative Price Appreciation as of December 31, 2013 |
 Financial
Results |
 Stifel Financial
Corp. Results Three months ended December 31, 2013
(1)
Non-core
adjustments
consist
of
merger-related
revenues
and
expenses
associated
with
our
acquisitions
of
KBW,
the
Knight
Capital
Fixed
Income
business,
and
Miller
Buckfire
and
discontinued
operations
of
SN
Canada.
(2)
Core
(non-GAAP)
results
for
the
three
months
ended
December
31,
2012
are
the
same
as
GAAP
results.
Results
for
the
three
months
ended
September
30,
2013
are
Core
(non-GAAP).
_________________________________________________________
($ in thousands, except per share amounts)
Non-GAAP
Non-Core
GAAP
12/31/12
% Change
9/30/13
% Change
Total revenues
576,236
$
(2,080)
$
574,156
$
419,885
$
37.2%
491,169
$
17.3%
Interest expense
11,555
75
11,630
8,602
34.3%
11,535
0.2%
Net revenues
564,681
(2,155)
562,526
411,283
37.3%
479,634
$
17.7%
Compensation and benefits
347,263
5,944
353,207
258,148
34.5%
297,374
16.8%
Non-comp operating expenses
126,990
4,340
131,330
92,784
36.9%
116,817
8.7%
Total non-interest expenses
474,253
10,284
484,537
350,932
35.1%
414,191
14.5%
Income from continuing operations before income taxes
90,428
(12,439)
77,989
60,351
49.8%
65,443
38.2%
Provision for income taxes
30,609
(4,746)
25,863
17,067
79.3%
25,795
18.7%
Net income from continuing operations
59,819
$
(7,693)
$
52,126
$
43,284
$
38.2%
39,648
$
50.9%
Discontinued operations:
Loss from discontinued operations, net
-
(3,857)
(3,857)
(3,330)
nm
-
-
Net income
59,819
$
(11,550)
$
48,269
$
39,954
$
49.7%
39,648
$
50.9%
Earnings per diluted common share:
Income from continuing operations
0.79
$
(0.10)
$
0.69
$
0.80
$
(1.3%)
0.53
$
49.1%
Loss from discontinued operations
-
(0.05)
(0.05)
$
(0.06)
-
Earnings per diluted common share
0.79
$
(0.15)
$
0.64
$
0.74
$
6.8%
0.53
$
49.1%
Weighted average number of shares outstanding:
Diluted
75,495
75,495
63,301
19.3%
75,191
0.4%
Ratios to net revenues
:
Compensation and benefits
61.5%
62.8%
62.7%
62.0%
Non-comp operating expenses
22.5%
23.3%
22.6%
24.4%
Income from continuing operations before income taxes
16.0%
13.9%
14.7%
13.6%
Three Months Ended December 31, 2013
Three Months Ended
(1)
(2)
(2) |
 Stifel
Financial Corp. Results Year ended December 31, 2013
(1)
Non-core
adjustments
consist
of
charges
related
to
expensing
stock
awards
issued
as
retention
in
connection
with
the
acquisitions
of
KBW
and
the
Knight
Capital
Fixed
Income
business
and
other
merger-related
revenues
and
expenses
associated
with
our
acquisitions
of
KBW,
the
Knight
Capital
Fixed
Income
business,
Miller
Buckfire
and
a
U.S.
tax
benefit
in
connection
with
discontinuing
operations
of
SN
Canada.
(2)
Core
(non-GAAP)
results
for
the
year
ended
December
31,
2012
are
the
same
as
GAAP
results.
_________________________________________________________
($ in thousands, except per share amounts)
Non-GAAP
Non-Core
GAAP
12/31/12
% Change
Total revenues
2,024,538
$
(4,724)
$
2,019,814
$
1,627,483
$
24.4%
Interest expense
46,198
170
46,368
33,370
38.4%
Net revenues
1,978,340
(4,894)
1,973,446
1,594,113
24.1%
Compensation and benefits
1,236,991
74,395
1,311,386
1,010,140
22.5%
Non-comp operating expenses
446,265
30,566
476,831
354,226
26.0%
Total non-interest expenses
1,683,256
104,961
1,788,217
1,364,366
23.4%
Income from continuing operations before income taxes
295,084
(109,855)
185,229
229,747
28.4%
Provision for income taxes
110,426
(98,104)
12,322
84,451
30.8%
Net income from continuing operations
184,658
$
(11,751)
$
172,907
$
145,296
$
27.1%
Discontinued operations:
Loss from discontinued operations, net
-
(10,894)
(10,894)
(6,723)
(100.0%)
Net income
184,658
$
(22,645)
$
162,013
$
138,573
$
33.3%
Earnings per diluted common share:
Income from continuing operations
2.51
$
(0.16)
$
2.35
$
2.31
$
8.7%
Loss from discontinued operations, net
-
(0.15)
(0.15)
(0.11)
(100.0%)
Earnings per diluted common share
2.51
$
(0.31)
$
2.20
$
2.20
$
14.1%
Weighted average number of shares outstanding:
Diluted
73,504
73,504
62,937
16.8%
Ratios to net revenues
:
Compensation and benefits
62.5%
66.5%
63.4%
Non-comp operating expenses
22.6%
24.1%
22.2%
Income from continuing operations before income taxes
14.9%
9.4%
14.4%
Year Ended December 31, 2013
Year Ended |
 Source of
Revenues ($ in thousands)
12/31/13
12/31/12
%
Change
9/30/13
%
Change
12/31/13
12/31/12
%
Change
Commissions
152,451
$
131,327
$
16.1%
145,837
$
4.5%
598,949
$
501,434
$
19.4%
Principal transactions
118,815
97,515
21.8%
122,583
(3.1%)
459,968
408,935
12.5%
Brokerage revenues
271,266
228,842
18.5%
268,420
1.1%
1,058,917
910,369
16.3%
Capital raising
71,379
46,320
54.1%
53,665
33.0%
246,631
185,761
32.8%
Advisory
87,481
26,618
228.7%
39,186
123.2%
201,429
95,519
110.9%
Investment banking
158,860
72,938
117.8%
92,851
71.1%
448,060
281,280
59.3%
Asset mgt and service fees
83,928
68,971
21.7%
76,710
9.4%
305,639
257,981
18.5%
Other
19,391
19,157
1.2%
13,063
48.4%
64,659
69,148
(6.5%)
Total operating revenues
533,445
389,908
36.8%
451,044
18.3%
1,877,275
1,518,778
23.6%
Interest revenue
40,711
29,977
35.8%
39,130
4.0%
142,539
108,705
31.1%
Total revenues
574,156
419,885
36.7%
490,174
17.1%
2,019,814
1,627,483
24.1%
Interest expense
11,630
8,602
35.2%
11,535
0.8%
46,368
33,370
39.0%
Net revenues
562,526
$
411,283
$
36.8%
478,639
$
17.5%
1,973,446
$
1,594,113
$
23.8%
Three Months Ended
Year Ended |
 ($ in
thousands) 12/31/13
12/31/12
%
Change
9/30/13
%
Change
12/31/13
12/31/12
%
Change
Private client group
159,958
$
146,585
$
9.1%
158,085
$
1.2%
637,325
$
586,878
$
8.6%
Equity brokerage
60,204
38,659
55.7%
58,677
2.6%
232,392
151,308
53.6%
Fixed income brokerage
51,103
43,598
17.2%
51,658
(1.1%)
189,200
172,183
9.9%
Institutional brokerage
111,307
82,257
35.3%
110,335
0.9%
421,592
323,491
30.3%
Total Brokerage Revenues
271,265
$
228,842
$
18.5%
268,420
$
1.1%
1,058,917
$
910,369
$
16.3%
Three Months Ended
Year Ended
Brokerage Revenues by Segment |
 ($ in
thousands) 12/31/13
(1)
12/31/12
% Change
9/30/13
% Change
12/31/13
(1)
12/31/12
9/30/13
Net revenues
564,681
$
411,283
$
37.3%
479,634
$
17.7%
100.0%
100.0%
100.0%
Compensation and benefits
324,569
237,465
36.7%
275,503
17.8%
57.5%
57.7%
57.4%
Transitional pay
(2)
22,694
20,683
9.7%
21,871
3.8%
4.0%
5.0%
4.6%
Total compensation and benefits
347,263
258,148
34.5%
297,374
16.8%
61.5%
62.8%
62.0%
Occupancy and equipment rental
40,892
33,589
21.7%
39,856
2.6%
7.2%
8.2%
8.3%
Communication and office supplies
24,974
19,291
29.5%
25,105
(0.5%)
4.4%
4.7%
5.2%
Commissions and floor brokerage
8,213
7,271
13.0%
9,775
(16.0%)
1.5%
1.8%
2.0%
Other operating expenses
52,911
32,633
62.1%
42,080
25.7%
9.3%
7.9%
8.7%
Total non-comp operating expenses
126,990
92,784
36.9%
116,816
8.7%
22.4%
22.6%
24.4%
Total non-interest expense
474,253
350,932
35.1%
414,190
14.5%
84.0%
85.3%
86.4%
Income from continuing operations before income taxes
90,428
60,351
49.8%
65,444
38.2%
16.0%
14.7%
13.6%
Provision for income taxes
30,609
17,067
79.3%
25,795
18.7%
5.4%
4.0%
5.4%
Non-GAAP net income from continuing operations
59,819
$
43,284
$
38.2%
39,649
$
50.9%
10.6%
10.5%
8.3%
Non-core expenses (after-tax)
(7,693)
-
35,280
GAAP net income from continuing operations
52,126
$
43,284
$
74,929
$
Three Months Ended
% of Net revenues
Core Non-Interest Expenses
Three months ended December 31, 2013
_________________________________________________________
(1)
Excludes
non-core
adjustments
consisting
of
merger-related
revenues
and
expenses
associated
with
our
acquisitions
of
KBW,
the
Knight
Capital
Fixed
Income
business,
and
Miller
Buckfire.
(2)
Transition
pay
includes
amortization
of
retention
awards,
signing
bonuses,
and
upfront
notes. |
 Core
Non-Interest Expenses Year ended December 31, 2013
_________________________________________________________
(1)
Excludes
non-core
adjustments
consisting
of
charges
related
to
expensing
stock
awards
issued
as
retention
in
connection
with
the
acquisitions
of
KBW
and
the
Knight
Capital
Fixed
Income
business
and
other
merger-related
revenues
and
expenses
associated
with
our
acquisitions
of
KBW,
the
Knight
Capital
Fixed
Income
business,
Miller
Buckfire
and
a
U.S.
tax
benefit
in
connection
with
discontinuing
operations
of
SN
Canada.
($ in thousands)
12/31/13
(1)
12/31/12
% Change
12/31/13
(1)
12/31/12
Net revenues
1,978,340
$
1,594,113
$
24.1%
100.0%
100.0%
Compensation and benefits
1,150,883
937,066
22.8%
58.2%
58.8%
Transitional pay
86,108
73,074
17.8%
4.4%
4.6%
Total compensation and benefits
1,236,991
1,010,140
22.5%
62.5%
63.4%
Occupancy and equipment rental
149,488
128,365
16.5%
7.6%
8.1%
Communication and office supplies
95,539
79,406
20.3%
4.8%
5.0%
Commissions and floor brokerage
35,812
29,610
20.9%
1.8%
1.9%
Other operating expenses
165,426
116,845
41.6%
8.4%
7.3%
Total non-comp operating expenses
446,265
354,226
26.0%
22.6%
22.2%
Total non-interest expense
1,683,256
1,364,366
23.4%
85.1%
85.6%
Income from continuing operations before income taxes
295,084
229,747
28.4%
14.9%
14.4%
Provision for income taxes
110,426
84,451
30.8%
5.6%
5.2%
Non-GAAP net income from continuing operations
184,658
$
145,296
$
27.1%
9.3%
9.1%
Non-core expenses (after-tax)
(11,751)
-
GAAP net income from continuing operations
172,907
$
145,296
$
Year Ended
% of Net revenues |
 Segment
Comparison - Core
(1)
Core
(non-GAAP)
results
for
the
three
and
twelve
months
ended
December
31,
2012
are
the
same
as
GAAP
results.
(2)
Contribution
margin
for
the
other
segment
is
divided
by
consolidated
net
revenues.
_________________________________________________________
($ in thousands)
12/31/13
12/31/12
(1)
%
Change
9/30/13
%
Change
12/31/13
12/31/12
(1)
%
Change
Net revenues:
Global Wealth Management
292,836
$
253,775
$
15.4%
274,669
$
6.6%
1,117,179
$
991,597
$
12.7%
Institutional Group
267,282
160,693
66.3%
205,132
30.3%
861,158
604,654
42.4%
Other
4,563
(3,185)
(243.3%)
(167)
nm
3
(2,138)
(100.1%)
564,681
$
411,283
$
37.3%
479,634
$
17.7%
1,978,340
$
1,594,113
$
24.1%
Operating contribution:
Global Wealth Management
79,022
$
68,737
$
15.0%
72,128
$
9.6%
299,572
$
266,669
$
12.3%
Institutional Group
48,590
21,678
124.1%
34,986
38.9%
142,889
101,487
40.8%
Other
(37,184)
(30,064)
23.7%
(41,671)
(10.8%)
(147,377)
(138,409)
6.5%
90,428
$
60,351
$
49.8%
65,443
$
38.2%
295,084
$
229,747
$
28.4%
Operating contribution
(2)
Global Wealth Management
27.0
27.1
26.3
26.8
26.9
Institutional Group
18.2
13.5
17.1
16.6
16.8
Other
(6.6)
(7.3)
(8.7)
(7.4)
(8.7)
16.0
14.7
13.6
14.9
14.4
As a percentage of net revenues:
Three Months Ended
Year Ended |
 Global Wealth
Management ($ in thousands)
12/31/13
12/31/12
% Change
9/30/13
% Change
12/31/13
12/31/12
% Change
Commissions
104,149
$
93,043
$
11.9%
99,427
$
4.7%
410,238
$
361,871
$
13.4%
Principal transactions
55,809
53,542
4.2%
58,658
(4.9%)
227,087
225,007
0.9%
Asset management & service fees
82,964
68,631
20.9%
76,667
8.2%
304,541
257,257
18.4%
Net interest
31,092
21,182
46.8%
27,665
12.4%
104,748
79,328
32.0%
Investment banking
9,568
10,818
(11.6%)
9,394
1.8%
45,400
44,919
1.1%
Other income
9,254
6,559
41.1%
2,858
223.9%
25,165
23,215
8.4%
Net revenues
292,836
253,775
15.4%
274,669
6.6%
1,117,179
991,597
12.7%
Compensation and benefits
167,980
146,311
14.8%
159,949
5.0%
648,681
576,744
12.5%
Non-comp operating expenses
45,834
38,727
18.4%
42,592
7.6%
168,926
148,184
14.0%
Total non-interest expenses
213,814
185,038
15.6%
202,541
5.6%
817,607
724,928
12.8%
Income before income taxes
79,022
$
68,737
$
15.0%
72,128
$
9.6%
299,572
$
266,669
$
12.3%
Ratios to net revenues
:
Compensation and benefits
57.4%
57.7%
58.2%
58.1%
58.2%
Non-comp operating expenses
15.6%
15.2%
15.5%
15.1%
14.9%
Income before income taxes
27.0%
27.1%
26.3%
26.8%
26.9%
Three Months Ended
Year Ended |
 Stifel Bank
& Trust (an operating unit of GWM)
As of
12/31/13
12/31/12
% Change
9/30/13
% Change
Assets
$
5,027,023
$
3,650,235
37.7
$
4,547,071
10.6
Investment securities
3,062,549
2,327,316
31.6
2,949,080
3.8
Retained loans, net
1,412,136
822,711
71.6
1,061,313
33.1
Loans held for sale
109,110
214,531
(49.1)
75,440
44.6
Deposits
4,663,323
3,346,133
39.4
4,228,405
10.3
Allowance for loan losses
12,668
$
8,145
$
55.5
13,233
$
(4.3)
Allowance as a percentage of loans
0.89
%
0.99
%
1.23
%
Non-performing loans
1,504
$
1,808
$
(16.8)
14,759
$
(89.8)
Other non-performing assets
131
373
(64.9)
-
100.0
Non-performing assets
1,635
$
2,181
$
(25.0)
14,759
$
(88.9)
Non-performing assets as a percentage of
total assets
0.03
%
0.06
%
0.32
%
As of |
 Institutional
Group ($ in thousands)
12/31/13
12/31/12
% Change
9/30/13
% Change
12/31/13
12/31/12
% Change
Net revenues
267,282
$
160,693
$
66.3%
205,132
$
30.3%
861,158
$
604,654
$
42.4%
Compensation and benefits
165,779
105,025
57.8%
119,874
38.3%
524,870
380,185
38.1%
Non-comp operating expenses
52,913
33,990
55.7%
50,272
5.3%
193,399
122,982
57.3%
Total non-interest expenses
218,692
139,015
57.3%
170,146
28.5%
718,269
503,167
42.7%
Income before income taxes
48,590
$
21,678
$
124.1%
34,986
$
38.9%
142,889
$
101,487
$
40.8%
Ratios to net revenues:
Compensation and benefits
62.0%
65.4%
58.4%
60.9%
62.9%
Non-comp operating expenses
19.8%
21.1%
24.5%
22.5%
20.3%
Income before income taxes
18.2%
13.5%
17.1%
16.6%
16.8%
Three Months Ended
Year Ended |
 Institutional
Group Revenues ($ in thousands)
12/31/13
12/31/12
% Change
9/30/13
% Change
12/31/13
12/31/12
% Change
Institutional brokerage:
Equity
60,204
$
38,659
$
55.7%
58,677
$
2.6%
232,392
$
151,308
$
53.6%
Fixed income
51,103
43,598
17.2%
51,658
(1.1%)
189,200
172,183
9.9%
111,307
82,257
35.3%
110,335
0.9%
421,592
323,491
30.3%
Investment Banking:
Capital raising
Equity
46,634
16,947
175.2%
30,739
51.7%
142,636
81,818
74.3%
Fixed income
14,677
18,555
(20.9%)
13,531
8.5%
58,096
59,024
(1.6%)
61,311
35,502
72.7%
44,270
38.5%
200,732
140,842
42.5%
Advisory fees
87,981
26,618
230.5%
39,186
124.5%
201,928
95,519
111.4%
Investment banking
149,292
62,120
140.3%
83,456
78.9%
402,660
236,361
70.4%
Other
(1)
6,683
16,316
(59.0%)
11,341
(41.1%)
36,906
44,802
(17.6%)
Total net revenue
267,282
$
160,693
$
66.3%
205,132
$
30.3%
861,158
$
604,654
$
42.4%
Three Months Ended
Year Ended
_________________________________________________________
(1)
Includes
net
interest
and
other
income. |
 ($ in
thousands) 12/31/13
12/31/12
12/31/11
12/31/10
12/31/09
Investment banking
448,060
281,280
199,584
218,104
125,807
Year Ended
Historical Investment Banking Revenues
Note: Reflects total investment banking historical revenues.
_________________________________________________________
|
 Financial
Condition |
 Capital
Structure As of December 31, 2013
(in thousands, except ratios)
_________________________________________________________
(1)
Debt to equity ratio includes the debentures to Stifel Financial Capital Trusts ($82.5m), and
Senior Notes ($325.0m) divided by stockholders’equity. ($ in thousands)
Total Assets
9,016,987
$
Stockholders' Equity
2,058,849
$
6.70% senior notes, due 2022
175,000
$
5.375% senior notes, due 2022
150,000
Debentures to Stifel Financial Capital Trusts II, III, & IV
82,500
Total Capitalization
2,466,349
$
Ratios:
Debt to Equity
(1)
12.5%
Tier 1 Leverage Ratio
15.4%
Tier 1 Risk-Based Capital Ratio
26.7% |
 Other Financial
Data
_________________________________________________________
(1) Includes 143, 151 and 145 independent contractors as of December 31,
2013, December 31, 2012 and September 30, 2013, respectively.
(2) Includes money-market and FDIC-insured balances. Prior period
amounts have been adjusted to conform to the current period presentation.
As of
12/31/13
12/31/12
% Change
9/30/13
% Change
Total assets (000s):
Stifel Nicolaus & Stifel Financial
3,986,845
$
3,313,507
$
20.3%
4,162,388
$
(4.2%)
Stifel Bank
5,030,142
3,652,633
37.7%
4,547,071
10.6%
Total assets
9,016,987
$
6,966,140
$
29.4%
8,709,459
$
3.5%
Total stockholders' equity (000s):
Stifel Nicolaus & Stifel Financial
1,736,272
$
1,226,824
$
41.5%
1,701,158
$
2.1%
Stifel Bank
322,577
267,837
20.4%
293,331
10.0%
Total stockholders' equity
2,058,849
$
1,494,661
$
37.7%
1,994,489
$
3.2%
Leverage ratio:
Stifel Nicolaus & Stifel Financial
1.9
2.2
(16.7%)
1.9
(4.4%)
Stifel Bank
15.6
13.6
14.2%
15.5
0.6%
Total leverage ratio
3.7
4.0
(8.0%)
3.6
2.2%
Book value per common share
32.30
$
27.24
$
18.6%
31.46
$
2.7%
Financial
advisors
(1)
2,077
2,041
1.8%
2,075
0.1%
Full-time associates
5,862
5,343
9.7%
5,780
1.4%
Locations
357
340
5.0%
355
0.6%
Total
client
assets
(000s)
(2)
165,570,000
$
137,855,000
$
20.1%
153,901,000
$
7.6%
As of |
 Recent Merger
Updates |
 Recent Merger
Updates Announced the acquisition of De La Rosa on January 30, 2014 and is
expected to close in the first quarter. Plan to integrate under Stifel brand
immediately.
Investment bank and bond underwriter with a 25-year operating history.
Stifel will become #1 underwriter in California negotiated underwriting in
par value and number of issues.
Stifel will become #1 underwriter in California in the following
categories:
•
K-12
•
COP & Lease Revenue Bonds
•
Tax Increment
•
Economical Development
•
Water & Sewer.
Substantially all of the senior leadership has executed continuation
agreements with Stifel. |
 Q&A
|