Attached files
| file | filename |
|---|---|
| 8-K - UIL HOLDINGS CORPORATION 8-K 2-20-2014 - UIL HOLDINGS CORP | form8k.htm |
| EX-99.1 - EXHIBIT 99.1 - UIL HOLDINGS CORP | ex99_1.htm |

FY & 4Q ‘13 Earnings 4Q & FY ‘13 Earnings Presentation February 21, 2014 Exhibit 99.2


FY & 4Q ‘13 Earnings ‘13 Earnings Summary Strong financial performance – FY ’13 net income up 11% over FY ’12 $115.3M, or $2.18 per diluted share, in ‘13, an increase of $11.7M, compared to ‘12 ‘13 includes a net regulatory charge of $5.0M, after-tax, from the electric distribution ‘13 rate proceeding FY ‘13 net income up 16% over FY ‘12, excluding net regulatory charge $120.3M, or $2.28 per diluted share, in ‘13, an increase of $16.7M, compared to ’12 Executed on our strategic initiatives Invested in both electric & gas infrastructures Added 14,947 natural gas heating customers - 34% more than in ’12 Continued focus on short-term cost controls, which helped mitigate write-offs from electric rate case decision Return to normal weather – compared to abnormally warm weather in ‘12 Successfully completed equity offering – secured financial resources to execute on our strategic plans *
FY & 4Q ‘13 Earnings Strategic Initiatives Growth – through investment in both electric and gas infrastructures Disciplined capital investment program Growth – through addition of new natural gas heating customers Supported by state legislation Prudently managing costs Pursuing opportunities to make investments in projects that provide allowed returns Construction on renewables project is expected to begin in ‘14 Leveraging internal systems, such as SAP, that support the total enterprise *

FY & 4Q ‘13 Earnings Long-Term Organic Growth 10-yr Capex Forecast (‘14-’23) * * Includes Renewables - $47M ’14-’18 Amounts may not add due to rounding
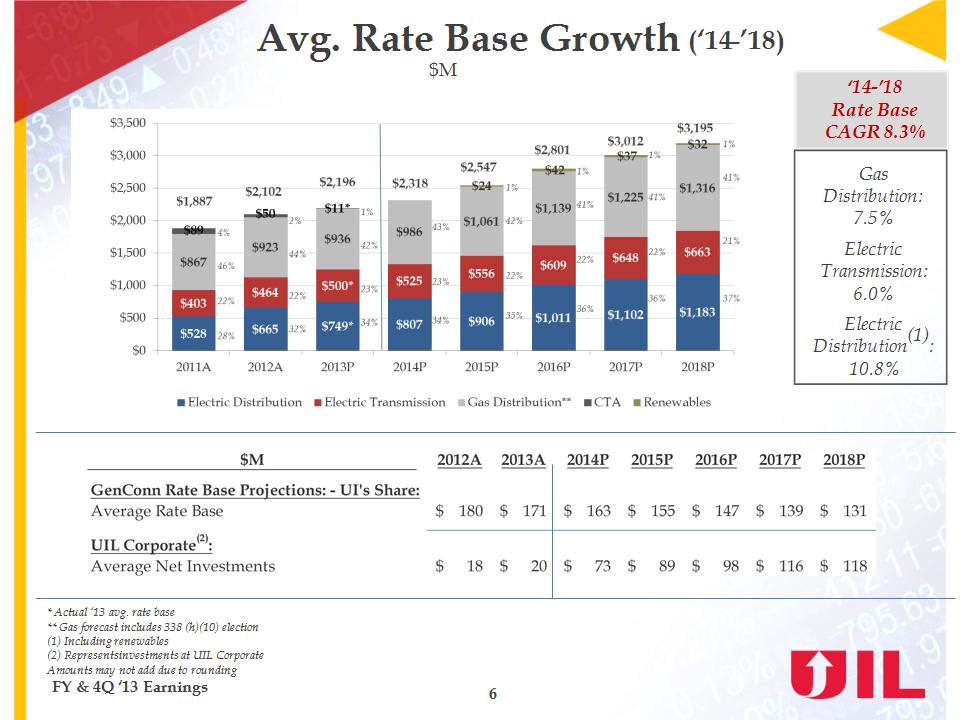
FY & 4Q ‘13 Earnings Avg. Rate Base Growth (‘14-’18) * * Actual ‘13 avg. rate base ** Gas forecast includes 338 (h)(10) election (1) Including renewables (2) Represents investments at UIL Corporate Amounts may not add due to rounding $M ‘14-’18 Rate Base CAGR 8.3% Gas Distribution: 7.5% Electric Transmission: 6.0% Electric Distribution(1): 10.8%

FY & 4Q ‘13 Earnings Gas Heating Customers Added 14,947 households & businesses in ‘13 - 34% more than in ‘12 Added 34,427 households & businesses over the three years ‘11-’13. Target was 30,000-35,000. ‘14 target - 15,800 households & businesses * ‘13 Additions by Company SCG – 44% CNG – 46% BGC – 10%

FY & 4Q ‘13 Earnings Gas Customer Additions ’10–’13 Actuals & Projections for ‘14–‘23 *

FY & 4Q ‘13 Earnings Regulatory Update Gas Distribution Rate Case - CNG Final decision issued by PURA on 1/29/14 Annual revenue - $7.25M 9.18% ROE, 52.52% equity, 0.11% preferred stock*, 47.37% debt capital structure Implementation of decoupling mechanism and system expansion reconciliation Cast iron/bare steel replacement program acceleration and rate tracker Implementation of earnings sharing mechanism of 50/50 Electric Distribution Rate Case Reconsideration Final decision on reconsideration issued by PURA on 12/16/13 Revenue - $20.3M year 1, $25.8M year 2 9.15% ROE, 50% equity, 50% debt capital structure Continuation of existing decoupling mechanism Recovery of $44.9M of storm-related costs Continuation of earnings sharing mechanism of 50/50 FERC ROE Complaint Final decision expected in ‘14 * * 2/13/14 – tender offer outstanding, to close on 3/4/14, unless extended or withdrawn

FY & 4Q ‘13 Earnings 4Q & FY ‘13 Financial Results by Segment *


4Q & FY ‘13 Financial Results - Details Gas distribution 4Q ’13 earnings of $21.1M, or $0.37 per diluted share, an increase of $6.8M, compared to 4Q ’12 -- increase primarily due to: Normal weather in 4Q ‘13 compared to abnormally warm weather in 4Q ‘12, increased customer growth and decreased O&M expenses FY ‘13 earnings of $45.4M, or $0.86 per diluted share, an increase of $13.2M, compared to YTD ’12 -- increase primarily due to: Normal weather in ’13 compared to abnormally warm weather in ’12 and Increased normalized usage per customer and customer growth, partially offset by The absence of $3.5M, pre-tax, weather insurance proceeds recorded in ’12 4Q & FY ‘13 weighted average heating degree days compared to normal & ‘12 * FY & 4Q ‘13 Earnings


FY & 4Q ‘13 Earnings 4Q & FY ‘13 Financial Results - Details Corporate 4Q ‘13 costs were $2.5M, or $0.05 per diluted share, an improvement of $1.0M, compared to 4Q ’12 -- improvement primarily due to: Tax benefits associated with unitary filing requirements for state income taxes & an increase in AFUDC FY ’13 costs were $10.4M, or $0.20 per diluted share, an improvement of $2.9M, compared to FY ’12 -- improvement primarily due to: Tax benefits associated with unitary filing requirements for state income taxes, an increase in AFUDC & income earned on Corporate investments at the holding company that support the total enterprise *

FY & 4Q ‘13 Earnings Debt Maturities & Liquidity Available Liquidity Debt Maturities ($M) * Remarket $27.5M of UI tax exempt bonds * * Equity Debt Moody’s Upgrade – outlook for each company is stable UIL to Baa2 from Baa3 UI to Baa1 from Baa2 CNG to A3 from Baa1 SCG to Baa1 from Baa2 BGC to Baa1 from Baa2


FY & 4Q ‘13 Earnings ‘14 Consolidated Earnings Guidance * ‘14 guidance reflects a full year’s dilution from the UIL equity issuance on 10/2/13. The approximate dilutive impact on ‘14 eps is $0.25 per diluted share.
FY & 4Q ‘13 Earnings ‘14 Earnings Guidance Assumptions Electric distribution & Other Retail revenue increase from the electric distribution ‘13 rate proceeding Decreases in pension & postretirement costs of approx. $6.0M, pre-tax, or $0.06 per diluted share – primarily driven by increases in discount rates as of 12/31/13 and favorable returns on pension assets during ‘13 Higher allocation of UIL corporate charges for earned returns on shared capital assets of approx. $5.5M, pre-tax, or $0.06 per diluted share, (while unfavorable for electric distribution, there is an earnings offset in UIL corporate) Electric transmission Assumes the electric transmission business earns its currently allowed ROE Excludes any potential impact from the ROE proceeding pending at the FERC Earnings are primarily driven by increased rate base and earnings from increased investments in the NEEWS transmission projects *


FY & 4Q ‘13 Earnings Questions