Attached files
| file | filename |
|---|---|
| 8-K - 8-K - Sunstone Hotel Investors, Inc. | a14-6398_18k.htm |
Exhibit 99.1
|
|
Recent Acquisitions, Capital Investment Plans and Finance Initiatives - February 2014 |
|
|
This presentation contains forward-looking statements that have been made pursuant to the provisions of the Private Securities Litigation Reform Act of 1995. These statements relate to future events or our future financial performance. In some cases, you can identify forward-looking statements by terminology such as “anticipate,” “believe,” “continue,” “could,” “estimate,” “expect,” “intend,” “may,” “plan,” “predict,” “project,” “should,” “will” or the negative of such terms and other comparable terminology. These statements are only predictions. Actual events or results may differ materially from those expressed or implied by these forward-looking statements. In evaluating these statements, you should specifically consider the risks outlined in detail under the heading “Risk Factors” in our Annual Report on Form 10-K, filed with the Securities and Exchange Commission (“SEC”) on February 25, 2013, including, but not limited to, the following factors: general economic and business conditions affecting the lodging and travel industry, both nationally and locally, including a U.S. recession; the need to operate as a REIT and comply with other applicable laws and regulations; rising operating expenses; relationships with and requirements of franchisors and hotel brands; relationships with and the performance of the managers of our hotels; the ground, operating or air leases for 10 of the 29 hotels; our ability to complete acquisitions and dispositions; and competition for the acquisition of hotels. These factors may cause our actual events to differ materially from the expectations expressed or implied by any forward-looking statement. We do not undertake to update any forward-looking statement. This presentation includes non-GAAP financial information that the issuer considers useful to investors as a key measure of operating performance. A reconciliation to U.S. GAAP can be found in the Investor Relations section of the company’s website at www.sunstonehotels.com. Forward-Looking Statements |
|
|
Table of Contents Boston Park Plaza Hyatt Regency San Francisco Finance Initiatives |
|
|
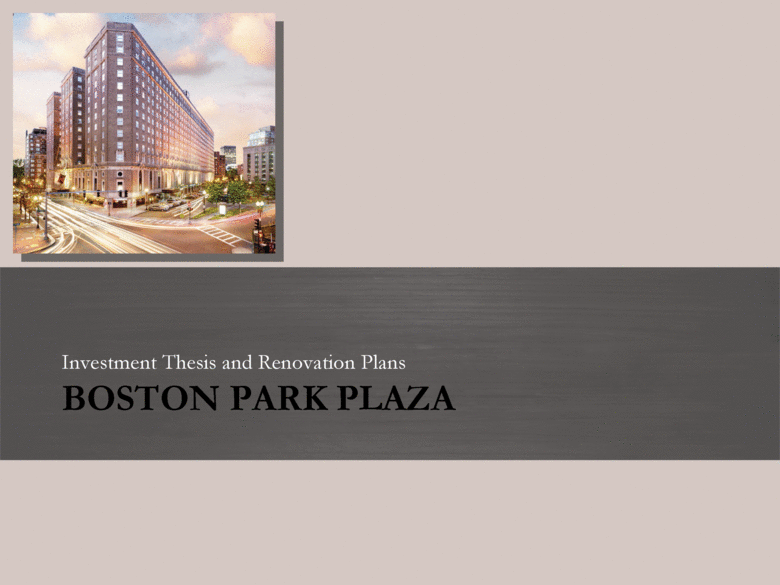
BOSTON PARK PLAZA Investment Thesis and Renovation Plans |
|
|
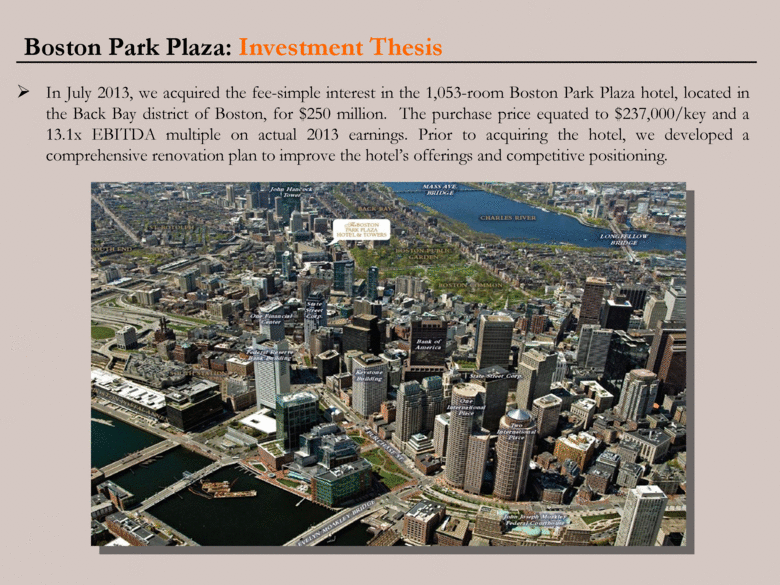
Boston Park Plaza: Investment Thesis In July 2013, we acquired the fee-simple interest in the 1,053-room Boston Park Plaza hotel, located in the Back Bay district of Boston, for $250 million. The purchase price equated to $237,000/key and a 13.1x EBITDA multiple on actual 2013 earnings. Prior to acquiring the hotel, we developed a comprehensive renovation plan to improve the hotel’s offerings and competitive positioning. |
|
|
Boston Park Plaza: Investment Thesis We acquired the Boston Park Plaza based on the following considerations: The hotel’s current positioning is not optimal. We expect targeted capital investments and strong market growth to increase the hotel’s earnings by 35% - 40% once stabilized. The hotel historically achieved a RevPAR index in the range of 75% - 85% of its competitive set. Post renovation, we expect the hotel’s RevPAR penetration to increase to approximately 90%. By phasing the renovation, and completing much of the work during the seasonally-low winter and early spring periods, we expect to minimize renovation disruption and maximize near-term earnings. This is expected to enable us to realize a favorable return on invested capital as the Boston market is forecast to increase RevPAR by 7.6%, 6.3% and 5.3% in 2014, 2015 and 2016, respectively. (1) The hotel contains approximately 40,000 sq. feet of prime, but underutilized or unoccupied retail space. A well-designed retail program is expected to enhance the hotel’s image, complement the guest experience and provide estimated incremental EBITDA of $1.5 - $2.0 million annually. We expect to have approximately 30,000 sq. feet of retail space leased in 2014. Notably, we have already executed new leases with Hermes of Paris, Inc. who will occupy a 5,500 sq. foot retail store on the first floor and with Strega Restaurant Group, a local operator of high-end restaurants, who will occupy a 5,900 sq. foot restaurant on the first floor. Including all renovation costs, our total basis in this extremely well-located, fee-simple hotel is expected to be roughly $318,000 - $328,000 per key. Maintaining the asset as an independent will provide operating flexibility and residual optionality premiums should we ever monetize the asset. (1) Source: PKF Consulting |
|
|
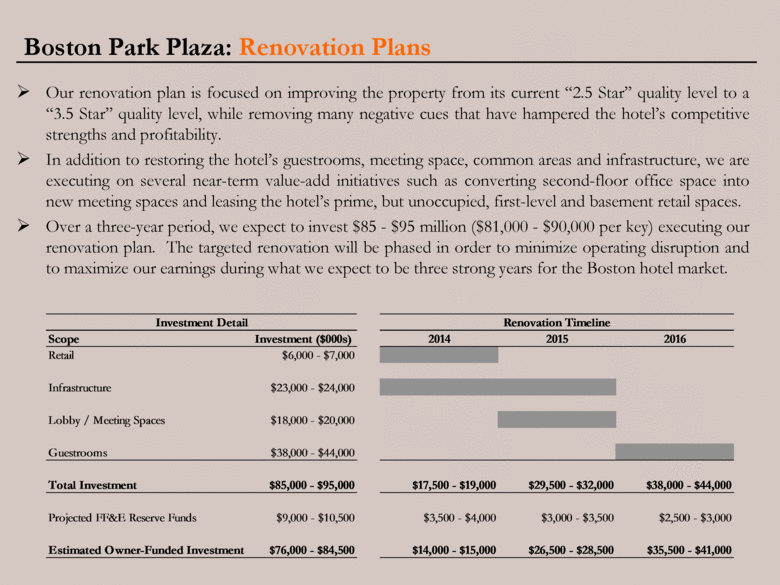
Boston Park Plaza: Renovation Plans Our renovation plan is focused on improving the property from its current “2.5 Star” quality level to a “3.5 Star” quality level, while removing many negative cues that have hampered the hotel’s competitive strengths and profitability. In addition to restoring the hotel’s guestrooms, meeting space, common areas and infrastructure, we are executing on several near-term value-add initiatives such as converting second-floor office space into new meeting spaces and leasing the hotel’s prime, but unoccupied, first-level and basement retail spaces. Over a three-year period, we expect to invest $85 - $95 million ($81,000 - $90,000 per key) executing our renovation plan. The targeted renovation will be phased in order to minimize operating disruption and to maximize our earnings during what we expect to be three strong years for the Boston hotel market. Scope Investment ($000s) 2014 2015 2016 Retail $6,000 - $7,000 Infrastructure $23,000 - $24,000 Lobby / Meeting Spaces $18,000 - $20,000 Guestrooms $38,000 - $44,000 Total Investment $85,000 - $95,000 $17,500 - $19,000 $29,500 - $32,000 $38,000 - $44,000 Projected FF&E Reserve Funds $9,000 - $10,500 $3,500 - $4,000 $3,000 - $3,500 $2,500 - $3,000 Estimated Owner-Funded Investment $76,000 - $84,500 $14,000 - $15,000 $26,500 - $28,500 $35,500 - $41,000 Renovation Timeline Investment Detail |
|
|
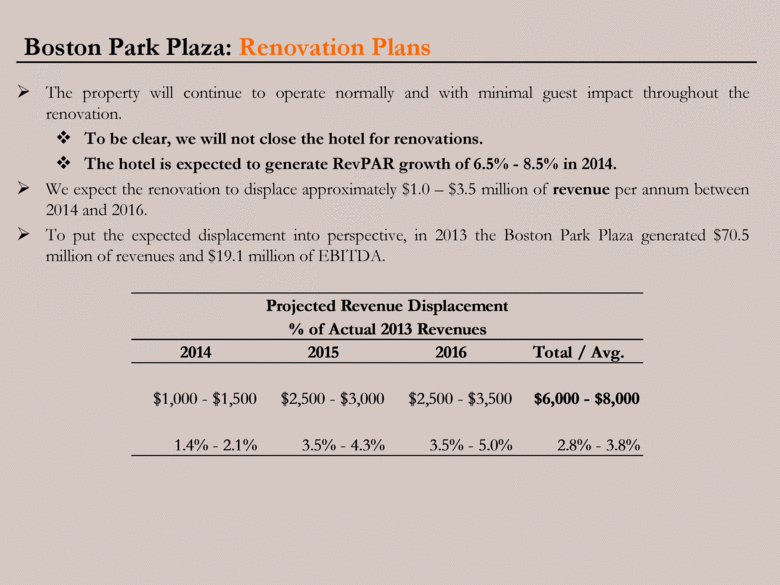
Boston Park Plaza: Renovation Plans The property will continue to operate normally and with minimal guest impact throughout the renovation. To be clear, we will not close the hotel for renovations. The hotel is expected to generate RevPAR growth of 6.5% - 8.5% in 2014. We expect the renovation to displace approximately $1.0 – $3.5 million of revenue per annum between 2014 and 2016. To put the expected displacement into perspective, in 2013 the Boston Park Plaza generated $70.5 million of revenues and $19.1 million of EBITDA. 2014 2015 2016 Total / Avg. $1,000 - $1,500 $2,500 - $3,000 $2,500 - $3,500 $6,000 - $8,000 1.4% - 2.1% 3.5% - 4.3% 3.5% - 5.0% 2.8% - 3.8% Projected Revenue Displacement % of Actual 2013 Revenues |
|
|
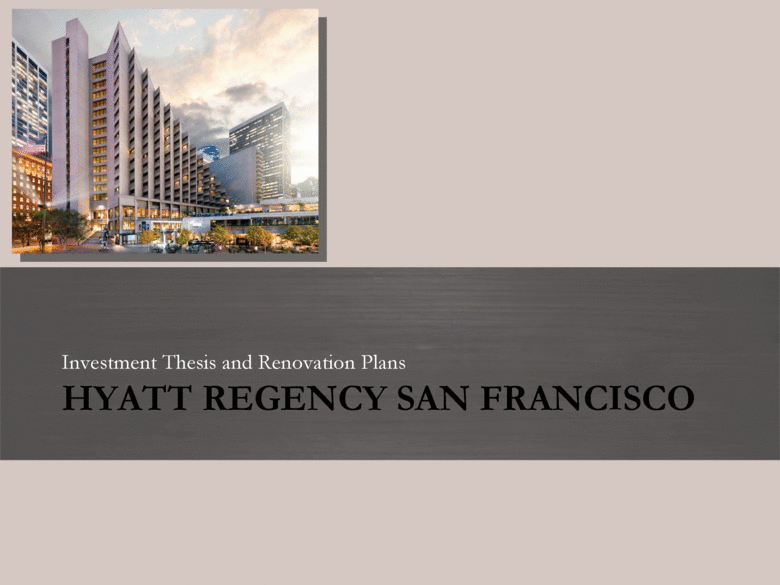
HYATT REGENCY SAN FRANCISCO Investment Thesis and Renovation Plans |
|
|
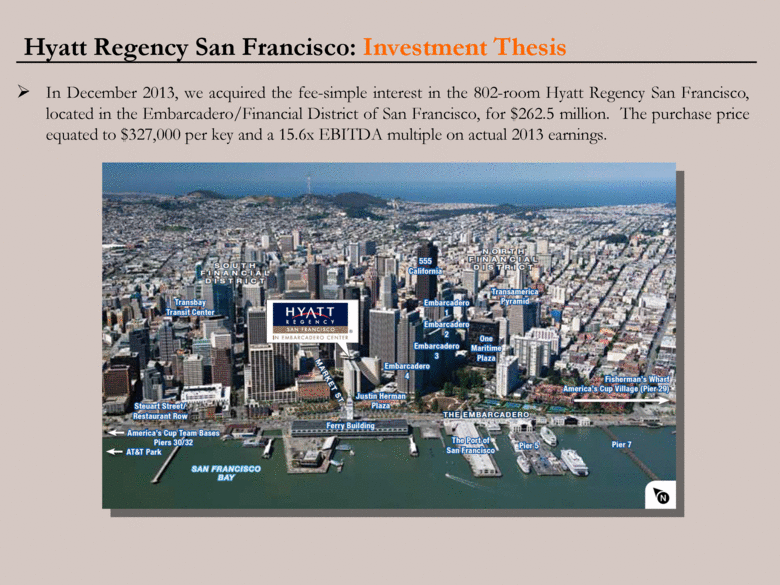
Hyatt Regency San Francisco: Investment Thesis In December 2013, we acquired the fee-simple interest in the 802-room Hyatt Regency San Francisco, located in the Embarcadero/Financial District of San Francisco, for $262.5 million. The purchase price equated to $327,000 per key and a 15.6x EBITDA multiple on actual 2013 earnings. |
|
|
Hyatt Regency San Francisco: Investment Thesis We acquired the Hyatt Regency San Francisco based on the following considerations: The hotel is in need of renovation, particularly in the guestrooms. The current state of the hotel provides us with the ability to add value in a manner similar to the approach taken at the Hyatt Chicago Magnificent Mile and the Renaissance D.C. Despite realizing robust growth in RevPAR over the last several years, the hotel has been steadily losing RevPAR index (peak index was ± 109%, current index is ± 105%). Post renovation, we expect the hotel’s RevPAR penetration to increase to 108% - 112%. By phasing the renovation, and completing much of the work during the seasonally-low winter and early spring, we expect to minimize renovation disruption and maximize our return on invested capital. This is expected to enable us to realize healthy near-term earnings as the San Francisco market is forecast to increase RevPAR by 10.3%, 9.5% and 5.7 % in 2014, 2015 and 2016, respectively. (1) The hotel’s long-term operating fundamentals and earnings are expected to benefit from an increase in white-collar employment and office development in the Embarcadero neighborhood, a new downtown transportation hub in 2017 and the San Francisco Convention Center expansion in 2016. San Francisco hotel supply is projected to grow at an average of only 0.06% per annum over the next four years as residential and office are more economically feasible than hotel development. Including all renovation costs, we expect our total basis in this well-located, fee-simple hotel to be roughly $375,000 - $380,000 per key. This compares favorably to fee-simple comparable sales in the San Francisco market, as well as various leasehold trades. (1) Source: PKF Consulting |
|
|
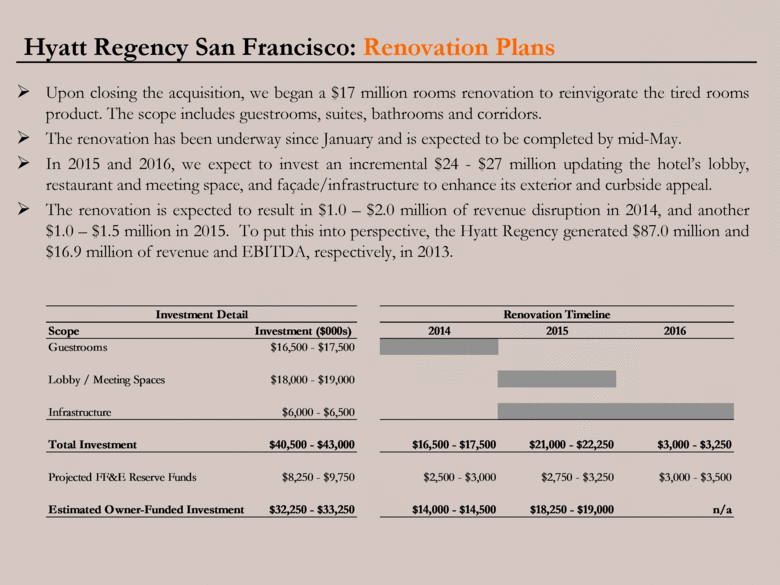
Hyatt Regency San Francisco: Renovation Plans Upon closing the acquisition, we began a $17 million rooms renovation to reinvigorate the tired rooms product. The scope includes guestrooms, suites, bathrooms and corridors. The renovation has been underway since January and is expected to be completed by mid-May. In 2015 and 2016, we expect to invest an incremental $24 - $27 million updating the hotel’s lobby, restaurant and meeting space, and façade/infrastructure to enhance its exterior and curbside appeal. The renovation is expected to result in $1.0 – $2.0 million of revenue disruption in 2014, and another $1.0 – $1.5 million in 2015. To put this into perspective, the Hyatt Regency generated $87.0 million and $16.9 million of revenue and EBITDA, respectively, in 2013. Scope Investment ($000s) 2014 2015 2016 Guestrooms $16,500 - $17,500 Lobby / Meeting Spaces $18,000 - $19,000 Infrastructure $6,000 - $6,500 Total Investment $40,500 - $43,000 $16,500 - $17,500 $21,000 - $22,250 $3,000 - $3,250 Projected FF&E Reserve Funds $8,250 - $9,750 $2,500 - $3,000 $2,750 - $3,250 $3,000 - $3,500 Estimated Owner-Funded Investment $32,250 - $33,250 $14,000 - $14,500 $18,250 - $19,000 n/a Investment Detail Renovation Timeline |
|
|
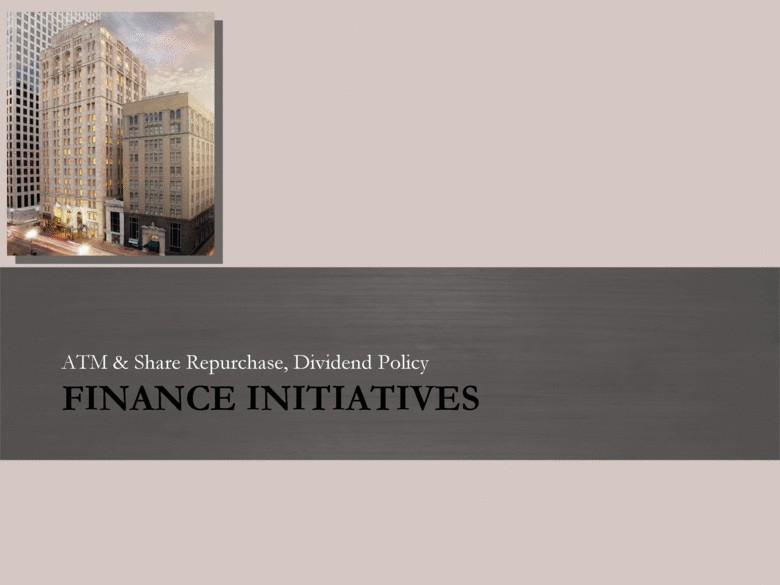
FINANCE INITIATIVES ATM & Share Repurchase, Dividend Policy |
|
|
Finance Initiatives: ATM & Share Repurchase On February 20, 2014, we simultaneously entered in to two equity distribution agreements relating to the offering of up to $150 million of our common stock and received authorization to repurchase up to $100 million of our common and preferred stock. These two finance tools will enhance our corporate flexibility under a variety of scenarios. For example, we may use these programs to fund future capital needs or to capitalize on market pricing anomalies. Prior to utilizing either of these tools, we will: Assess our stock price relative to our NAV (i.e. can we issue shares at a premium to, or repurchase shares at an attractive discount to, our estimated net asset value); Evaluate the effect on our corporate objectives (i.e. how will issuing shares or repurchasing shares affect our ability to achieve our portfolio quality and leverage goals); and Assess future capital needs including potential hotel acquisitions, capital investment and debt maturities (i.e. how will issuing shares or repurchasing shares impact our near-term corporate capital needs). |
|
|
Finance Initiatives: Dividend Policy As the economy continues to grow and the lodging recovery continues, our portfolio is well positioned to grow EBITDA significantly. Additionally, our taxable income attributed to common shareholders is expected to increase from roughly $0.10 per share in 2013, to an estimated $0.50 - $0.60 per share in 2014. The significant increase in taxable income is largely attributed to: Exhausting the majority of our NOLs; Reductions in preferred stock dividends as a result of eliminating the series A and series C preferred securities in early 2013; Income from the non-ownership stub period of our 2013 acquisitions; and The anticipated increase in property-level EBITDA. On February 20, 2014, we declared a $0.05 per share cash dividend on our common stock. We intend to maintain this base quarterly cash dividend to distribute a portion of our 2014 taxable income. We intend to distribute the remainder of our 2014 taxable income via a year-end dividend which may be comprised of cash or a combination of cash and stock. |
|
|
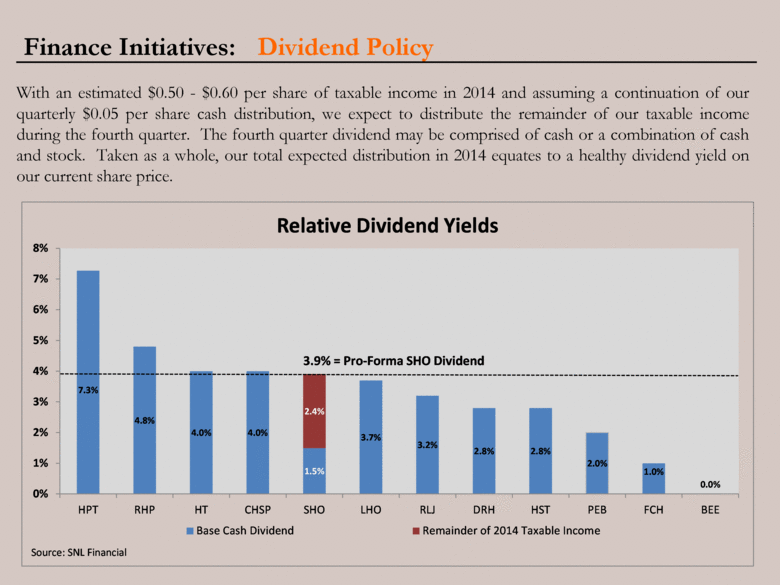
Finance Initiatives: Dividend Policy With an estimated $0.50 - $0.60 per share of taxable income in 2014 and assuming a continuation of our quarterly $0.05 per share cash distribution, we expect to distribute the remainder of our taxable income during the fourth quarter. The fourth quarter dividend may be comprised of cash or a combination of cash and stock. Taken as a whole, our total expected distribution in 2014 equates to a healthy dividend yield on our current share price. 7.3% 4.8% 4.0% 4.0% 1.5% 3.7% 3.2% 2.8% 2.8% 2.0% 1.0% 0.0% 2.4% 0% 1% 2% 3% 4% 5% 6% 7% 8% HPT RHP HT CHSP SHO LHO RLJ DRH HST PEB FCH BEE Relative Dividend Yields Base Cash Dividend Remainder of 2014 Taxable Income 3.9% = Pro - Forma SHO Dividend Source: SNL Financial |
|
|
Sunstone Hotel Investors, Inc. 120 Vantis, Suite 350 Aliso Viejo, California 92656 www.sunstonehotels.com |

