Attached files
| file | filename |
|---|---|
| 8-K - FORM 8-K - SEALED AIR CORP/DE | d679018d8k.htm |
 Jerome A. Peribere
President & CEO
Carol P. Lowe
Senior Vice President & CFO
Barclays Industrial Select Conference, February 20, 2014
Company Overview
Exhibit 99.1 |
| 2
These
materials
contain
“forward-looking
statements”
within
the
meaning
of
the
Private
Securities
Litigation
Reform
Act
of
1995.
Forward-looking
statements
can
be
identified
by
such
words
as
“anticipates,”
“believes,”
“plan,”
“assumes,”
“could,”
“estimates,”
“expects,”
“intends,”
“may,”
“plans
to,”
“will”
and
similar
expressions.
These
statements
reflect
our
beliefs
and
expectations
as
to
future
events
and
trends
affecting
our
business,
our
consolidated
financial
position
and
our
results
of
operations.
Examples
of
these
forward-looking
statements
include
expectations
regarding
our
anticipated
effective
income
tax
rate,
the
potential
cash
tax
benefits
associated
with
the
W.
R.
Grace
&
Co.
settlement,
potential
volume,
revenue
and
operating
growth
for
future
periods,
expectations
and
assumptions
associated
with
our
restructuring
programs,
availability
and
pricing
of
raw
materials,
success
of
our
growth
initiatives,
economic
conditions,
and
the
success
of
pricing
actions.
A
variety
of
factors
may
cause
actual
results
to
differ
materially
from
these
expectations,
including
general
domestic
and
international
economic
and
political
conditions,
changes
in
our
raw
material
and
energy
costs,
credit
ratings,
the
success
of
restructuring
plans,
currency
translation
and
devaluation
effects,
the
competitive
environment,
the
effects
of
animal
and
food-related
health
issues,
environmental
matters,
and
regulatory
actions
and
legal
matters.
For
more
extensive
information,
see
“Risk
Factors”
and
“Cautionary
Notice
Regarding
Forward-
Looking
Statements,”
which
appear
in
our
most
recent
Annual
Report
on
Form
10-K,
as
filed
with
the
Securities
and
Exchange
Commission,
and
as
revised
and
updated
by
our
Quarterly
Reports
on
Form
10-Q
and
Current
Reports
on
Form
8-K.
While
we
may
elect
to
update
these
forward-looking
statements
at
some
point
in
the
future,
we
specifically
disclaim
any
obligation
to
do
so,
whether
as
a
result
of
new
information,
future
events,
or
otherwise.
Our
management
uses
non-U.S.
GAAP
financial
measures
to
evaluate
the
Company’s
performance,
which
exclude
items
we
consider
unusual
or
special
items.
We
believe
the
use
of
such
financial
measures
and
information
may
be
useful
to
investors.
We
believe
that
the
use
of
non-U.S.
GAAP
measures
helps
investors
to
gain
a
better
understanding
of
core
operating
results
and
future
prospects,
consistent
with
how
management
measures
and
forecasts
the
Company's
performance,
especially
when
comparing
such
results
to
previous
periods
or
forecasts.
Please
see
Sealed
Air’s
February
6,
2014
earnings
press
release,
supplement
and
presentation
available
on
our
website
for
important
information
about
the
use
of
non-U.S.
GAAP
financial
measures
relevant
to
this
presentation,
including
applicable
reconciliations
to
U.S.
GAAP
financial
measures.
Website Information
We
routinely
post
important
information
for
investors
on
our
website,
www.sealedair.com,
in
the
"Investor
Relations"
section.
We
use
this
website
as
a
means
of
disclosing
material,
non-public
information
and
for
complying
with
our
disclosure
obligations
under
Regulation
FD.
Accordingly,
investors
should
monitor
the
Investor
Relations
section
of
our
website,
in
addition
to
following
our
press
releases,
SEC
filings,
public
conference
calls,
presentations
and
webcasts.
The
information
contained
on,
or
that
may
be
accessed
through,
our
website
is
not
incorporated
by
reference
into,
and
is
not
a
part
of,
this
document.
Safe Harbor and Regulation G Statement |
 VISION:
To create a better way for life
We Re-imagine
™
the industries we serve to
create a world that feels, tastes and
works better.
MISSION:
2013
FINANCIALS:
Total Sales: $7.7B; Free Cash Flow: $509M
Adjusted EBITDA, excl SARs: $1.038B
3 |
 •
Engineered Solutions & Packaging Systems
•
Packaging Design & Testing
•
Lean Six Sigma Expertise
•
Service & Support
•
Packaging/Hygiene Solutions
•
Engineering Plant Designs
•
Full Range of Equipment/Systems
•
Manage Water, Energy
•
Building & Kitchen Care Services
•
Infection Prevention
•
Fabric Care
•
Consulting Services & Consumer Brands
How We Deliver Value
2013 Sales: $1.6B
24% of 2013
Adj. EBITDA
2013 Sales: $2.2B
21% of 2013
Adj. EBITDA, excl SARs
2013 Sales: $3.8B
55% of 2013
Adj. EBITDA, excl SARs
4 |
 DISTRIBUTION ACCOUNTS
FOR APPROX. 65% OF SALES
Who We Serve
DIVERSEY CARE
PRODUCT CARE
FOOD CARE
TOP 20 CUSTOMERS
ACCOUNT FOR NEARLY 20%
OF SALES; DISTRIBUTION
ACCOUNTS FOR APPROX.
35% OF SALES
TOP 20 CUSTOMERS
ACCOUNT FOR APPROX.
25% OF SALES
5 |
 DIVERSEY CARE
PRODUCT CARE
FOOD CARE
31%
Fresh Red Meat
Dairy Solids
Other Food
Smoked & Processed
Poultry
Beverages
11%
17%
16%
12%
13%
43%
Consumer Applications
Industrial/Manufacturing
E-Commerce
3PL/Fulfillment
General Protection
18%
13%
14%
12%
10%
12%
11%
11%
35%
11%
Building Service Contractors
Health Care
Other
Food Service
Retail
Hospitality
Distribution
10%
GLOBAL ADDRESSABLE
MARKET: APPROX. $5B
ESTIMATED GLOBAL
MARKET SHARE: 32%
GLOBAL ADDRESSABLE
MARKET: APPROX. $28B
ESTIMATED GLOBAL
MARKET SHARE: 8%
GLOBAL ADDRESSABLE
MARKET: APPROX. $20B
ESTIMATED GLOBAL
MARKET SHARE: 19%
Source: Sealed Air Estimates
2013 Net Sales by End Market
6 |
 DIVERSEY CARE
PRODUCT CARE
FOOD CARE
SEALED AIR
North America
Europe
Latin America
AMAT
Japan/ANZ
2013 Net Sales by Region
8%
7 |
 8
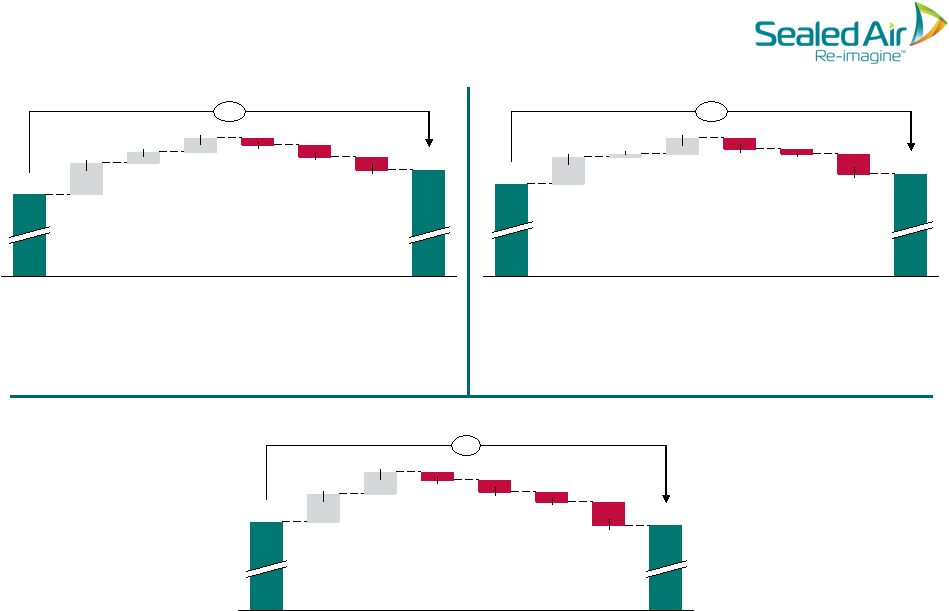
Total Company Net Sales Bridge
1.7% Reported
2.7% Constant Currency
2013 Net Sales
7,691
-76
Foreign Exchange
Price/Mix
+94
Volume
+114
2012 Net Sales
7,559
($ in millions)
•
Constant currency 2013 sales growth in every region, except for a
slight decline Europe
•
Sales in Developing Regions increased 9% in constant currency and
accounted for 26% of 2013 net sales |
 DIVERSEY CARE
Net Sales by Division
PRODUCT CARE
FOOD CARE
Packaging
Hygiene
3,049
3,106
691
705
3,740
3,811
2012
2013
9
* Constant Currency Net Sales Growth: 3.3%
* Constant Currency Net Sales Growth: 2.0%
* Constant Currency Net Sales Growth: 2.4%
($ in millions)
1.9%*
1.4%*
1.9%* |
 10
1,038
41
40
112
981
5.8%
2013
Adj.
EBITDA
Other/FX
(2)
-61
Perf-
based
Incentive
Comp
(1)
-41
SG&A/
Other
-34
Mix &
Price/
Cost Spread
Volume
Cost
Synergies
2012
Adj.
EBITDA
Adjusted EBITDA, excluding SARs
(1)
Performance-based incentive compensation includes an increase of $25M for
the annual incentive plan & $16M of non-cash
profit sharing expenses in U.S.
(2) Others include ($46M) supply chain costs primarily related to non-material
inflation; FX: ($5.9M) Adjusted EBITDA Margin, excl SARs:
2013: 13.5%
2012: 13.0%
($ in millions) |
 DIVERSEY CARE
Adj. EBITDA, excl SARs, by Division
PRODUCT CARE
FOOD CARE
25
20
58
Cost
Synergies
2012
535
-13
+8%
SG&A
-21
Perf-
based
Incentive
Comp
-24
Other/
FX*
579
Mix &
Price/Cost
Spread
Volume
2013
Adj. EBITDA Margin, excl SARs:
2013: 15.2%
2012: 14.3%
20
5
34
2013
223
Other/
FX*
-25
Perf-
based
Incentive
Comp
-7
SG&A
-14
Mix &
Price/Cost
Spread
Volume
Cost
Synergies
2012
210
+6%
* Other includes ($12M) supply chain costs primarily related to non-material
inflation & inventory obsolescence; Also includes bad debt allowance of
($4M) recorded in Q3 for large customer in AMAT; FX: ($1.2M)
* Other includes ($13M) supply chain costs primarily related to non-material
inflation; FX: ($3.9M)
16
19
Volume
Cost
Synergies
2012
250
Other/
FX*
247
2013
-1%
Mix &
Price/Cost
Spread
-9
SG&A
-7
Perf-
based
Incentive
Comp
-17
-6
* Other includes ($12M) supply chain costs primarily related to LIFO adjustment
& non-material inflation; FX: ($1.0M)
Adj. EBITDA Margin, excl SARs:
2013: 10.3%
2012: 9.8%
Adj. EBITDA Margin:
2013: 15.4%
2012: 15.8%
11
($ in millions) |
  SIGNIFICANT YoY IMPROVEMENT
12
Year Ended December 31
Free Cash Flow
(1)
Profit sharing expense is funded with Sealed Air stock
(2)
Accounts Receivable, Inventories & Accounts Payable
($ in millions)
($ in millions)
Free Cash Flow
2012
2013
Adjusted Net Earnings
$193
$263
Depreciation and Amortization
317
308
Profit sharing expense
(1)
19
35
Settlement agreement & Other Non-Cash Interest
61
67
Restructuring Payments
(103)
(107)
Tax Payments
(109)
(111)
SARs Payments
(24)
(46)
Net change in working capital items
(2)
(77)
96
Other
117
120
Cash Flow from Operations
$394
$625
Capital Expenditures
(123)
(116)
Free Cash Flow
$271
$509
Year Ended
December 31 |
 Liquidity & Net Debt
13
Liquidity Position
Net Debt
Lower net debt as a result of cash
generated from operating activities &
asset sales, partially offset by capital
expenditures & dividend payments
($ in millions) |
 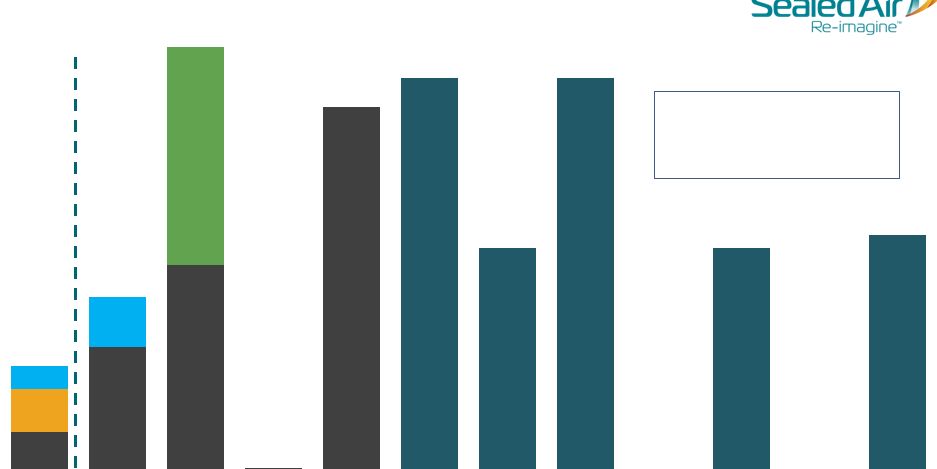 71
234
391
2
694
420
750
425
750
425
450
82
45
96
2014
2015
2016
2017
2018
2019
2020
2021
2023
2033
Credit Facility Term Loans
Credit Facility Revolver
Senior Notes
Short Term Borrowings
AR Securitization
8.125%
6.5%
8.375%
5.25%
6.875%
Pro Forma Debt Maturity Schedule
(1)
14
($ in millions)
Weighted Average
Interest Rate:
Approx. 5.6%
2014
•
Funded W. R. Grace & Co. Settlement on February 3, 2014 with $555 million of
accumulated cash and cash equivalents and $375 million from committed
credit facilities
•
Repaid 12% $150M Senior Notes on February 14, 2014
(1) As of December 31, 2013, pro forma for payment of Grace and
12% Senior Notes in Q1 2014. |
 De-Leveraging Balance Sheet
15
•
De-leveraging balance sheet to optimize capital structure that can be
sustained throughout-out end market cycles and economic downturns
•
Return excess cash to shareholders
0.0x
1.0x
2.0x
3.0x
4.0x
5.0x
6.0x
$0.0
$1.0
$2.0
$3.0
$4.0
$5.0
$6.0
2010
2011
(Diversey
Acquisition)
2012
2013
2014E
2015E
2016E
Net Debt
Net Debt/Adjusted EBITDA |
 Adjusted EBITDA: $1.05B –
$1.07B
(D&A: $315M; Interest Expense: $295M)
Net Sales: Approx. $7.7B
(Organic growth offset by product rationalization and more than 2% unfavorable
FX) 2014 Outlook
Adjusted EPS: $1.50 –
$1.60
(Anticipated core tax rate of approx. 25%)
Free Cash Flow: Approx. $410M
(Assumes: Approx. $170M capex, $150M cash restructuring and $280M cash interest
expense) Note:
Adjusted EPS includes $0.12 benefit related to the W.R. & Co. Settlement
agreement. Adjusted EBITDA is net of $40M of non-cash profit
sharing Adjusted EBITDA and EPS exclude the potential impact of SARs &
the impact of special items. 16 |
 Implementing sales &
marketing and pricing
effectiveness;
Rationalizing portfolio
Investing for higher
margin growth
•
Optimize portfolio & re-segment markets
•
Optimize supply chain network
•
Drive incremental profit capture through pricing
•
Build out hygiene portfolio and drive synergy sales
Getting the basics right &
creating path for quality
growth
How We Are Getting Fit
•
Innovate with focus on differentiation & ROI
•
Higher participation in emerging markets
•
Build critical mass in the US market
•
Right pricing mechanisms for higher profit capture
•
Implement new sales tools & pricing disciplines
•
Change in ownership of pricing decisions
•
Rationalize low return General Use globally
•
Grow solutions with higher returns
17 |
 Evolve
offer
comprised
of
high
value,
differentiated
solutions
Drive higher margin
revenue through
innovation & value-add
•
Develop new technology to improve processor yields
•
Reduce food safety risk throughout food chain
•
Reduce waste through end-to-end innovation
•
Provide integrated systems to drive efficiency
Transform towards
knowledge-based
business model
How We Will Change The Game
•
Provide lowest Total Cost of Ownership (TCO) by
integrating data, equipment & applications
•
Establish smart service programs for strategic
sectors
•
Provide focused solutions for e-commerce,
fulfillment & other target market segments
•
Develop new products and solutions to capitalize on
changing market opportunities
18 |
 |
 Appendix |
 Net
Sales Performance Product Price/Mix & Volume
21
By Division
2013
Food Care
1.6%
Diversey Care
1.5%
Product Care
(0.2%)
Medical/New Ventures
2.3%
Total
1.2%
By Region
2013
North America
1.5%
Europe
(0.2%)
Latin America
5.1%
AMAT
2.0%
JANZ
(0.6%)
Total
1.2%
Product Price/Mix (% Change)
By Division
2013
Food Care
1.7%
Diversey Care
0.5%
Product Care
2.6%
Medical/New Ventures
(1.2%)
Total
1.5%
By Region
2013
North America
0.6%
Europe
(0.1%)
Latin America
4.6%
AMAT
6.8%
JANZ
1.1%
Total
1.5%
Volume (% Change)
By Division
2013
Food Care
3.3%
Diversey Care
2.0%
Product Care
2.4%
Medical/New Ventures
0.6%
Total
2.7%
By Region
2013
North America
2.1%
Europe
(0.3%)
Latin America
9.7%
AMAT
8.8%
JANZ
0.5%
Total
2.7%
Constant Dollar Sales (% Change) |
 2013 Adj. EPS Calculation
22
Reported U.S. GAAP Measures :
•
Q4 2013 Operating Income: $172.6M; Net Income: $3.6M; 2013 Operating Income:
$602.1M; Net Income: $93.7M •
Q4 2013: Recognized $0.11 in discontinued operations, including $0.10 per share
gain on Medical Rigids sale •
2013: Recognized $0.14 in discontinued operations, including $0.10 per share gain
on Medical Rigids sale ($ in millions, except Adjusted EPS)
(1)
Comprised of $160.2M of property and equipment
depreciation, $123.2M of amortization of intangibles and
$24.1M of share-based compensation, net of ($5.3M)
special items
(2)
Additional detail on cash-settled stock appreciation rights
(“SARs”) granted as part of the Diversey acquisition is
provided in Sealed Air’s February 6, 2014 earnings press
release and supplementary information
2013 Adjusted EBITDA, excl SARs
$1,038.0
Depreciation and amortization
(1)
302.2
Interest expense
361.0
Stock Appreciation Rights (SARs)
(2)
38.1
Adjusted pre-tax earnings
$336.7
Core taxes (21.8%)
73.5
Adjusted net earnings
$263.2
Diluted Shares
213.5
2013 Adjusted EPS
$1.23
2013 Adjusted EPS, excl SARs
$1.39 |
 23
GAAP Operating Profit (Loss)
(1)
(1)
The supplementary information included in this presentation can be found in
Sealed Air’s February 6, 2014 earnings press release, which is preliminary and subject
to change prior to the filing of our upcoming Annual Report on Form 10-K with
the Securities and Exchange Commission. (2)
In December 2013, we completed the sale of our rigid medical packaging business
(“Medical Rigids”). The financial results of the Medical Rigids business
are
reported as discontinued operations, net of tax, and, accordingly all previously
reported financial information has been revised. 2013
2012
2013
2012
Revised
(2)
Revised
(2)
Operating profit (loss):
Food Care
$
119.6
$
(95.0)
$
431.4
$
(170.9)
As a % of Food Care net sales
11.8
%
(9.6)
%
11.3
%
(4.6)
%
Diversey Care
11.2
(322.4)
57.9
(1,278.4)
As a % of Diversey Care net sales
2.1
%
(60.4)
%
2.7
%
(60.0)
%
Product Care
56.7
56.9
200.4
207.5
As a % of Product Care net sales
13.4
%
14.0
%
12.5
%
13.1
%
Other Category: Medical Applications business and New Ventures
(1.9)
(24.5)
(12.7)
(36.0)
As a % of Medical Applications and New Ventures net
sales (6.2)
%
(86.0)
%
(11.4)
%
(32.8)
%
Total segments and other category
185.6
(385.0)
677.0
(1,277.8)
As a % of total net sales
9.2
%
(19.7)
%
8.8
%
(16.9)
%
Costs related to the acquisition and integration of Diversey
0.4
2.6
1.1
7.4
Restructuring and other charges
12.6
32.4
73.8
142.5
Total
$
172.6
$
(420.0)
$
602.1
$
(1,427.7)
As a % of total net sales
8.6
%
(21.5)
%
7.8
%
(18.9)
%
December 31,
December 31,
(Unaudited, $ in millions)
Year Ended
Three Months Ended |