Attached files
| file | filename |
|---|---|
| 8-K - 8-K - LOJACK CORP | a8-k22014.htm |
| EX-99.1 - Q4 2013 EARNINGS RELEASE - LOJACK CORP | exhibit991q42013earningsre.htm |

February 20, 2014
Forward-looking Statements Statements in this presentation that are not statements of historical fact are forward-looking statements. Such forward-looking statements, which include statements regarding the Company’s strategic plans and initiatives, markets and future financial performance, are based on a number of assumptions and involve a number of risks and uncertainties, and accordingly, actual results could differ materially. Factors that may cause such differences include, but are not limited to: (1) the continued and future acceptance of the Company’s products and services, including the Company’s pre-install program and fleet management and other telematics products; (2) the Company’s ability to obtain financing from lenders; (3) the outcome of ongoing litigation involving the Company; (4) the rate of growth in the industries of the Company’s customers; (5) the presence of competitors with greater technical, marketing, and financial resources; (6) the Company’s customers’ ability to access the credit markets, including changes in interest rates; (7) the Company’s ability to promptly and effectively respond to technological change to meet evolving customer needs; (8) the Company’s ability to successfully expand its operations, including through the introduction of new products and services; (9) changes in general economic or geopolitical conditions, including the European debt crisis; (10) conditions in the automotive retail market and the Company’s relationships with dealers, licensees, partners, agents and local law enforcement; (11) the expected timing of purchases by the Company’s customers; (12) the Company’s ability to achieve the expected benefits of its strategic alliance with TomTom; (13) the Company’s ability to maintain the strength of its brand; and (14) trade tensions and governmental regulations and restrictions in Argentina and the Company’s other international markets. For a further discussion of these and other significant factors to consider in connection with forward-looking statements concerning the Company, reference is made to the Company's Annual Report on Form 10-K for the year ended December 31, 2012 and the Company's other filings with the Securities and Exchange Commission. Such forward-looking statements speak only as of the date made. Except as required by law, the Company undertakes no obligation to update these forward-looking statements. 2 2

In addition to financial measures prepared in accordance with generally accepted accounting principles (GAAP), this presentation also contains the non-GAAP financial measure, adjusted EBITDA. The Company believes that the inclusion of this non-GAAP financial measure in this presentation helps investors to gain a meaningful understanding of changes in the Company's core operating results, and can also help investors who wish to make comparisons between LoJack and other companies on both a GAAP and a non-GAAP basis. LoJack management uses this non-GAAP measure, in addition to GAAP financial measures, as the basis for measuring our core operating performance and comparing such performance to that of prior periods and to the performance of our competitors. These measures are also used by management to assist with their financial and operating decision making. The non-GAAP financial measures included in this presentation are not meant to be considered superior to or a substitute for results of operations prepared in accordance with GAAP. In addition, the non-GAAP financial measures included in this presentation may be different from, and therefore may not be comparable to, similar measures used by other companies. Reconciliations of the non- GAAP financial measures used in this presentation to the most directly comparable GAAP financial measures are set forth in the accompanying table to this presentation. Use of Non-GAAP Financial Measures 3
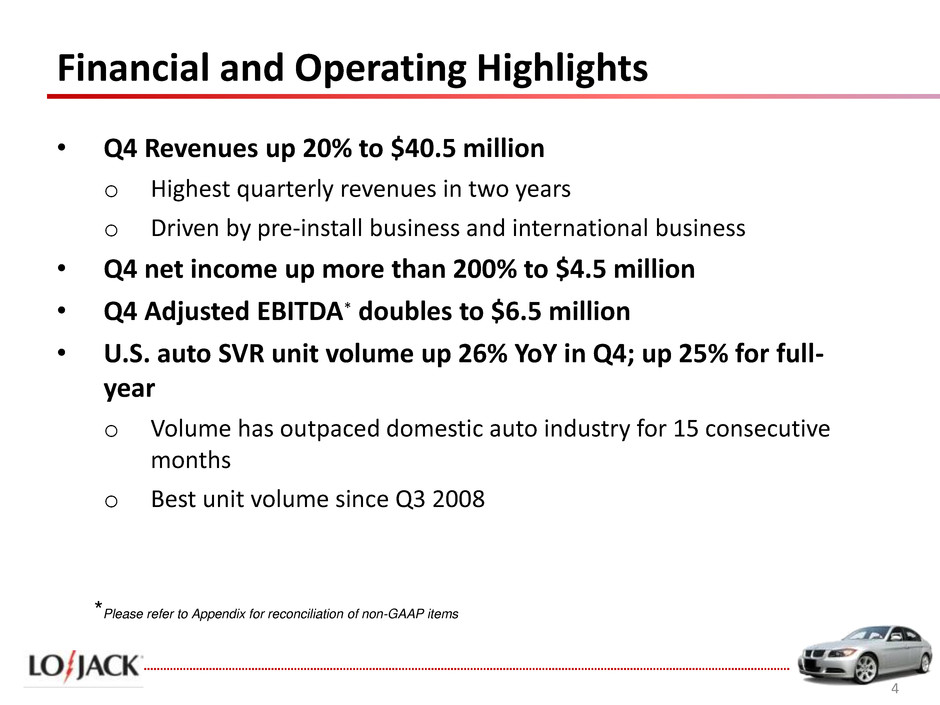
Financial and Operating Highlights 4 • Q4 Revenues up 20% to $40.5 million o Highest quarterly revenues in two years o Driven by pre-install business and international business • Q4 net income up more than 200% to $4.5 million • Q4 Adjusted EBITDA* doubles to $6.5 million • U.S. auto SVR unit volume up 26% YoY in Q4; up 25% for full- year o Volume has outpaced domestic auto industry for 15 consecutive months o Best unit volume since Q3 2008 *Please refer to Appendix for reconciliation of non-GAAP items
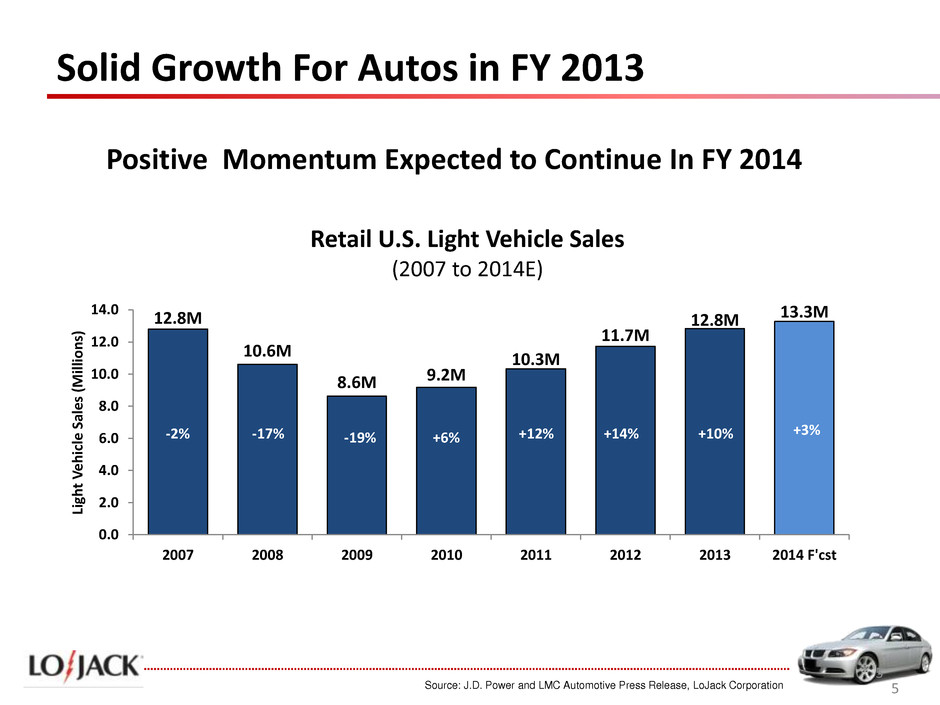
Solid Growth For Autos in FY 2013 5 5 Positive Momentum Expected to Continue In FY 2014 Source: J.D. Power and LMC Automotive Press Release, LoJack Corporation 12.8M 10.6M 8.6M 9.2M 10.3M 11.7M 12.8M 13.3M 0.0 2.0 4.0 6.0 8.0 10.0 12.0 14.0 2007 2008 2009 2010 2011 2012 2013 2014 F'cst Li gh t V eh ic le S al es ( M ill io n s) Retail U.S. Light Vehicle Sales (2007 to 2014E) -2% -17% -19% +6% +12% +14% +10% +3%
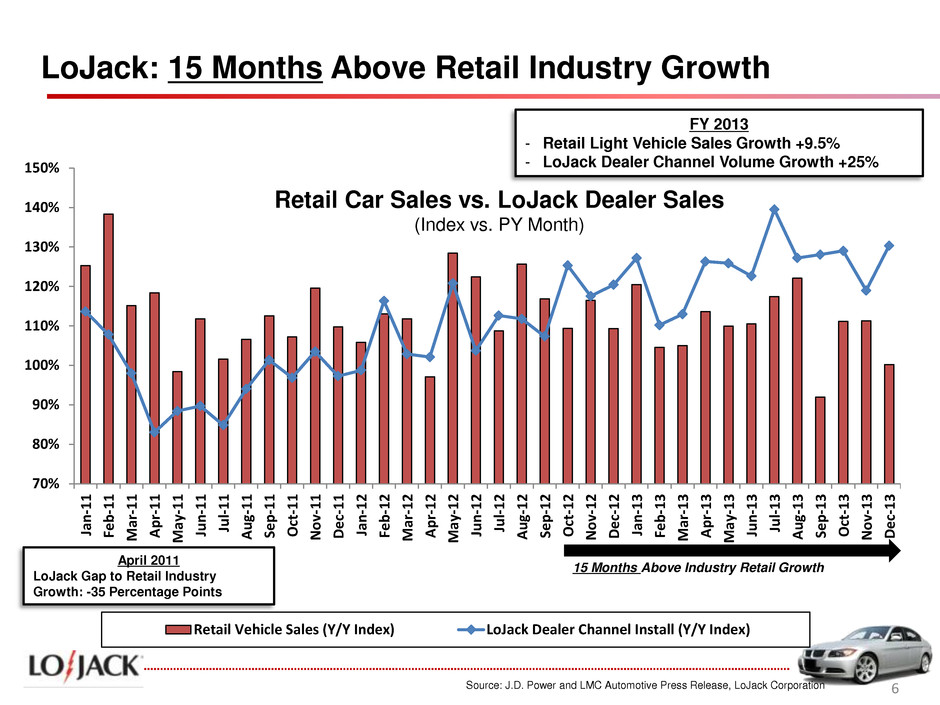
70% 80% 90% 100% 110% 120% 130% 140% 150% Ja n -1 1 Feb -1 1 M ar -1 1 A p r- 1 1 M ay -1 1 Ju n -1 1 Ju l- 1 1 A u g- 1 1 Se p -1 1 O ct -1 1 N o v- 1 1 D ec -1 1 Ja n -1 2 Feb -1 2 M ar -1 2 A p r- 1 2 M ay -1 2 Ju n -1 2 Ju l- 1 2 A u g- 1 2 Se p -1 2 O ct -1 2 N o v- 1 2 D ec -1 2 Ja n -1 3 Feb -1 3 M ar -1 3 A p r- 1 3 M ay -1 3 Ju n -1 3 Ju l- 1 3 A u g- 1 3 Se p -1 3 O ct -1 3 N o v- 1 3 D ec -1 3 Retail Vehicle Sales (Y/Y Index) LoJack Dealer Channel Install (Y/Y Index) FY 2013 - Retail Light Vehicle Sales Growth +9.5% - LoJack Dealer Channel Volume Growth +25% LoJack: 15 Months Above Retail Industry Growth Source: J.D. Power and LMC Automotive Press Release, LoJack Corporation 15 Months Above Industry Retail Growth Retail Car Sales vs. LoJack Dealer Sales (Index vs. PY Month) April 2011 LoJack Gap to Retail Industry Growth: -35 Percentage Points 6

31% 32% 34% 43% 35% 44% 45% 46% 51% 47% 0% 10% 20% 30% 40% 50% 60% Q1 Q2 Q3 Q4 FY FY 2012 FY 2013 Advancing the Pre-Install Strategy 7 7 Pre-Install Program Sales Mix % Share of Dealer Channel Volume
Dealer Success Story: Carland 8 8 Carland: • Georgia based dealer with 2 Honda and 1 Acura stores; 36 years in business • Initial Pre-Install lot load of 1,015 SVR units (June 2013) • Ongoing orders of approximately 400 SVR units monthly • Installed on all new-cars and select pre-owned vehicles • PIP program provides customers high-value product (safety, security and protection) that contributes meaningfully to F&I profit per vehicle retailed (PVR).
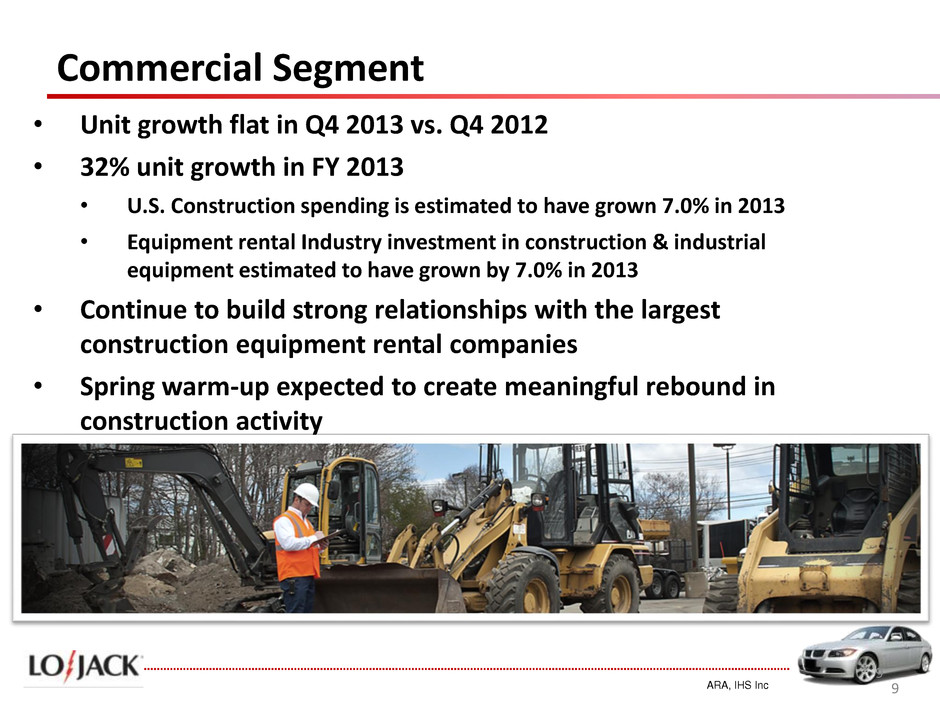
Commercial Segment 9 9 • Unit growth flat in Q4 2013 vs. Q4 2012 • 32% unit growth in FY 2013 • U.S. Construction spending is estimated to have grown 7.0% in 2013 • Equipment rental Industry investment in construction & industrial equipment estimated to have grown by 7.0% in 2013 • Continue to build strong relationships with the largest construction equipment rental companies • Spring warm-up expected to create meaningful rebound in construction activity ARA, IHS Inc

New Mexico Launch 10 10 • Request for LoJack came from New Mexico State Police and New Mexico Automobile Dealers Association • LoJack now has coverage in all four states bordering Mexico • Installed police tracking computers in the vehicles of the state’s largest public safety departments (ex. NM State Police; Albuquerque) • Live and operational: 1st recovery after only a few days in service • First Pre-Install Account signed up and installing LoJack SVR systems The New Mexico Market: • Approximately 160 New Vehicle Dealers • More than 80,000 new light vehicles registered in 2013 • Approximately 1.8 million cars and light trucks on the road
LoJack Expands into Telematics (Connected Car) 11 • Significant progress in 2013 on expansion into fleet telematics o Experienced LoJack Fleet Management sales organization and support infrastructure in place o Actively adding new subscribers o Positive feedback on product from customers • Expect 2014 to be a year of investment as we transition to enable new subscription-driven (SaaS) business models o Implementing new ERP System to support strategic growth o Making significant customer acquisition investments in sales, marketing and operations o Leveraging brand elasticity, dealer network, distribution capabilities and strong ties with law enforcement
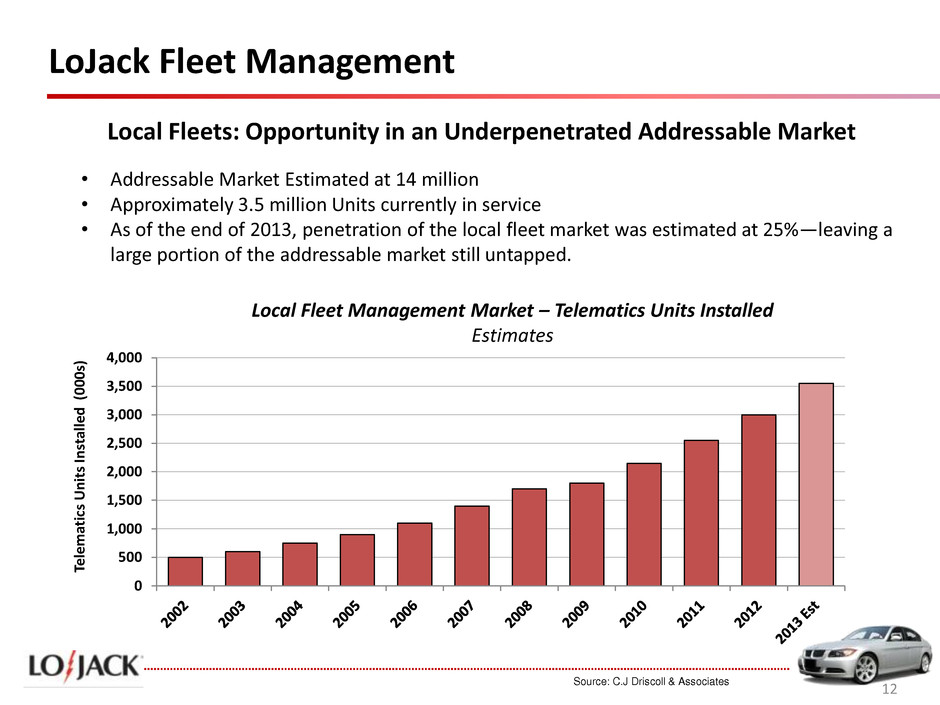
0 500 1,000 1,500 2,000 2,500 3,000 3,500 4,000 Te le m at ics Un it s In st al le d (0 0 0 s) LoJack Fleet Management Source: C.J Driscoll & Associates Local Fleets: Opportunity in an Underpenetrated Addressable Market Local Fleet Management Market – Telematics Units Installed Estimates • Addressable Market Estimated at 14 million • Approximately 3.5 million Units currently in service • As of the end of 2013, penetration of the local fleet market was estimated at 25%—leaving a large portion of the addressable market still untapped. 12
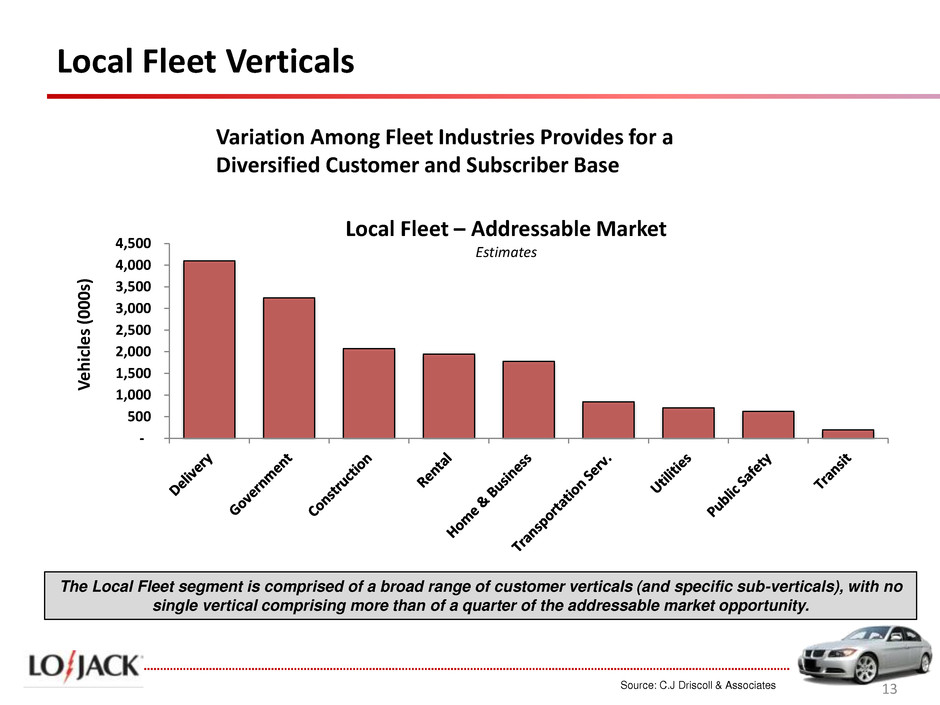
Local Fleet Verticals Source: C.J Driscoll & Associates - 500 1,000 1,500 2,000 2,500 3,000 3,500 4,000 4,500 V eh icl e s (0 0 0s ) Local Fleet – Addressable Market Estimates The Local Fleet segment is comprised of a broad range of customer verticals (and specific sub-verticals), with no single vertical comprising more than of a quarter of the addressable market opportunity. Variation Among Fleet Industries Provides for a Diversified Customer and Subscriber Base 13


Q4 Revenues 15 15 ($ in millions) Q4 2013 Q4 2012 % change Consolidated revenues $ 40.5 $ 33.8 20% U.S. revenues $ 22.9 $ 20.8 10% International licensees $ 13.6 $ 8.7 56% Canada $ 1 .7 $ 2 .1 (19%) Italy $ 1.0 $ 0.9 14% All other $ 1.2 $ 1.3 (5%) • U.S. dealer product revenues up 21% on 26% increase in unit volume • Pre-installs represented 51% of U.S. unit sales vs. 43% in Q4 2012 • Larger percentage of pre-installs enables fixed costs to be spread over increased unit volumes
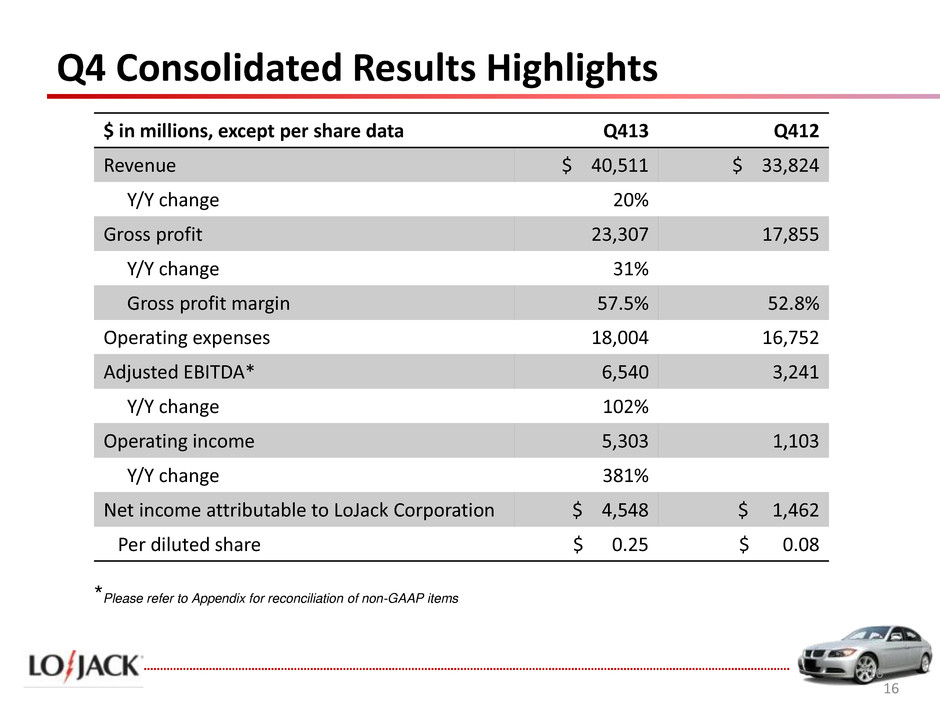
Q4 Consolidated Results Highlights 16 16 $ in millions, except per share data Q413 Q412 Revenue $ 40,511 $ 33,824 Y/Y change 20% Gross profit 23,307 17,855 Y/Y change 31% Gross profit margin 57.5% 52.8% Operating expenses 18,004 16,752 Adjusted EBITDA* 6,540 3,241 Y/Y change 102% Operating income 5,303 1,103 Y/Y change 381% Net income attributable to LoJack Corporation $ 4,548 $ 1,462 Per diluted share $ 0.25 $ 0.08 *Please refer to Appendix for reconciliation of non-GAAP items
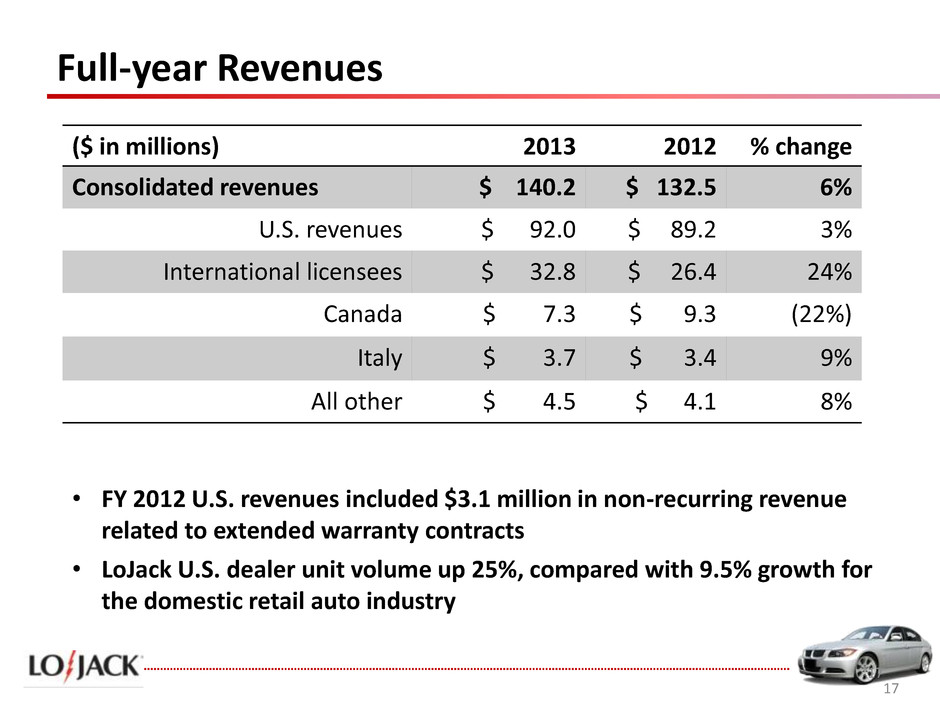
Full-year Revenues 17 17 ($ in millions) 2013 2012 % change Consolidated revenues $ 140.2 $ 132.5 6% U.S. revenues $ 92.0 $ 89.2 3% International licensees $ 32.8 $ 26.4 24% Canada $ 7.3 $ 9.3 (22%) Italy $ 3.7 $ 3.4 9% All other $ 4.5 $ 4.1 8% • FY 2012 U.S. revenues included $3.1 million in non-recurring revenue related to extended warranty contracts • LoJack U.S. dealer unit volume up 25%, compared with 9.5% growth for the domestic retail auto industry
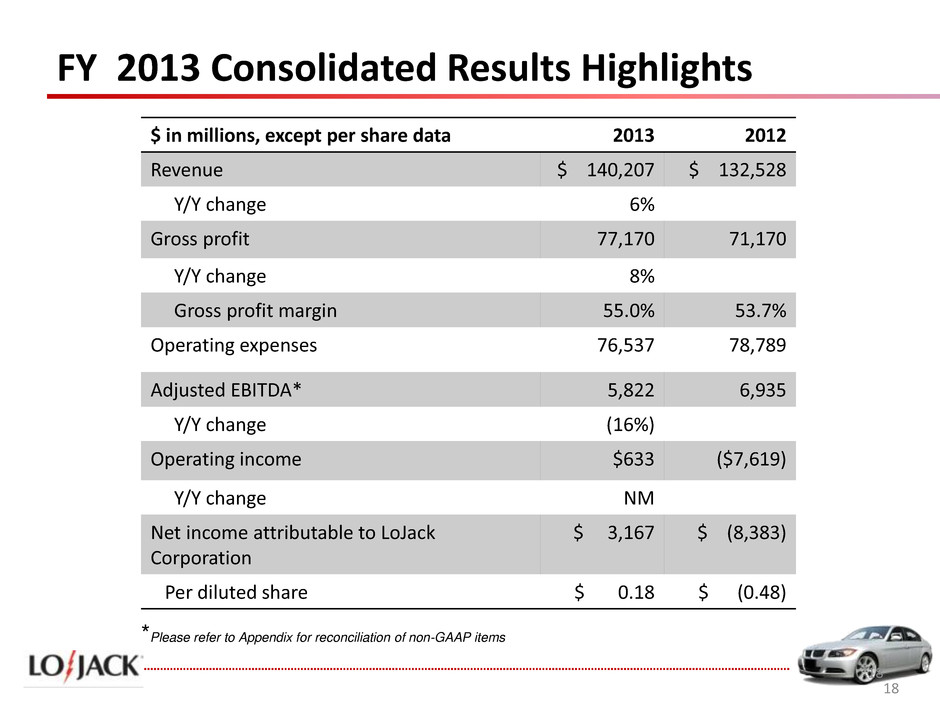
FY 2013 Consolidated Results Highlights 18 18 $ in millions, except per share data 2013 2012 Revenue $ 140,207 $ 132,528 Y/Y change 6% Gross profit 77,170 71,170 Y/Y change 8% Gross profit margin 55.0% 53.7% Operating expenses 76,537 78,789 Adjusted EBITDA* 5,822 6,935 Y/Y change (16%) Operating income $633 ($7,619) Y/Y change NM Net income attributable to LoJack Corporation $ 3,167 $ (8,383) Per diluted share $ 0.18 $ (0.48) *Please refer to Appendix for reconciliation of non-GAAP items
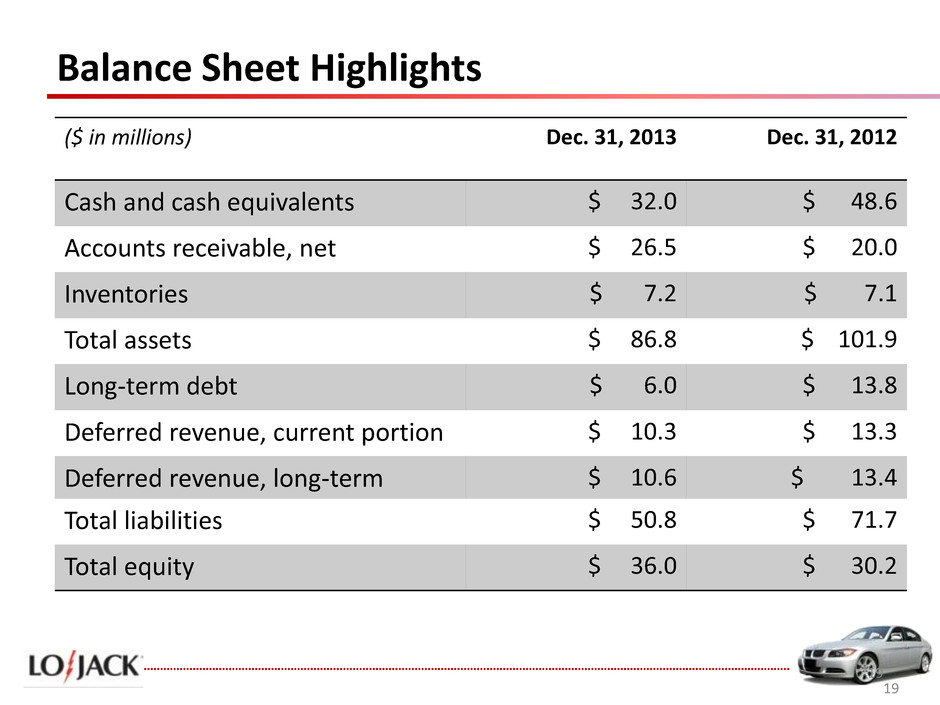
Balance Sheet Highlights ($ in millions) Dec. 31, 2013 Dec. 31, 2012 Cash and cash equivalents $ 32.0 $ 48.6 Accounts receivable, net $ 26.5 $ 20.0 Inventories $ 7.2 $ 7.1 Total assets $ 86.8 $ 101.9 Long-term debt $ 6.0 $ 13.8 Deferred revenue, current portion $ 10.3 $ 13.3 Deferred revenue, long-term $ 10.6 $ 13.4 Total liabilities $ 50.8 $ 71.7 Total equity $ 36.0 $ 30.2 19 19
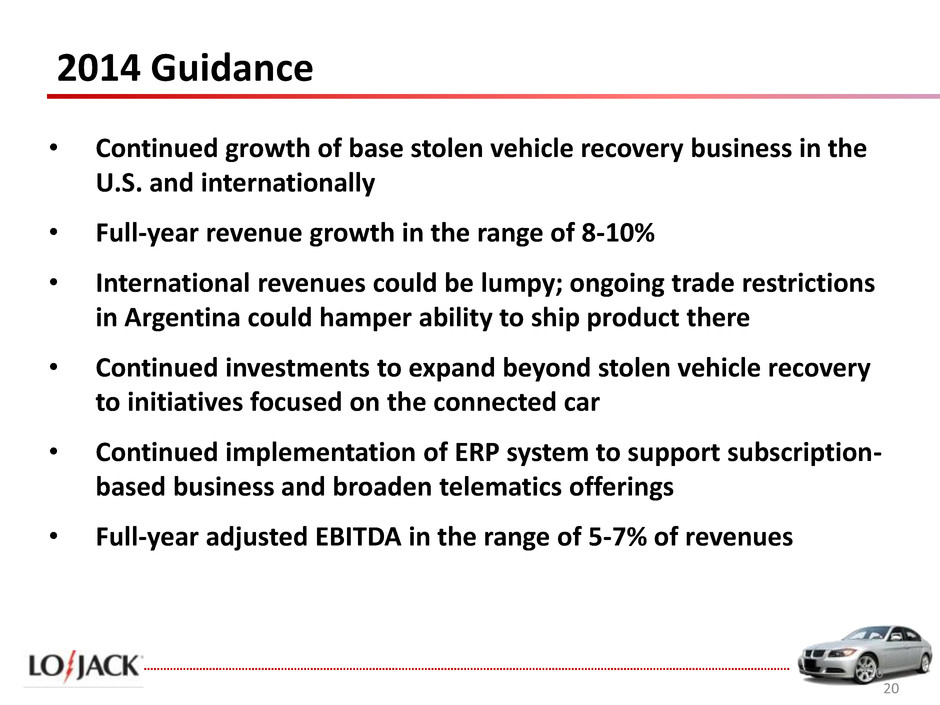
2014 Guidance 20 20 • Continued growth of base stolen vehicle recovery business in the U.S. and internationally • Full-year revenue growth in the range of 8-10% • International revenues could be lumpy; ongoing trade restrictions in Argentina could hamper ability to ship product there • Continued investments to expand beyond stolen vehicle recovery to initiatives focused on the connected car • Continued implementation of ERP system to support subscription- based business and broaden telematics offerings • Full-year adjusted EBITDA in the range of 5-7% of revenues
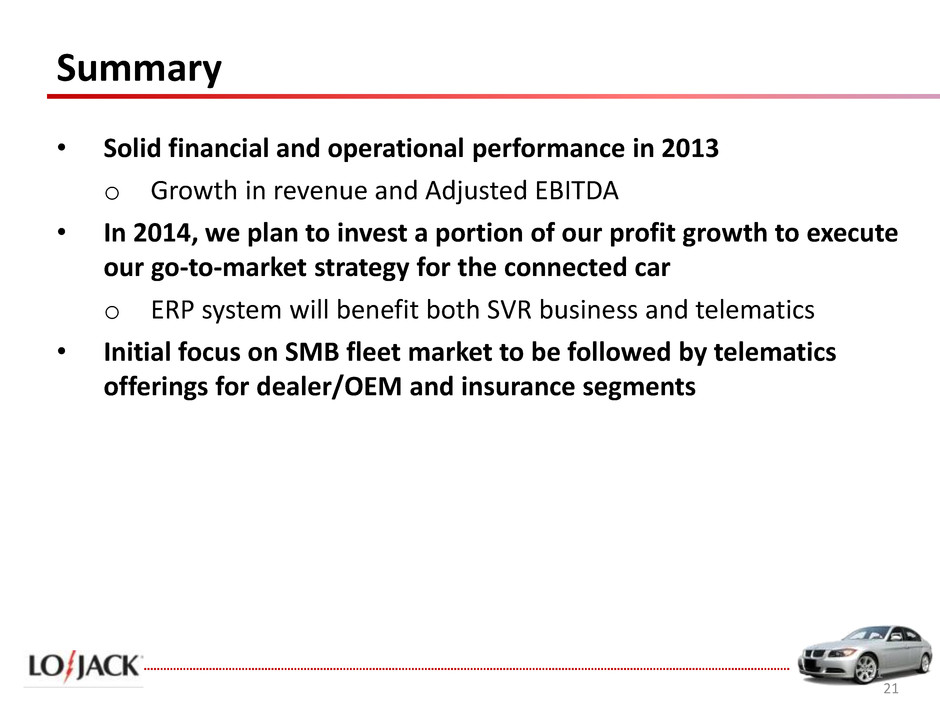
Summary 21 21 • Solid financial and operational performance in 2013 o Growth in revenue and Adjusted EBITDA • In 2014, we plan to invest a portion of our profit growth to execute our go-to-market strategy for the connected car o ERP system will benefit both SVR business and telematics • Initial focus on SMB fleet market to be followed by telematics offerings for dealer/OEM and insurance segments

February 20, 2014
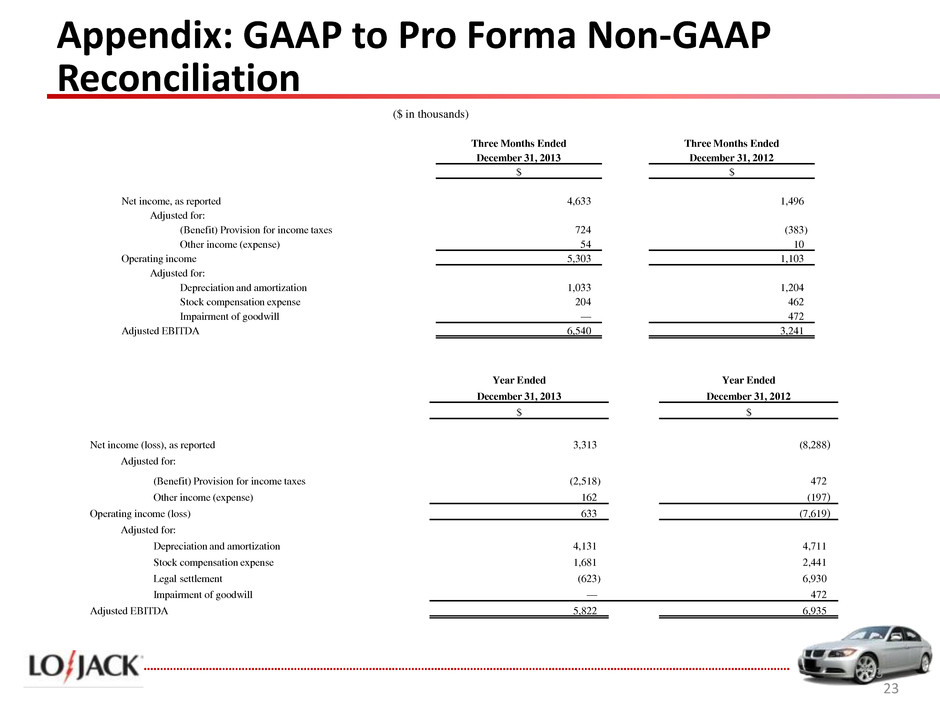
Three Months Ended Three Months Ended December 31, 2013 December 31, 2012 $ $ Net income, as reported 4,633 1,496 Adjusted for: (Benefit) Provision for income taxes 724 (383 ) Other income (expense) 54 10 Operating income 5,303 1,103 Adjusted for: Depreciation and amortization 1,033 1,204 Stock compensation expense 204 462 Impairment of goodwill — 472 Adjusted EBITDA 6,540 3,241 23 23 Appendix: GAAP to Pro Forma Non-GAAP Reconciliation ($ in thousands) Year Ended Year Ended December 31, 2013 December 31, 2012 $ $ Net income (loss), as reported 3,313 (8,288 ) Adjusted for: (Benefit) Provision for income taxes (2,518 ) 472 Other income (expense) 162 (197 ) Operating income (loss) 633 (7,619 ) Adjusted for: Depreciation and amortization 4,131 4,711 Stock compensation expense 1,681 2,441 Legal settlement (623 ) 6,930 Impairment of goodwill — 472 Adjusted EBITDA 5,822 6,935
