Attached files
EXHIBIT 99.2

* Fourth Quarter 2013 Conference Call February 20, 2014

* Forward-Looking Statements This presentation contains forward-looking statements that involve risks, uncertainties and assumptions that could cause our results to differ materially from those expressed or implied by such forward-looking statements. All statements, other than statements of historical fact, are "forward-looking statements" within the meaning of the Private Securities Litigation Reform Act of 1995, including, without limitation, any statements regarding our strategy; any statements regarding future utilization; any projections of financial items; future operations expenditures; any statements of the plans, strategies and objectives of management for future operations; any statement concerning developments; any statements regarding future economic conditions or performance; any statements of expectation or belief; and any statements of assumptions underlying any of the foregoing. The forward-looking statements are subject to a number of known and unknown risks, uncertainties and other factors including but not limited to the performance of contracts by suppliers, customers and partners; actions by governmental and regulatory authorities; operating hazards and delays; our ultimate ability to realize current backlog; employee management issues; complexities of global political and economic developments; geologic risks; volatility of oil and gas prices and other risks described from time to time in our reports filed with the Securities and Exchange Commission ("SEC"), including the Company's most recently filed Annual Report on Form 10-K and in the Company’s other filings with the SEC, which are available free of charge on the SEC’s website at www.sec.gov. We assume no obligation and do not intend to update these forward-looking statements except as required by the securities laws. Social Media From time to time we provide information about the Company on Twitter (@Helix_ESG) and LinkedIn (www.linkedin.com/company/helix-energy-solutions-group).

* Presentation Outline Executive Summary Summary of Q4 2013 Results (pg. 5) Operational Highlights by Segment Contracting Services (pg. 9) Key Balance Sheet Metrics (pg. 13) 2014 Outlook (pg. 16) Non-GAAP Reconciliations (pg. 21) Questions & Answers

* Executive Summary *

* Executive Summary ($ in millions, except per share data) 2012 impairment charges include $157.8 million for the Caesar and related mobile pipelay equipment (Q4), $14.6 million for the Intrepid and $4.6 million for well intervention assets at our former operations in Australia. See non-GAAP reconciliation on slide 21.

* Executive Summary Q4 2013 earnings of $0.35 per diluted share compared to $0.42 per diluted share in Q3 2013 Q3 included a $15.6 million gain on the sale of the Express and an $8.6 million loss on the early extinguishment of debt; both items netted to an after-tax impact of $0.04 per diluted share Contracting Services and Production Facilities 94% utilization of Well Intervention vessels; strong outlook and backlog expected for 2014 and beyond Skandi Constructor (chartered vessel) mobilized to offshore West Africa in Q4; approximately 60 day campaign commenced mid-January 2014 Robotics long-term chartered fleet utilization of 88% utilization in Q4; all four trenchers active in the fourth quarter Completed 46 day regulatory dry dock of the Helix Producer I and returned to service mid-November 2013 Completed 47 day regulatory dry dock of the Well Enhancer and returned to service late January 2014 Helix 534 commenced operations in the Gulf of Mexico in mid-February 2014 Signed agreement with Petróbras to provide well intervention services offshore Brazil, commencing in 2016
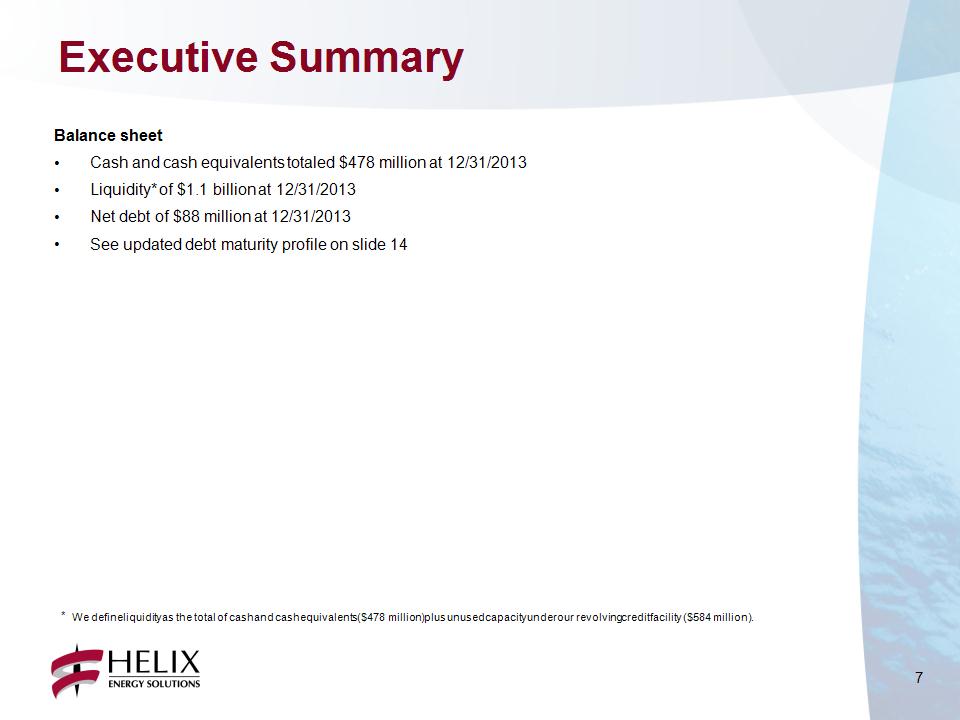
* Executive Summary Balance sheet Cash and cash equivalents totaled $478 million at 12/31/2013 Liquidity* of $1.1 billion at 12/31/2013 Net debt of $88 million at 12/31/2013 See updated debt maturity profile on slide 14 We define liquidity as the total of cash and cash equivalents ($478 million) plus unused capacity under our revolving credit facility ($584 million).
* Operational Highlights *

* ($ in millions, except percentages) See non-GAAP reconciliation on slide 24. Amounts are prior to intercompany eliminations. Before gross profit impact of $157.8 million in asset impairments for the Caesar and related mobile pipelay equipment in Q4 2012. 94% utilization for the Well Intervention fleet Skandi Constructor mobilized for operations off the coast of West Africa 88% chartered vessel utilization in Robotics Helix Producer I completed dry dock and returned to service mid-November 2013 Well Enhancer completed dry dock and returned to service January 2014 Contracting Services ROV onboard the Siem Daya I

* GOM Q4000 fully utilized during Q4 IRS no. 2 on hire for the entire quarter; working at operational rates beginning late November through the end of the Q4 Helix 534 commenced operations in the Gulf of Mexico in mid-February 2014 with full backlog for the remainder of the year; backlog beyond 2014, and extending into 2017 North Sea Full utilization of Seawell and Skandi Constructor during Q4 on a variety of well intervention projects Well Enhancer fully utilized prior to entering dry dock in mid-December; returned to service late January 2014 Skandi Constructor departed UK mid-December for a well intervention campaign offshore Africa All vessels with high backlog in Q1 through Q3 2014, offshore UK, Canada and Africa; limited availability in Q4 2014 Contracting Services – Well Intervention The SIL system
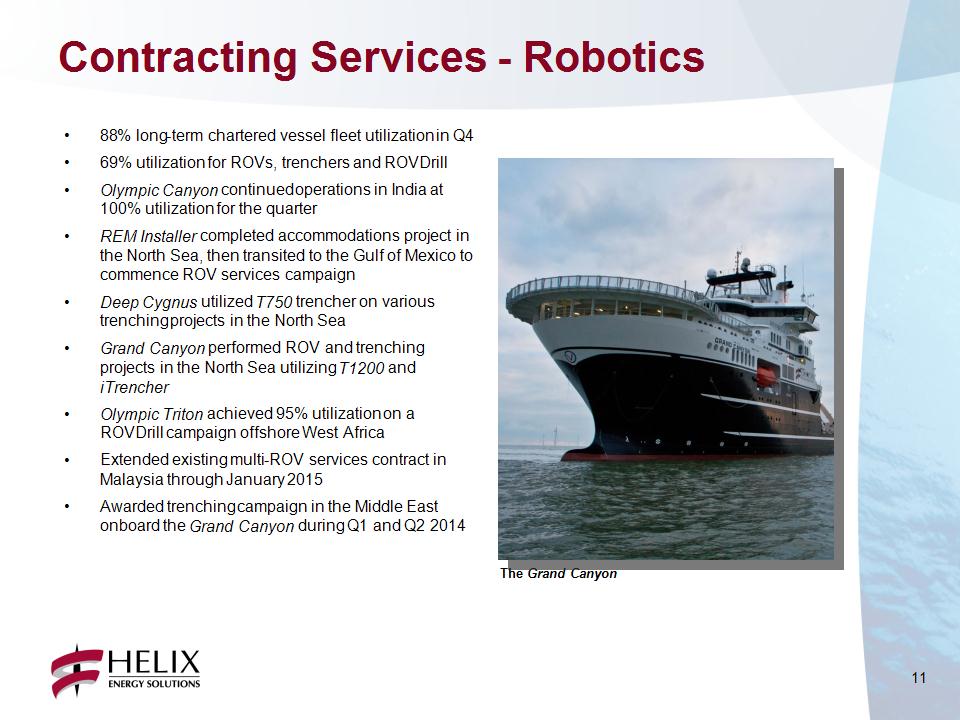
* 88% long-term chartered vessel fleet utilization in Q4 69% utilization for ROVs, trenchers and ROVDrill Olympic Canyon continued operations in India at 100% utilization for the quarter REM Installer completed accommodations project in the North Sea, then transited to the Gulf of Mexico to commence ROV services campaign Deep Cygnus utilized T750 trencher on various trenching projects in the North Sea Grand Canyon performed ROV and trenching projects in the North Sea utilizing T1200 and iTrencher Olympic Triton achieved 95% utilization on a ROVDrill campaign offshore West Africa Extended existing multi-ROV services contract in Malaysia through January 2015 Awarded trenching campaign in the Middle East onboard the Grand Canyon during Q1 and Q2 2014 Contracting Services – Robotics The Grand Canyon
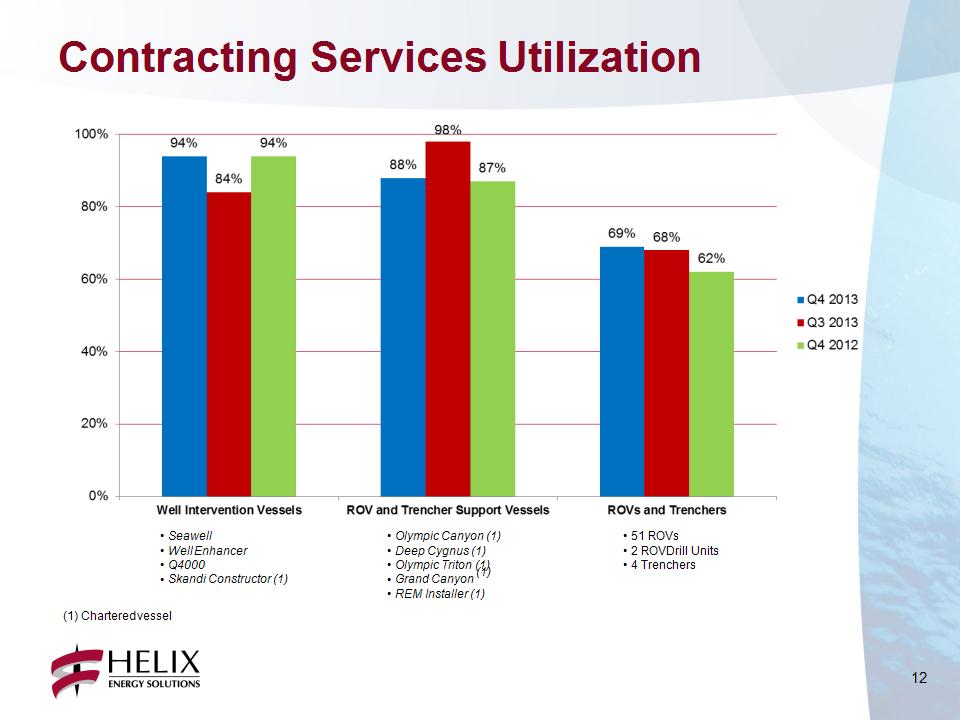
* Olympic Canyon (1) Deep Cygnus (1) Olympic Triton (1) Grand Canyon (1) REM Installer (1) Seawell Well Enhancer Q4000 Skandi Constructor (1) 51 ROVs 2 ROVDrill Units 4 Trenchers (1) Chartered vessel Contracting Services Utilization
* Key Balance Sheet Metrics *
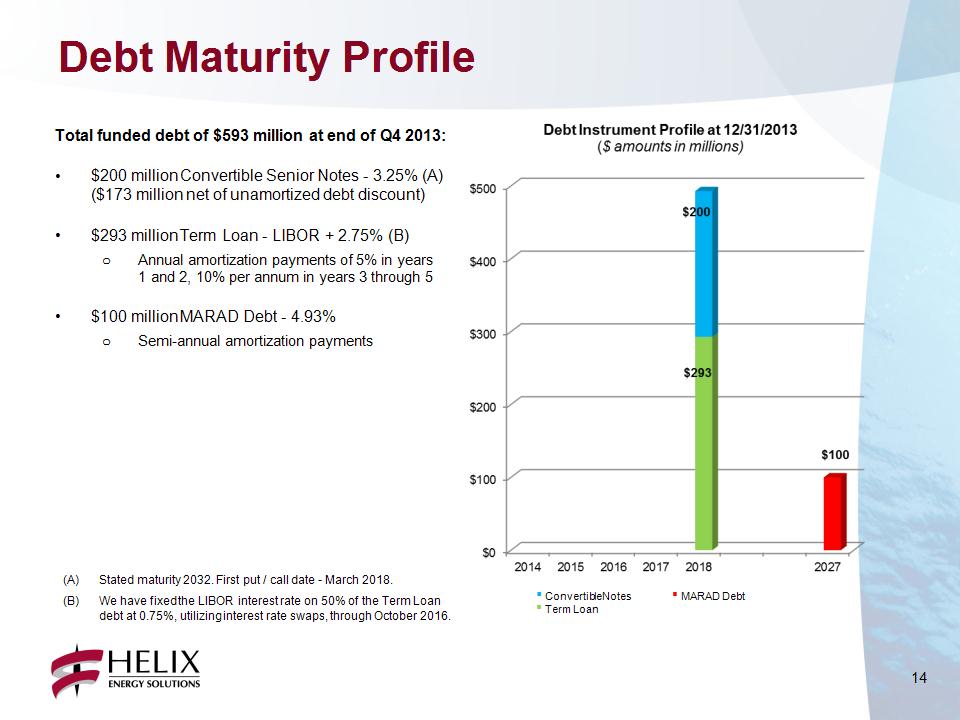
* Total funded debt of $593 million at end of Q4 2013: $200 million Convertible Senior Notes – 3.25% (A) ($173 million net of unamortized debt discount) $293 million Term Loan – LIBOR + 2.75% (B) Annual amortization payments of 5% in years 1 and 2, 10% per annum in years 3 through 5 $100 million MARAD Debt – 4.93% Semi-annual amortization payments Debt Maturity Profile Convertible Notes Term Loan MARAD Debt Stated maturity 2032. First put / call date – March 2018. We have fixed the LIBOR interest rate on 50% of the Term Loan debt at 0.75%, utilizing interest rate swaps, through October 2016.

* Liquidity of approximately $1.1 billion at 12/31/2013 ($ amounts in millions) Includes impact of unamortized debt discount under our convertible senior notes. We define liquidity as the total of cash and cash equivalents ($478 million) plus unused capacity under our revolving credit facility ($584 million). Debt and Liquidity Profile

* 2014 Outlook *

* 2014 Outlook ($ in millions) Earnings per share estimates based on a corporate tax rate ranging from 25% - 30%.

* 2014 Outlook Contracting Services backlog as of December 31, 2013 was approximately $1.8 billion; total backlog of approximately $2.0 billion including Production Facilities Utilization expected to remain strong for the well intervention fleet Q4000 backlog through 2015; negotiations ongoing to extend commitments into 2017 Q5000 backlog currently a minimum of 270 days annually over first 5 years of operations Helix 534 has full backlog through 2016 and extending into 2017 Well Enhancer and Seawell have high levels of backlog in 2014 and extending into 2015 Seawell re-fit dry dock expected to commence in December 2014 Skandi Constructor nearly full backlog in 2014, with commitments into 2015 Vessel operating offshore Africa for Q1 2014, with new business commitments in Canada and West of Shetland Q2/Q3 2014 Skandi Constructor scheduled for ~30 day dry dock in December

* 2014 Outlook Robotics business entering 2014 with a healthy, growing backlog (14% increase in backlog from Q3 to Q4 2013) Europe and Middle East trenching markets expected to be strong; similar to 2012 Multi-trencher burial campaign onboard the Grand Canyon I in the Middle East during Q1 and Q2 2014 Mobilizing two new work class ROVs onboard client’s vessel to commence 5-year ROV services contract beginning Q1 2014 “Walk-to-work” accommodations project in the North Sea utilizing the REM Installer commencing March 2014 for approximately six months Grand Canyon II vessel expected to enter Robotics long-term chartered fleet late 2014
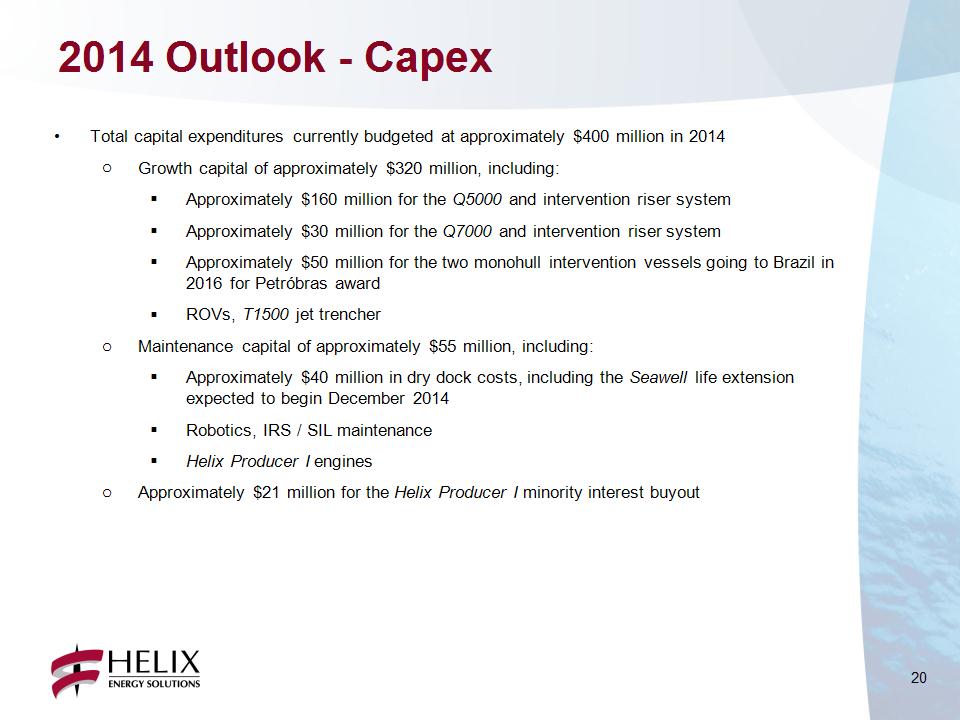
* 2014 Outlook – Capex Total capital expenditures currently budgeted at approximately $400 million in 2014 Growth capital of approximately $320 million, including: Approximately $160 million for the Q5000 and intervention riser system Approximately $30 million for the Q7000 and intervention riser system Approximately $50 million for the two monohull intervention vessels going to Brazil in 2016 for Petróbras award ROVs, T1500 jet trencher Maintenance capital of approximately $55 million, including: Approximately $40 million in dry dock costs, including the Seawell life extension expected to begin December 2014 Robotics, IRS / SIL maintenance Helix Producer I engines Approximately $21 million for the Helix Producer I minority interest buyout

* Non-GAAP Reconciliations *
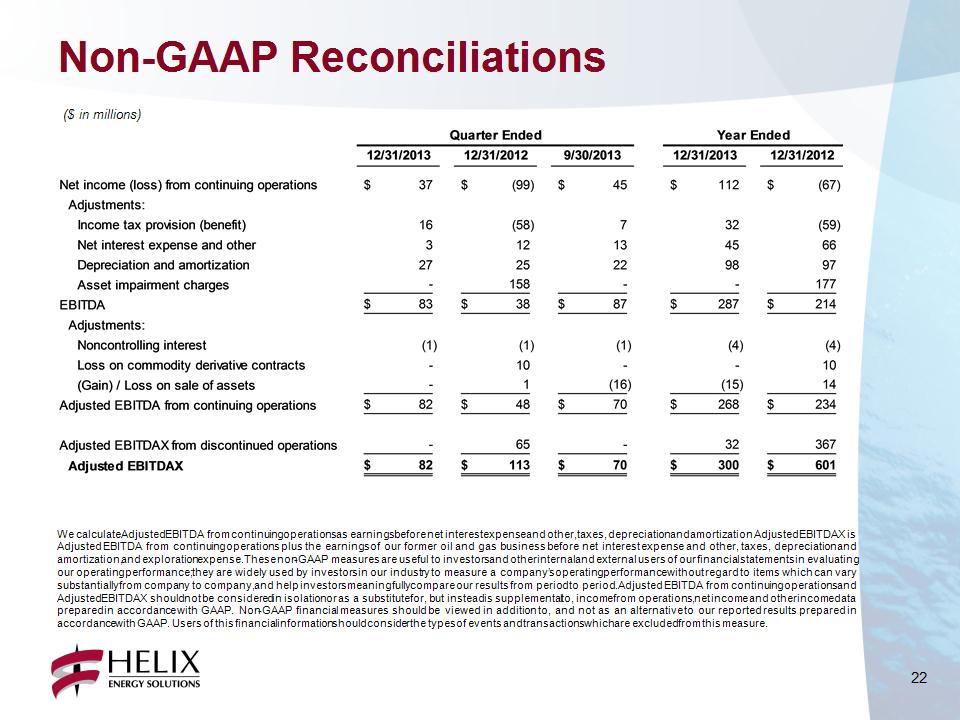
* Non-GAAP Reconciliations ($ in millions) We calculate Adjusted EBITDA from continuing operations as earnings before net interest expense and other, taxes, depreciation and amortization. Adjusted EBITDAX is Adjusted EBITDA from continuing operations plus the earnings of our former oil and gas business before net interest expense and other, taxes, depreciation and amortization, and exploration expense. These non-GAAP measures are useful to investors and other internal and external users of our financial statements in evaluating our operating performance; they are widely used by investors in our industry to measure a company’s operating performance without regard to items which can vary substantially from company to company, and help investors meaningfully compare our results from period to period. Adjusted EBITDA from continuing operations and Adjusted EBITDAX should not be considered in isolation or as a substitute for, but instead is supplemental to, income from operations, net income and other income data prepared in accordance with GAAP. Non-GAAP financial measures should be viewed in addition to, and not as an alternative to our reported results prepared in accordance with GAAP. Users of this financial information should consider the types of events and transactions which are excluded from this measure.

* Non-GAAP Reconciliations We calculate Adjusted EBITDA from continuing operations as earnings before net interest expense and other, taxes, depreciation and amortization. Adjusted EBITDAX is Adjusted EBITDA from continuing operations plus the earnings of our former oil and gas business before net interest expense and other, taxes, depreciation and amortization, and exploration expense. These non-GAAP measures are useful to investors and other internal and external users of our financial statements in evaluating our operating performance; they are widely used by investors in our industry to measure a company’s operating performance without regard to items which can vary substantially from company to company, and help investors meaningfully compare our results from period to period. Adjusted EBITDA from continuing operations and Adjusted EBITDAX should not be considered in isolation or as a substitute for, but instead is supplemental to, income from operations, net income and other income data prepared in accordance with GAAP. Non-GAAP financial measures should be viewed in addition to, and not as an alternative to our reported results prepared in accordance with GAAP. Users of this financial information should consider the types of events and transactions which are excluded from this measure. ($ in millions)

* Non-GAAP Reconciliations ($ in millions)
* Follow Helix on Twitter: @Helix_ESG Join the discussion on LinkedIn: www.linkedin.com/company/helix