Attached files
| file | filename |
|---|---|
| 8-K - 8-K - VEECO INSTRUMENTS INC | a14-6218_18k.htm |
| EX-99.1 - EX-99.1 - VEECO INSTRUMENTS INC | a14-6218_1ex99d1.htm |
Exhibit 99.2
|
|
Q4 2013 Conference Call February 19, 2014 |
|
|
Safe Harbor To the extent that this presentation discusses expectations or otherwise makes statements about the future, such statements are forward-looking and are subject to a number of risks and uncertainties that could cause actual results to differ materially from the statements made. These items include the risk factors discussed in the Business Description and Management's Discussion and Analysis sections of Veeco's Annual Report on Form 10-K for the year ended December 31, 2012 and subsequent Quarterly Reports on Form 10-Q and current reports on Form 8-K. Veeco does not undertake any obligation to update any forward-looking statements to reflect future events or circumstances after the date of such statements. |
|
|
John Peeler, Chairman & Chief Executive Officer Introduction |
|
|
Difficult Finish to a Challenging Year Q4 13 Bookings down 7% sequentially to $85M Cash and Short Term Investments $495M Q4 13 Revenue down 26% sequentially to $73M Trough conditions continued in all businesses Continued strong balance sheet and cash preservation As expected, low shipment levels in MOCVD and Data Storage |
|
|
Dave Glass, CFO Financial Highlights |

|
|
Q4 2013 vs. Q3 2013 Q4 2013 Q3 2013 Revenue $73M $99M GM 21% 31% OPEX* $48M $39M Loss from continuing operations ($22M) ($6M) Adjusted EBITA ($27M) ($5M) Non-GAAP EPS ($0.42) ($0.08) Poor Gross Margin & Spike in OPEX Pressure Q4 2013 Bottom Line *Excludes amortization and restructuring; see financial tables |
|
|
Q4 2013 Revenue Highlights Total Revenue: $73M LED & Solar ~$56M MOCVD $50M; down 27% sequentially MBE & ALD $6M ($M) Q4 ‘13 Q3 ‘13 Adj EBITA ($16.5M) ($1.7M) ($M) Q4 ‘13 Q3 ‘13 Adj EBITA ($3.1M) $2.1M Data Storage ~$17M Data Storage down 31% sequentially |
|
|
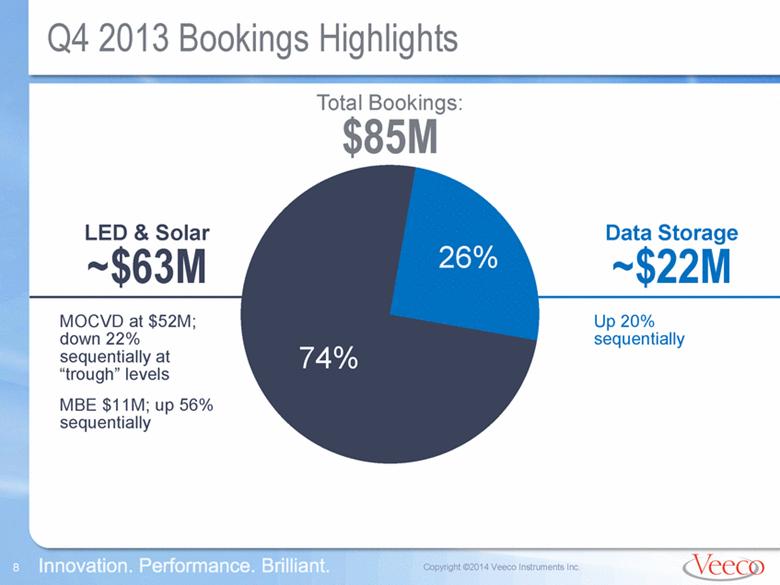
Q4 2013 Bookings Highlights Total Bookings: $85M LED & Solar ~$63M MOCVD at $52M; down 22% sequentially at “trough” levels MBE $11M; up 56% sequentially Data Storage ~$22M Up 20% sequentially |
|
|
Strong Balance Sheet 12/31/13 12/31/12 Cash & Short-term Investments* $495M $579M Accounts Receivable $24M $63M Inventory $60M $60M Fixed Assets, Net $89M $98M Total Assets $948M $937M Long-term Debt (including current portion) $2M $2M Equity $780M $811M *Includes $2.7 million of restricted cash as of 12/31/13 and $2.0 million as of 12/31/12. $76M Cash used for Synos ALD Purchase in Q4 2013 2013 Cash Flow About Breakeven |
|
|
Q1 2014 Guidance Q1 2014 Orders Likely to Increase Revenue $85-95 million Gross Margins 33-35% OPEX (Includes equity compensation and excludes amortization) $42-43 million Revenue and GM to improve; OPEX to trend back down Modeling footnote: Q1 2014 Equity comp. $4.7M; and amortization $2.9M |
|
|
Wheels in Motion for Gross Margin Recovery Gross Margin ~31% >40% MOCVD ASP Recovery and Impact of New Products MOCVD and Other Cost Reduction Initiatives Volume Improvement ALD to volume revenue |
|
|
Business Update and Outlook |

|
|
LED Lighting Adoption to Accelerate in 2014 and 2015 Source **: McKinsey Lighting Report 2012 69% 2020 Average Selling Price for Different Lamps 45% 2016 LED Value-Based Percent of Lighting Market** Source *: iHS, Barclays Research estimates 9% 2012 >60% CAGR |
|
|
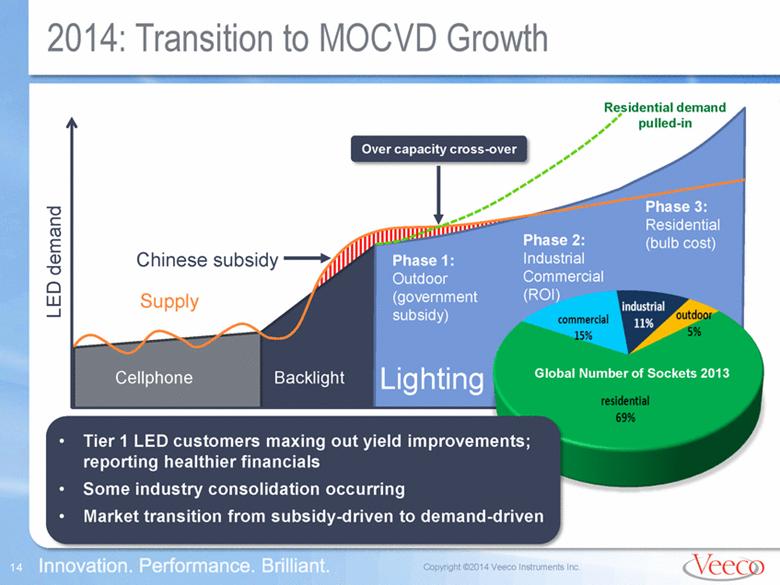
2014: Transition to MOCVD Growth LED demand Supply Chinese subsidy Cellphone Backlight Lighting Phase 1: Outdoor (government subsidy) Phase 2: Industrial Commercial (ROI) Phase 3: Residential (bulb cost) Now Over capacity cross-over Residential demand pulled-in Global Number of Sockets 2013 Tier 1 LED customers maxing out yield improvements; reporting healthier financials Some industry consolidation occurring Market transition from subsidy-driven to demand-driven |
|
|
Veeco: Top Choice of LED Industry Leaders Total MOCVD Industry Shipments 2010-2013 Shipment Market Share 2010-2013 Source for both charts: IHS Q4 13 Report on MOCVD Shipments Veeco market share reached >60% in 2013 #1 supplier to majority of LED makers with the biggest installed base #1 supplier to majority of LED technology leaders |
|
|
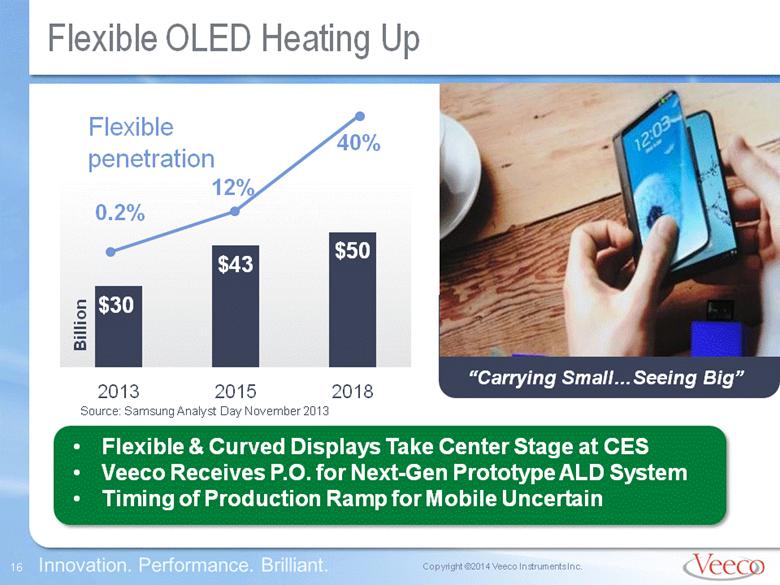
Flexible OLED Heating Up Flexible & Curved Displays Take Center Stage at CES Veeco Receives P.O. for Next-Gen Prototype ALD System Timing of Production Ramp for Mobile Uncertain Source: Samsung Analyst Day November 2013 “Carrying SmallSeeing Big” Flexible penetration 0.2% 12% 40% $30 $43 $50 Billion |
|
|
Veeco’s Top Priorities Develop and launch game changing new products Execute manufacturing cost reduction initiatives and lower expenses wherever possible Drive process improvement initiatives Improve product differentiation, customer value and pricing to stem margin erosion Transition to Profitable Growth |
|
|
Q&A Session |

|
|
Financial Tables and Reconciliation |
|
|
Income Statement 39,051 38,807 38,698 38,904 Diluted 38,477 38,807 38,698 38,904 Basic Weighted average shares outstanding: $ 0.79 $ (1.09) $ (0.23) $ (0.57) Income (loss) 0.11 - (0.01) - Discontinued operations $ 0.68 $ (1.09) $ (0.22) $ (0.57) Continuing operations Diluted: $ 0.80 $ (1.09) $ (0.23) $ (0.57) Income (loss) 0.11 - (0.01) - Discontinued operations $ 0.69 $ (1.09) $ (0.22) $ (0.57) Continuing operations Basic: Income (loss) per common share: $ 30,928 $ (42,263) $ (9,055) $ (22,085) Net income (loss) 4,399 - (413) - Income (loss) from discontinued operations 1,870 - 148 - Income tax provision (benefit) 6,269 - (265) - Income (loss) from discontinued operations before income taxes Discontinued operations: 26,529 (42,263) (8,642) (22,085) Income (loss) from continuing operations 11,657 (28,947) 2,591 (13,372) Income tax provision (benefit) 38,186 (71,210) (6,051) (35,457) Income (loss) from continuing operations before income taxes 974 602 266 (18) Interest income (expense), net 37,212 (71,812) (6,317) (35,439) Operating income (loss) - 829 - 829 Changes in contingent consideration (398) (1,017) 228 (876) Other expense (income), net 178,319 175,142 44,816 51,128 Total operating expenses 1,335 1,220 1,335 1,220 Asset impairment 3,813 1,485 1,736 (286) Restructuring 4,908 5,527 1,031 2,961 Amortization 95,153 81,424 22,162 20,824 Research and development 73,110 85,486 18,552 26,409 Selling, general and administrative Operating expenses (income): 215,133 103,142 38,727 15,642 Gross profit 300,887 # 228,607 68,122 57,567 Cost of sales $ 516,020 # $ 331,749 $ 106,849 $ 73,209 Net sales (Audited) (Unaudited) (Unaudited) (Unaudited) 2012 2013 2012 2013 December 31, December 31, Year ended Three months ended (In thousands, except per share data) Consolidated Statements of Operations Veeco Instruments Inc. and Subsidiaries |
|
|
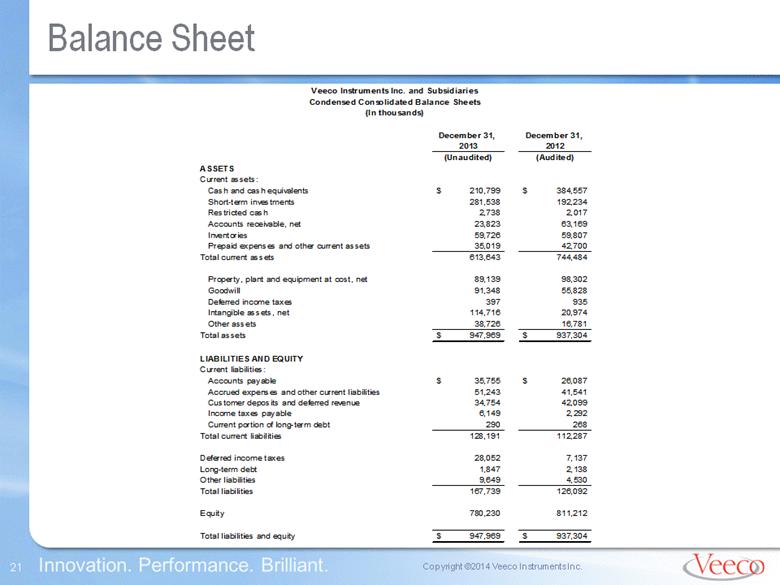
Balance Sheet $ 937,304 $ 947,969 Total liabilities and equity 811,212 780,230 Equity 126,092 167,739 Total liabilities 4,530 9,649 Other liabilities 2,138 1,847 Long-term debt 7,137 28,052 Deferred income taxes 112,287 128,191 Total current liabilities 268 290 Current portion of long-term debt 2,292 6,149 Income taxes payable 42,099 34,754 Customer deposits and deferred revenue 41,541 51,243 Accrued expenses and other current liabilities $ 26,087 $ 35,755 Accounts payable Current liabilities: LIABILITIES AND EQUITY $ 937,304 $ 947,969 Total assets 16,781 38,726 Other assets 20,974 114,716 Intangible assets, net 935 397 Deferred income taxes 55,828 91,348 Goodwill 98,302 89,139 Property, plant and equipment at cost, net 744,484 613,643 Total current assets 42,700 35,019 Prepaid expenses and other current assets 59,807 59,726 Inventories 63,169 23,823 Accounts receivable, net 2,017 2,738 Restricted cash 192,234 281,538 Short-term investments $ 384,557 $ 210,799 Cash and cash equivalents Current assets: ASSETS (Audited) (Unaudited) 2012 2013 December 31, December 31, (In thousands) Condensed Consolidated Balance Sheets Veeco Instruments Inc. and Subsidiaries |
|
|
|
|
|
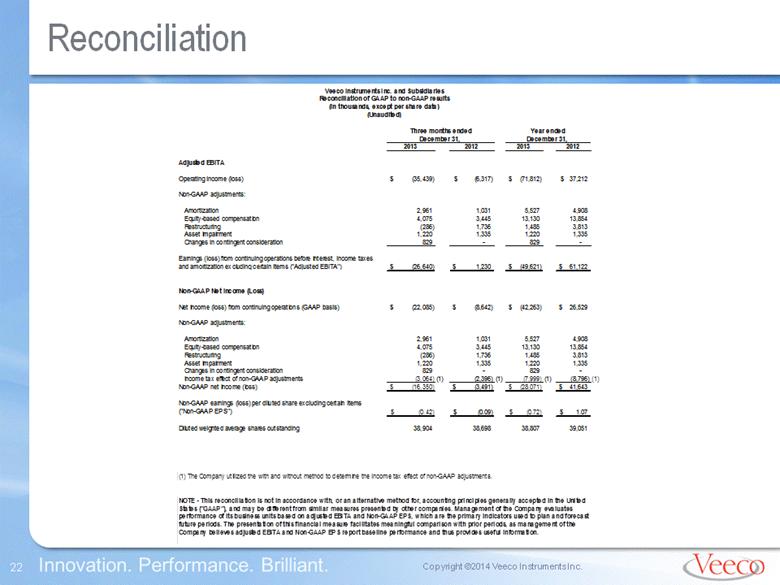
Reconciliation NOTE - This reconciliation is not in accordance with, or an alternative method for, accounting principles generally accepted in the United States ("GAAP"), and may be different from similar measures presented by other companies. Management of the Company (1) The Company utilized the with and without method to determine the income tax effect of non-GAAP adjustments. 39,051 38,807 38,698 38,904 Diluted weighted average shares outstanding $ 1.07 $ (0.72) $ (0.09) $ (0.42) Non-GAAP earnings (loss) per diluted share excluding certain items ("Non-GAAP EPS") $ 41,643 $ (28,071) $ (3,491) $ (16,350) Non-GAAP net income (loss) (1) (8,796) (1) (7,999) (1) (2,396) (1) (3,064) Income tax effect of non-GAAP adjustments - 829 - 829 Changes in contingent consideration 1,335 1,220 1,335 1,220 Asset impairment 3,813 1,485 1,736 (286) Restructuring 13,854 13,130 3,445 4,075 Equity-based compensation 4,908 5,527 1,031 2,961 Amortization Non-GAAP adjustments: $ 26,529 $ (42,263) $ (8,642) $ (22,085) Net income (loss) from continuing operations (GAAP basis) Non-GAAP Net Income (Loss) $ 61,122 $ (49,621) $ 1,230 $ (26,640) Earnings (loss) from continuing operations before interest, income taxes and amortization excluding certain items ("Adjusted EBITA") - 829 - 829 Changes in contingent consideration 1,335 1,220 1,335 1,220 Asset impairment 3,813 1,485 1,736 (286) Restructuring 13,854 13,130 3,445 4,075 Equity-based compensation 4,908 5,527 1,031 2,961 Amortization Non-GAAP adjustments: $ 37,212 $ (71,812) $ (6,317) $ (35,439) Operating income (loss) Adjusted EBITA 2012 2013 2012 2013 December 31, December 31, Year ended Three months ended (Unaudited) (In thousands, except per share data) Reconciliation of GAAP to non-GAAP results Veeco Instruments Inc. and Subsidiaries |
|
|
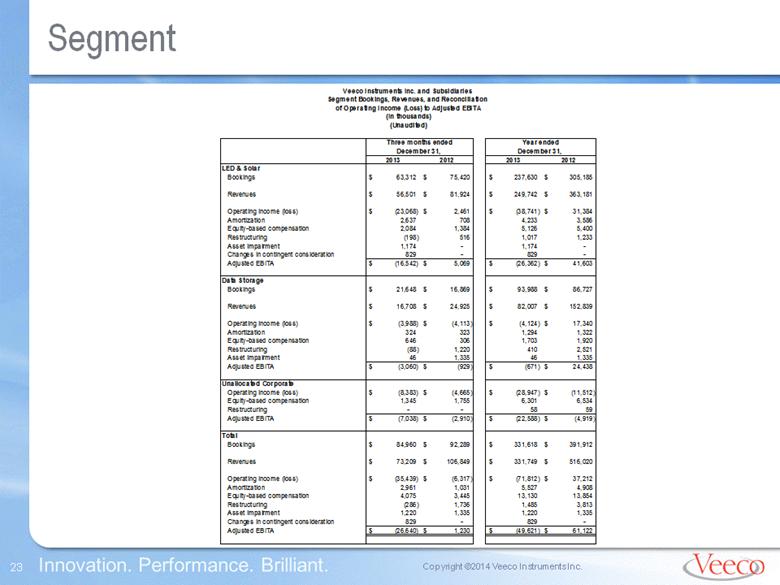
Segment $ 61,122 $ (49,621) $ 1,230 $ (26,640) Adjusted EBITA - 829 - 829 Changes in contingent consideration 1,335 1,220 1,335 1,220 Asset impairment 3,813 1,485 1,736 (286) Restructuring 13,854 13,130 3,445 4,075 Equity-based compensation 4,908 5,527 1,031 2,961 Amortization $ 37,212 $ (71,812) $ (6,317) $ (35,439) Operating income (loss) $ 516,020 $ 331,749 $ 106,849 $ 73,209 Revenues $ 391,912 $ 331,618 $ 92,289 $ 84,960 Bookings Total $ (4,919) $ (22,588) $ (2,910) $ (7,038) Adjusted EBITA 59 58 - - Restructuring 6,534 6,301 1,755 1,345 Equity-based compensation $ (11,512) $ (28,947) $ (4,665) $ (8,383) Operating income (loss) Unallocated Corporate $ 24,438 $ (671) $ (929) $ (3,060) Adjusted EBITA 1,335 46 1,335 46 Asset impairment 2,521 410 1,220 (88) Restructuring 1,920 1,703 306 646 Equity-based compensation 1,322 1,294 323 324 Amortization $ 17,340 $ (4,124) $ (4,113) $ (3,988) Operating income (loss) $ 152,839 $ 82,007 $ 24,925 $ 16,708 Revenues $ 86,727 $ 93,988 $ 16,869 $ 21,648 Bookings Data Storage $ 41,603 $ (26,362) $ 5,069 $ (16,542) Adjusted EBITA - 829 - 829 Changes in contingent consideration - 1,174 - 1,174 Asset impairment 1,233 1,017 516 (198) Restructuring 5,400 5,126 1,384 2,084 Equity-based compensation 3,586 4,233 708 2,637 Amortization $ 31,384 $ (38,741) $ 2,461 $ (23,068) Operating income (loss) $ 363,181 $ 249,742 $ 81,924 $ 56,501 Revenues $ 305,185 $ 237,630 $ 75,420 $ 63,312 Bookings LED & Solar 2012 2013 2012 2013 December 31, December 31, Year ended Three months ended (Unaudited) (In thousands) of Operating Income (Loss) to Adjusted EBITA Segment Bookings, Revenues, and Reconciliation Veeco Instruments Inc. and Subsidiaries |