Attached files
| file | filename |
|---|---|
| EX-99.1 - EX-99.1 - Premier, Inc. | a14-5610_2ex99d1.htm |
| 8-K - 8-K - Premier, Inc. | a14-5610_28k.htm |
| EX-99.2 - EX-99.2 - Premier, Inc. | a14-5610_2ex99d2.htm |
Exhibit 99.3
|
|
Second Quarter Fiscal 2014 Financial Results and Update February 13, 2014 |
|
|
1 Forward-looking statements and Non-GAAP financial measures Forward-looking statements—Certain statements made during this conference call and included in this presentation, including those related to our financial and business outlook and financial guidance, are “forward-looking statements.” Forward-looking statements may involve known and unknown risks, uncertainties and other factors that may cause the actual results of Premier to be materially different from historical results or from any future results or projections expressed or implied by such forward-looking statements. Accordingly, readers should not place undue reliance on any forward looking statements. Readers are urged to consider statements in the conditional or future tenses or that include terms such as “believes,” “belief,” “expects,” “estimates,” “intends,” “anticipates” or “plans” to be uncertain and forward- looking. Forward-looking statements may include comments as to Premier’s beliefs and expectations as to future events and trends affecting its business and are necessarily subject to uncertainties, many of which are outside Premier’s control. More information on potential risks and other factors that could affect Premier’s financial results is included, and updated, from time to time, in Premier’s periodic and current filings with the SEC, as well as those discussed in Premier’s IPO Prospectus filed with the SEC and available on Premier’s website. Forward looking statements speak only as of the date they are made. Premier undertakes no obligation to publicly update or revise any forward-looking statements. Non-GAAP financial measures—This presentation includes certain “non-GAAP financial measures” as defined in Regulation G under the Securities Exchange Act of 1934. Schedules are attached that reconcile the non-GAAP financial measures included in the following presentation to the most directly comparable financial measures calculated and presented in accordance with Generally Accepted Accounting Principles in the United States. The press release attached as an Exhibit to our Form 8-K filed with the SEC in connection with our earnings call, as well as our Form 10-Q for the quarter ended December 31, 2013 to be filed on or about February 14, 2014, provides further explanation and disclosure regarding our use of non-GAAP financial measures and should be read in conjunction with these supplemental slides. |
|
|
Susan DeVore, President & CEO Overview and Business Update |
|
|
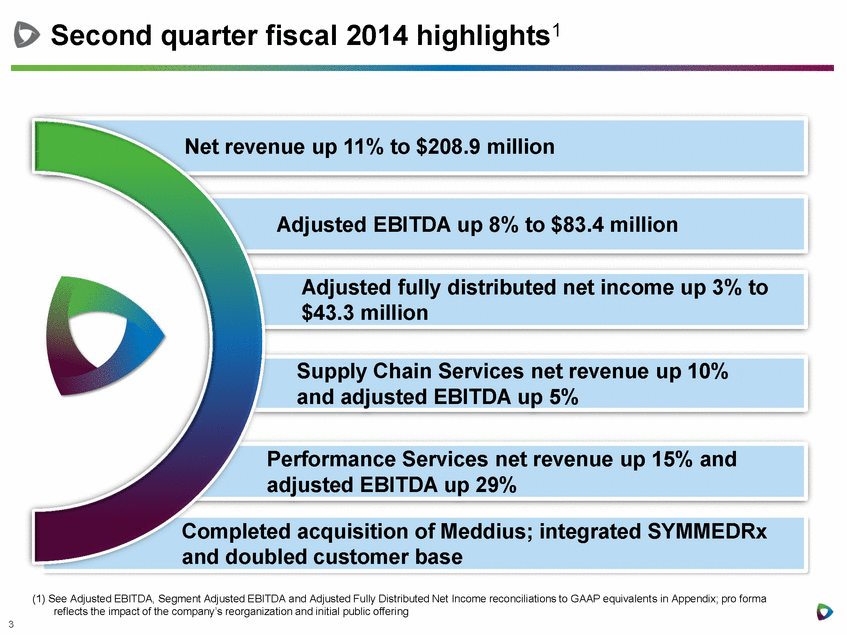
3 Second quarter fiscal 2014 highlights1 Adjusted EBITDA up 8% to $83.4 million Supply Chain Services net revenue up 10% and adjusted EBITDA up 5% Adjusted fully distributed net income up 3% to $43.3 million Performance Services net revenue up 15% and adjusted EBITDA up 29% Completed acquisition of Meddius; integrated SYMMEDRx and doubled customer base Net revenue up 11% to $208.9 million (1) See Adjusted EBITDA, Segment Adjusted EBITDA and Adjusted Fully Distributed Net Income reconciliations to GAAP equivalents in Appendix; pro forma reflects the impact of the company’s reorganization and initial public offering |
|
|
4 Industry trends and Premier strategic differentiation Member and industry needs Member co-innovation Intelligent and predictive analytics drive continuous improvement from the inside Visibility to cost and quality opportunities Vertical integration of supply chain Early leader in population health management Scale through shared infrastructure Premier strategic differentiation •Total cost reduction •Quality improvement across the continuum •Evolving delivery and payment models •Actionable data and information |
|
|
5 Consolidated financial performance Net revenue (millions) Adjusted EBITDA (millions) $188.1 $208.9 Q2'13 Q2'14 $77.5 $83.4 Q2'13 Q2'14 11% 8% |
|
|
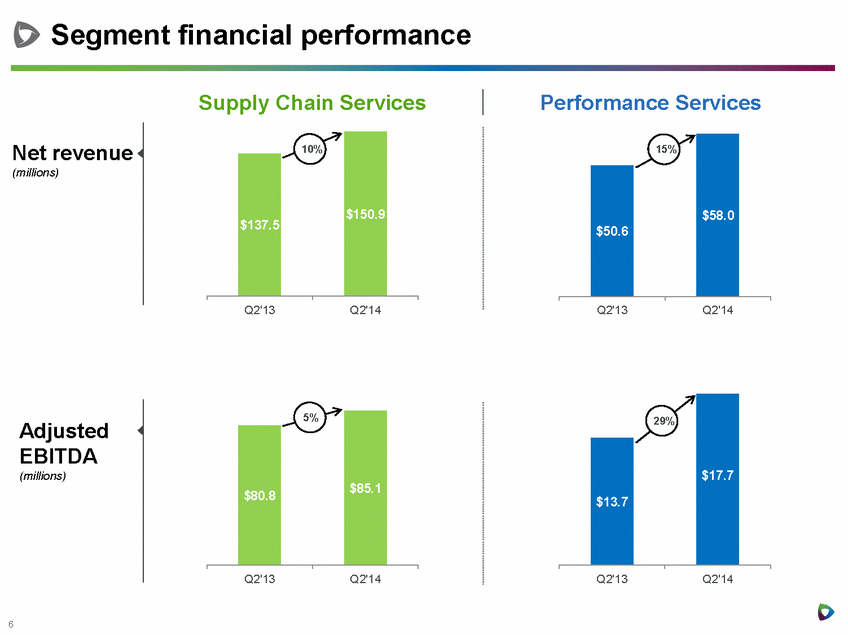
6 Net revenue (millions) Adjusted EBITDA (millions) Supply Chain Services Performance Services Segment financial performance $80.8 $85.1 Q2'13 Q2'14 $137.5 $150.9 Q2'13 Q2'14 10% 5% $50.6 $58.0 Q2'13 Q2'14 $13.7 $17.7 Q2'13 Q2'14 15% 29% |
|
|
7 Supply Chain Services growth drivers Strong contribution from direct sourcing and specialty pharmacy businesses – up 38% year over year Continued expansion into alternate site market Expect ramp-up of cash collections from new member conversions to increase in second half of year |
|
|
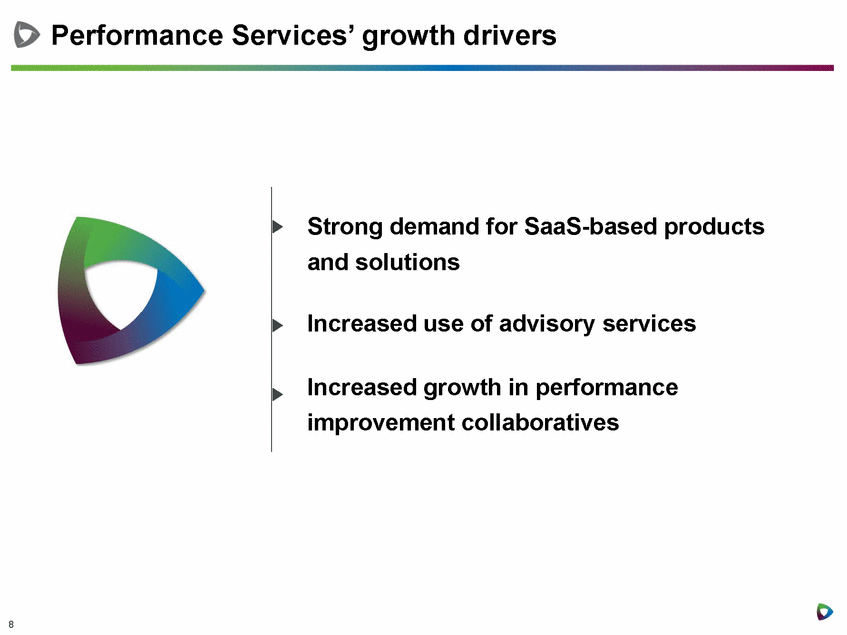
8 Performance Services’ growth drivers Strong demand for SaaS-based products and solutions Increased use of advisory services Increased growth in performance improvement collaboratives |
|
|
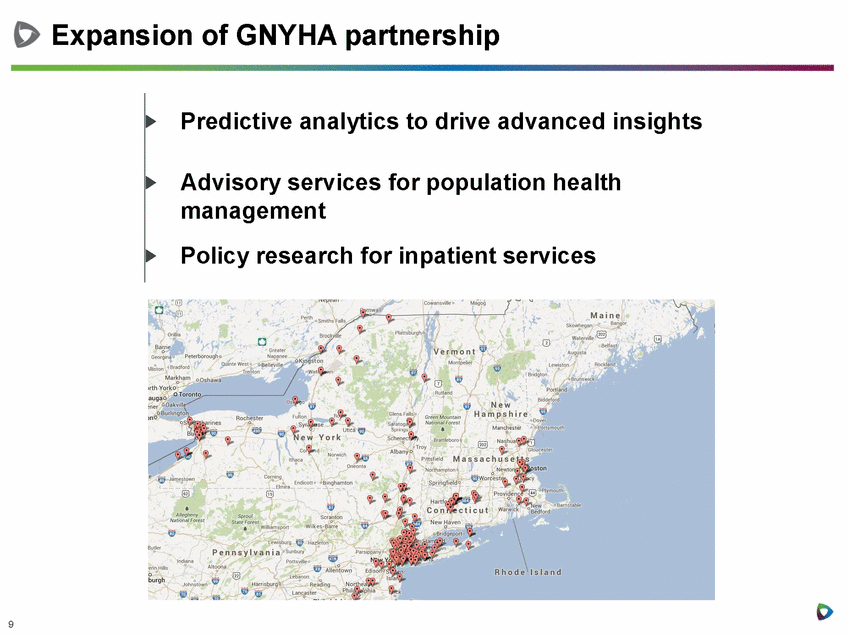
9 Expansion of GNYHA partnership Predictive analytics to drive advanced insights Advisory services for population health management Policy research for inpatient services |
|
|
10 Launch of PremierConnect Enterprise Financial/claims Multi-source data Supply chain/ pharmacy/lab Clinical and outcomes C:\Documents and Settings\bbowles\Desktop\Program Files\PremierConnect\logos\Brand architecture\Premier Supply Chain.HIRES.jpgC:\Documents and Settings\bbowles\Desktop\Program Files\PremierConnect\logos\Brand architecture\Premier Supply Chain.HIRES.jpgC:\Documents and Settings\bbowles\Desktop\Program Files\PremierConnect\logos\Brand architecture\Premier Supply Chain.HIRES.jpgC:\Documents and Settings\bbowles\Desktop\Program Files\PremierConnect\logos\Brand architecture\Premier Quality.HIRES.jpgC:\Documents and Settings\bbowles\Desktop\Program Files\PremierConnect\logos\Brand architecture\Premier Labor.HIRES.jpgC:\Documents and Settings\bbowles\Desktop\Program Files\PremierConnect\logos\Brand architecture\Premier Safety.HIRES.jpgC:\Documents and Settings\bbowles\Desktop\Program Files\PremierConnect\logos\Brand architecture\Premier Population Management.HIRES.jpgC:\Documents and Settings\bbowles\Desktop\Program Files\PremierConnect\logos\Brand architecture\Premier Population Management.HIRES.jpgC:\Documents and Settings\bbowles\Desktop\Program Files\PremierConnect\logos\Brand architecture\Premier Population Management.HIRES.jpgENTERPRISE Cloud based, enterprise data warehouse Acquisition, standardization and integration of multi-source data New operational and technical competencies Knowledge sharing through Data Alliance collaborative |
|
|
11 C:\Users\mburns\AppData\Local\Microsoft\Windows\Temporary Internet Files\Content.Outlook\QBOGRCB1\QUEST_six-circles_Rev 01.jpgQUESTAchievements of QUEST collaborative Prevented an estimated 136,375 deaths Reduced healthcare spending by nearly $11.65 billion Prevented approximately 40,808 readmissions Prevented approximately 17,991 instances of harm |
|
|
12 Strategic acquisitions drive growth opportunities symm_logo_lgNearly doubled client base in less than 6 months Member channel allows us to rapidly expand capabilities, enhances speed to market, and augments Premier’s unique technology platform Real-time data acquisition and integration-as-a-service |
|
|
Craig McKasson, Chief Financial Officer Financial Review |
|
|
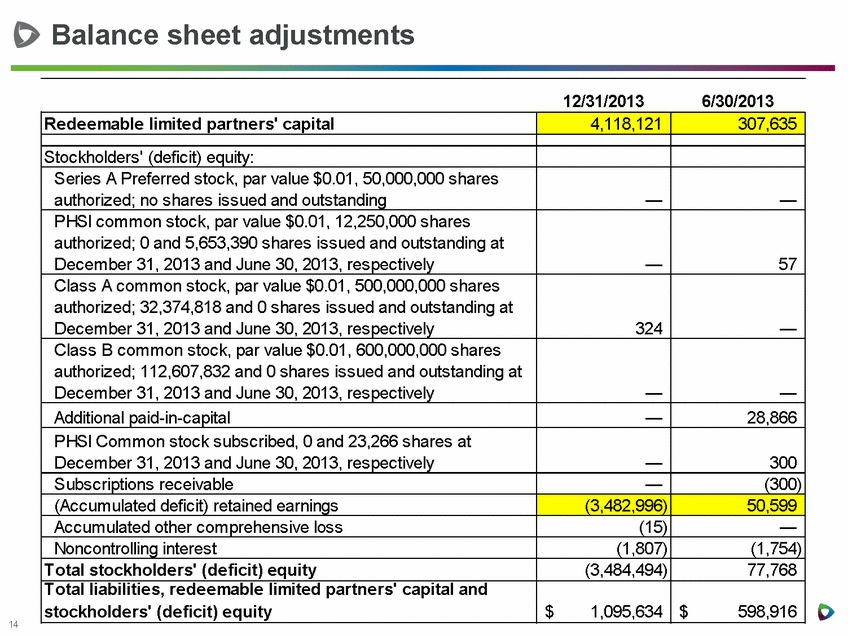
14 Balance sheet adjustments 2013Redeemable limited partners' capital4,118,121307,635Stockholders' (deficit) equity:Series A Preferred stock, par value $0.01, 50,000,000 shares authorized; no shares issued and outstanding——PHSI common stock, par value $0.01, 12,250,000 shares authorized; 0 and 5,653,390 shares issued and outstanding at December 31, 2013 and June 30, 2013, respectively—57Class A common stock, par value $0.01, 500,000,000 shares authorized; 32,374,818 and 0 shares issued and outstanding at December 31, 2013 and June 30, 2013, respectively324—Class B common stock, par value $0.01, 600,000,000 shares authorized; 112,607,832 and 0 shares issued and outstanding at December 31, 2013 and June 30, 2013, respectively——Additional paid-in-capital—28,866PHSI Common stock subscribed, 0 and 23,266 shares at December 31, 2013 and June 30, 2013, respectively—300Subscriptions receivable—(300)(Accumulated deficit) retained earnings(3,482,996)50,599Accumulated other comprehensive loss(15)—Noncontrolling interest(1,807)(1,754)Total stockholders' (deficit) equity(3,484,494)77,768Total liabilities, redeemable limited partners' capital and stockholders' (deficit) equity1,095,634$ 598,916$ |
|
|
15 Second quarter fiscal 2014 highlights1 Adjusted EBITDA up 8% to $83.4 million Supply Chain Services net revenue up 10% and adjusted EBITDA up 5% Adjusted fully distributed net income up 3% to $43.3 million Performance Services net revenue up 15% and adjusted EBITDA up 29% Completed acquisition of Meddius; integrated SYMMEDRx and doubled customer base Net revenue up 11% to $208.9 million (1) See Adjusted EBITDA, Segment Adjusted EBITDA and Adjusted Fully Distributed Net Income reconciliations to GAAP equivalents in Appendix; pro forma reflects the impact of the company’s reorganization and initial public offering |
|
|
16 Cash flow and cash position as of December 31, 2013 Cash flow from operations of $195.7M, an increase of $34M from last year Cash, cash equivalents and marketable securities of approximately $408.7M Capital expenditures of $26.0M for 6 months, up 37% YOY primarily due to the launch of PremierConnect Enterprise and investments in SaaS-based solutions Capital expenditures in line with expectations of approximately $54M for fiscal year 2014 |
|
|
17 Pro forma net revenue: Supply Chain Services Performance Services Total pro forma net revenue $614 - $631M $231 - $238M $845 - $869M % yoy change 10% – 13% 13% - 16% 11% - 13% Non-GAAP pro forma adjusted EBITDA $335 - $355M 7% - 13% Non-GAAP pro forma adjusted fully distributed EPS $1.20 - $1.29 NA* Fiscal 2014 guidance1 1As of fiscal 2014 second-quarter conference call, 02/13/2014. For non-GAAP measures, see reconciliations to GAAP equivalents in Appendix. Pro forma guidance measures are “forward-looking statements.” For information regarding the use and limitations of non-GAAP financial measures and forward-looking statements, see “Forward-looking statements and Non-GAAP financial measures” at the front of this presentation. * Not applicable Premier, Inc. affirms full-year fiscal 2014 financial guidance: |
|
|
18 Guidance assumptions Continued growth in Performance Services driven by demand for: •SaaS-based products; •advisory services; and •collaboratives. Steady growth in Supply Chain Services driven by: •growth of direct sourcing and •specialty pharmacy businesses; •new member additions and conversions; and •increased same-store supply chain penetration. |
|
|
Questions |
|
|
Contact Investor Relations Jim Storey Vice President, Investor Relations jim_storey@premierinc.com Thank you |
|
|
Appendix |
|
|
Premier, Inc. Supplemental Financial Information 2013* 2012 2013 2012 Reconciliation of Pro Forma Net Revenue to Net Revenue: Pro Forma Net Revenue 208,909 $ 188,106 $ 408,222 $ 369,215 $ Pro forma adjustment for revenue share post-IPO — 18,319 41,263 35,776 Net Revenue 208,909 $ 206,425 $ 449,485 $ 404,991 $ Reconciliation of Pro Forma Adjusted EBITDA and Segment Adjusted EBITDA to Net Income and Operating Income: Net income 51,477 $ 85,381 $ 164,005 $ 170,448 $ Pro forma adjustment for revenue share post-IPO — (18,319) (41,263) (35,776) Interest and investment income, net (21) (94) (241) (318) Income tax expense 14,284 2,166 15,048 4,683 Depreciation and amortization 9,198 6,619 17,556 13,009 Amortization of purchased intangible assets 755 384 1,356 769 Pro Forma EBITDA 75,693 76,137 156,461 152,815 Stock-based compensation 6,494 — 6,819 — Acquisition related expenses 177 — 319 — Strategic and financial restructuring expenses 1,041 1,364 2,881 1,918 Gain on disposal of assets — — (4) — Pro Forma Adjusted EBITDA 83,405 $ 77,501 $ 166,476 $ 154,733 $ Pro Forma Adjusted EBITDA 83,405 $ 77,501 $ 166,476 $ 154,733 $ Depreciation and amortization (9,198) (6,619) (17,556) (13,009) Amortization of purchased intangible assets (755) (384) (1,356) (769) Stock-based compensation (6,494) — (6,819) — Acquisition related expenses (177) — (319) — Strategic and financial restructuring expenses (1,041) (1,364) (2,881) (1,918) Equity in net income of unconsolidated affiliates (4,491) (3,396) (8,605) (6,177) 61,249 65,738 128,940 132,860 Pro forma adjustment for revenue share post-IPO — 18,319 41,263 35,776 Operating income 61,249 $ 84,057 $ 170,203 $ 168,636 $ — $ — $ — $ — $ Reconciliation of Non-GAAP Adjusted Fully Distributed Net Income: Non-GAAP Adjusted Fully Distributed Net Income (pro forma): Net income attributable to shareholders 6,404 $ 1,991 $ 5,928 $ 3,946 $ Pro forma adjustment for revenue share post-IPO — (18,319) (41,263) (35,776) Income tax expense 14,284 2,166 15,048 4,683 Stock-based compensation 6,494 — 6,819 — Acquisition related expenses 177 — 319 — Strategic and financial restructuring expenses 1,041 1,364 2,881 1,918 Net income attributable to noncontrolling interest in Premier LP 44,916 83,784 158,130 167,201 Non-GAAP adjusted fully distributed income before income taxes 73,316 70,986 147,862 141,972 Income tax expense on fully distributed income before income taxes 30,060 29,104 60,623 58,209 Non-GAAP adjusted fully distributed net income (pro forma) 43,256 $ 41,882 $ 87,239 $ 83,763 $ * Note that actual results are presented for the three months ended December 31, 2013 Three Months Ended December 31, Six Months Ended December 31, (Unaudited) (In thousands) |


