Attached files
| file | filename |
|---|---|
| 8-K - 8-K - Knowles Corp | d677910d8k.htm |
 Knowles:
The Acoustics Pioneer
February 2014
Exhibit 99.1 |
| Cautionary Statements
2
A number of forward-looking statements are included in this presentation,
including 1Q14 projections and mid-term targets. Forward-looking
statements are any statements that are not historical facts. The words
“believe,” “project,”
“plan,”
“potential,”
“will,”
“target,”
and similar
expressions, among others, generally identify forward-looking statements. These
forward-looking statements are based on the current plans and
expectations of Knowles and are expressed in good faith and believed to have
a reasonable basis, but there can be no assurance that such plans or
expectations will be achieved. Because forward-looking statements involve risks and
uncertainties, Knowles’
actual results could differ materially from those projected, anticipated or
implied in these statements. Factors that could cause actual results or events to
differ materially from those anticipated include the matters described under
the sections entitled “Risk Factors” and “Management’s
Discussion and Analysis of Financial Condition and Results of Operations”
in
Knowles’
information statement filed as an exhibit to its Form 10 with the SEC and available
at www.knowles.com.
The financial data included in this presentation for the quarter
and year ended December 31, 2013
are preliminary and unaudited and subject to, among others, completion of financial
closing procedures, audit and other adjustments. The content of this
presentation contains time-sensitive information that speaks only as of
the date of this presentation. Knowles will not be reviewing or updating the
material that is contained herein, except as required by applicable law. If
any portion of this presentation is retransmitted or accessed at a later
date, the information contained herein may be outdated.
|
| Non-GAAP Disclaimer
3
In addition to the GAAP financial measures included in this presentation, Knowles
has presented certain non-GAAP financial measures. Knowles uses
non-GAAP measures as supplements to its GAAP results of operations in
evaluating certain aspects of its business, and its Board of Directors and
executive management team focus on non-GAAP items as key measures of
Knowles’ performance for business planning purposes. These measures
assist Knowles in comparing its performance between various reporting
periods on a consistent basis, as these measures remove from operating
results the impact of items that, in Knowles’
opinion, do not reflect its core operating performance. Knowles
believes
that its presentation of non-GAAP information is useful because it provides
investors and securities analysts with the same information that Knowles
uses internally for purposes of assessing its core operating
performance. For a reconciliation of these non-GAAP measures to
the most directly related GAAP measure, please see the appendices hereto and
the reconciliation tables included in Knowles’ information statement
filed as an exhibit to its Form 10 with the SEC.
|
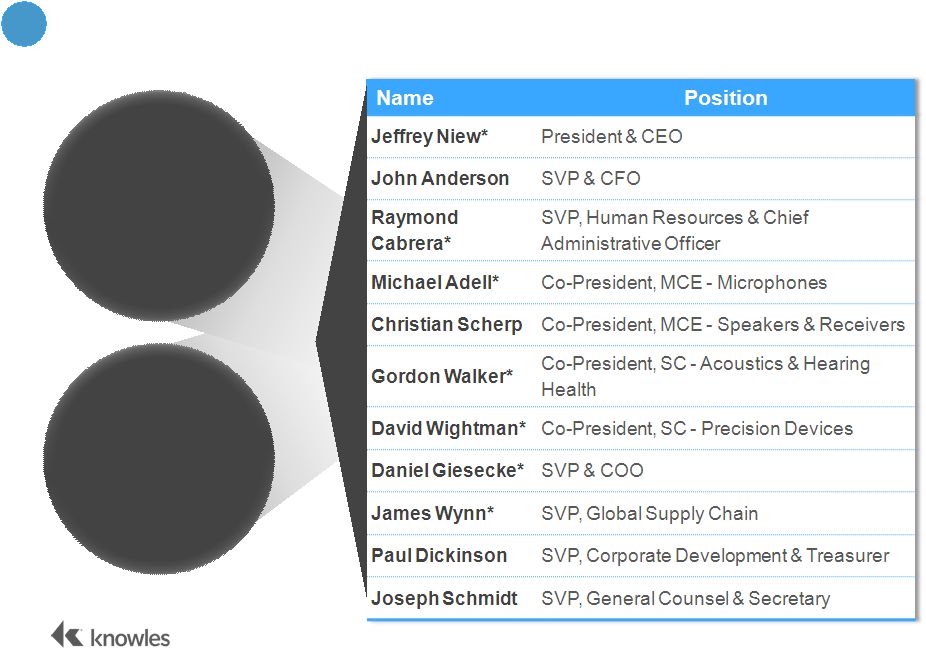
 John
Anderson Senior Vice President &
Chief Financial Officer
Introduction of Presenters
4
Jeffrey Niew
President &
Chief Executive Officer
Mobile Consumer Electronics
Specialty Components
Michael Adell
Co-President,
Microphones
Christian Scherp
Co-President, Speakers
& Receivers
Gordon Walker
Co-President,
Acoustics & Hearing
Health
David Wightman
Co-President,
Precision Devices |
| Discussion Agenda
5
I.
Knowles Highlights
II.
Specialty Components (SC)
III.
Mobile Consumer Electronics (MCE)
IV.
Financial Overview
V.
Conclusion / Q&A
VI.
Lunch / Demos
5 |
 CULTURE OF INNOVATION
Knowles: Who We Are
GLOBAL
SCALE
TOP
TIER
CUSTOMER
ENGAGEMENT
6
units
patents |
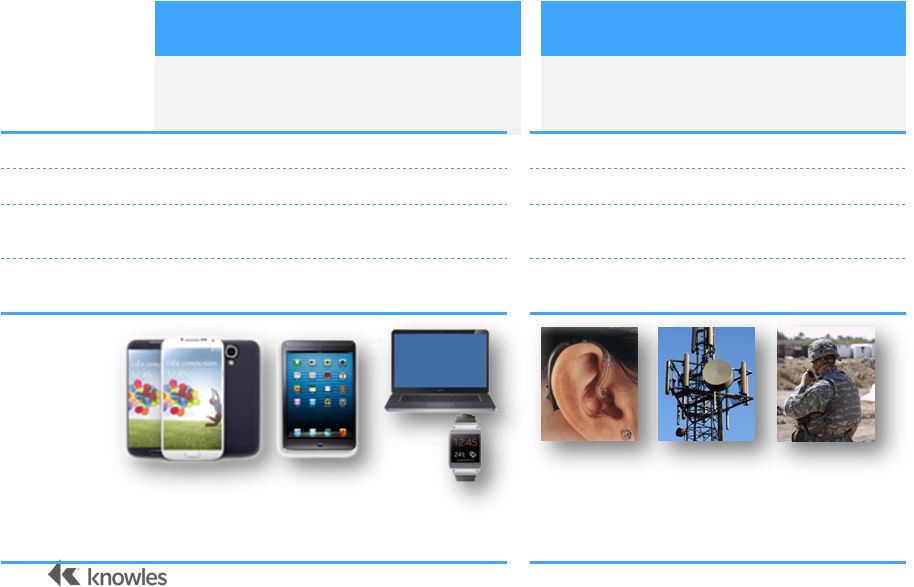 Knowles: What We Do
Mobile Consumer Electronics
Mobile Consumer Electronics
Specialty Components
Specialty Components
Provides the acoustic backbone to
smartphones, tablets, headsets, laptops and
other electronic products
Includes acoustic solutions for hearing aids,
and oscillators and capacitors used in a
broad range of electronic equipment
2013 REVENUE
$778mm
$437mm
% total
64%
36%
2013
ADJ. EBITDA*
$246mm
$106mm
Adj. EBITDA
margin*
32%
24%
Mobile consumer electronics
Medical
Telecommunications
Technology
Infrastructure Military / Aerospace Industrial
Markets 7
*Segment information. Adj. EBITDA is defined as earnings before income taxes plus
(i) depreciation and amortization expense and (ii) interest expense,
excluding restructuring costs, stock-based compensation, and other items. See
Appendices for non-GAAP to GAAP reconciliations. |
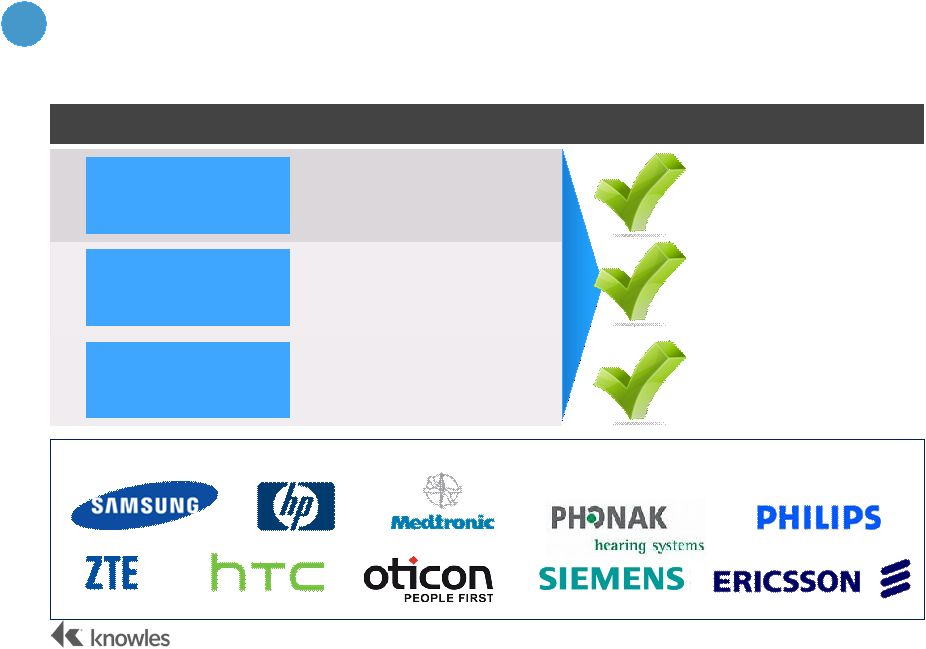
 Knowles: Why We Win
8
CULTURE OF INNOVATION
PIONEERING ACOUSTICS EXPERTISE ENTRENCHED CUSTOMER RELATIONSHIPS PROPRIETARY MANUFACTURING PROCESSES DIFFERENTIATED
PRODUCTS |
 Market-Leading Acoustic Supplier with Strong
Engineering Relationships
Key Investment Highlights
9
1
2
3
4
5
Attractive End-Markets
Innovative Technology Drives Differentiated
Solutions
Proprietary Operational Capabilities with Margin
Expansion Potential
Experienced Management with Proven Track
Record |
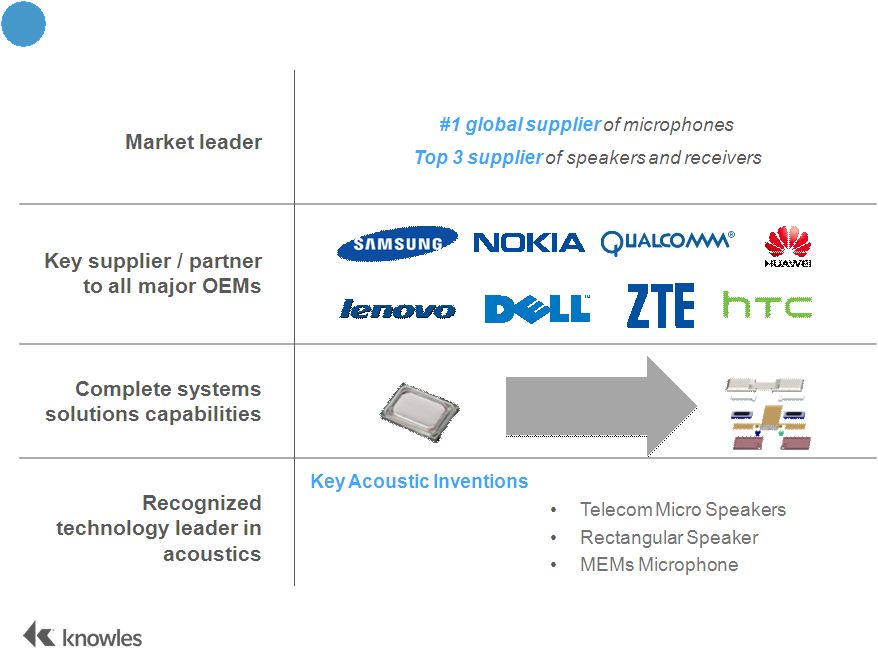
 Market Leading Acoustics Supplier,
Strong
Engineering Relationships
10
MARKET
LEADERSHIP
Strong Financial
Performance
Acoustic Content
Growth
Product Development
Leadership and
Operational Excellence
Hearing Aid
Solutions
#1 Global Supplier
Top 3 Supplier
#1 Global Supplier
1
Microphones
Speakers /
Receivers
CUSTOMERS |
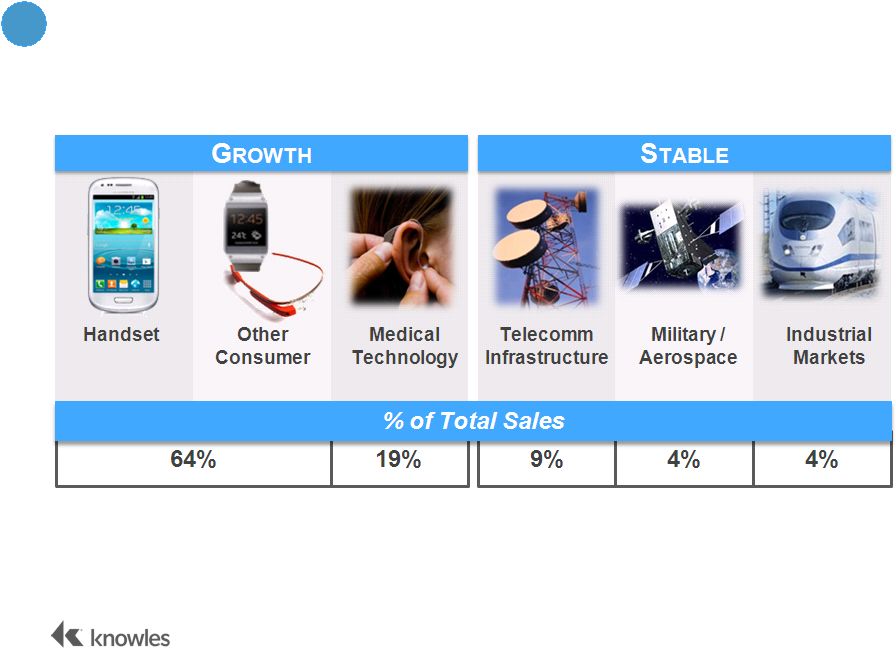 Attractive Markets
11
2
Note: % of total sales based 2013 information. |
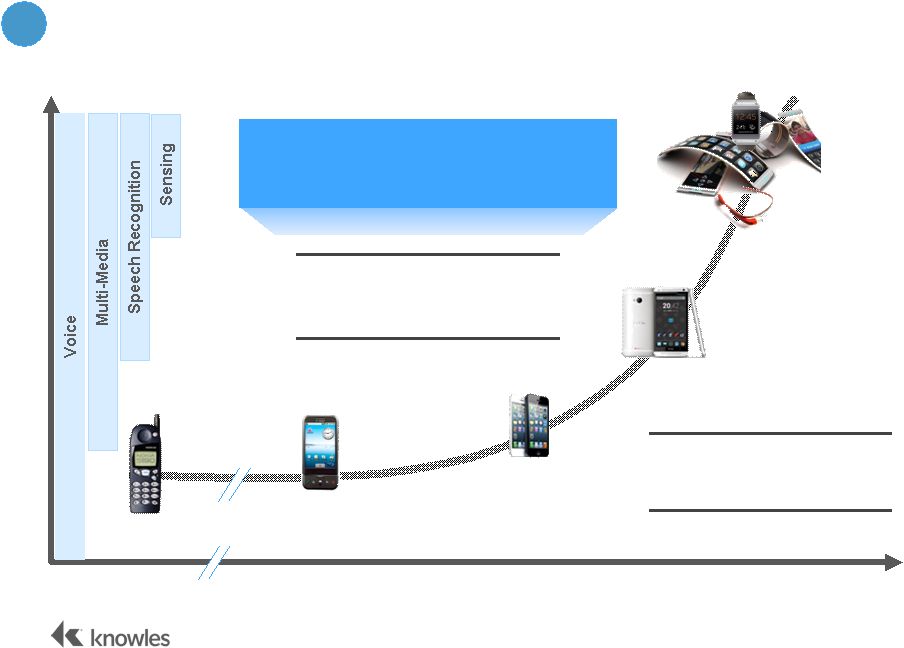  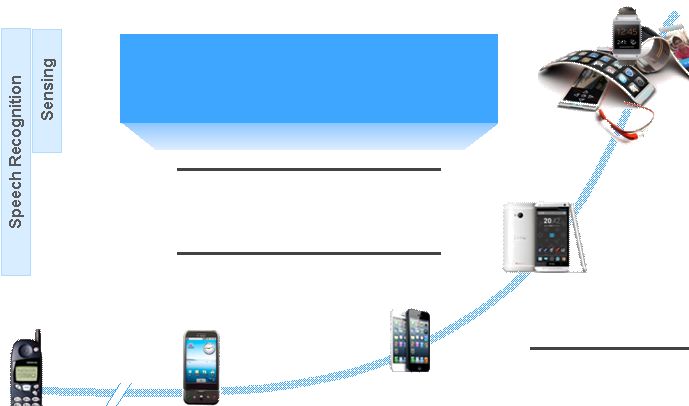 Innovative Technology
Drives Differentiated Solutions 12
2000
2015+
2010
Pace of acoustic features
growing exponentially
in recent years
Microphones
Speakers & Receivers
High Performance
Solutions
Integration
Embedded Software +
Hardware Modules
Knowles Acoustic
Subsystems enable smart
Knowles’
technology stems
from 500+ patents
Audio $ Content
3
audio optimization
device |
 Global Operational Capabilities with Margin
Expansion Potential
13
18
18
11
11
4
More efficient manufacturing footprint
Lower cost geographies
Focus on productivity and low cost sourcing
TODAY
MID TERM
1: Exclusive of costs associated with restructuring. Restructuring of 4 of the 7
facilities has been announced and commenced. Annualized cost savings from
restructuring costs incurred in 2012 & 2013 are expected to be approximately $19 million of the
targeted amount.
Targeting $40mm
- $50mm of Annualized Cost Savings¹ |
 Experienced and Successful Team
14
15+ yrs
Average Years of
Industry
Experience
>10 yrs*
7 Team Members with
>10 Years
Knowles Experience
5 |
 Knowles: Investment Thesis
15
INVESTMENT
HIGHLIGHTS
Calendar year ending December
Goal to deliver strong operating margin leverage & enhanced shareholder
value Profitable revenue growth
Well positioned in high
growth mobile consumer
electronics business
Stable revenues and cash
flow from specialty
components
Realize cost efficiencies
through operational
improvements
STRONG AND
PROFITABLE
REVENUE
GROWTH
Note:
EBITDA
is
defined
as
earnings
before
income
taxes
plus
(i)
depreciation
and
amortization
expense
and
(ii)
interest
expense.
See
Form
10
and
appendices for non-GAAP to GAAP reconciliations.
|
 Knowles Specialty
Components (SC)
16
Gordon Walker
Co-President, Acoustics &
Hearing Health |
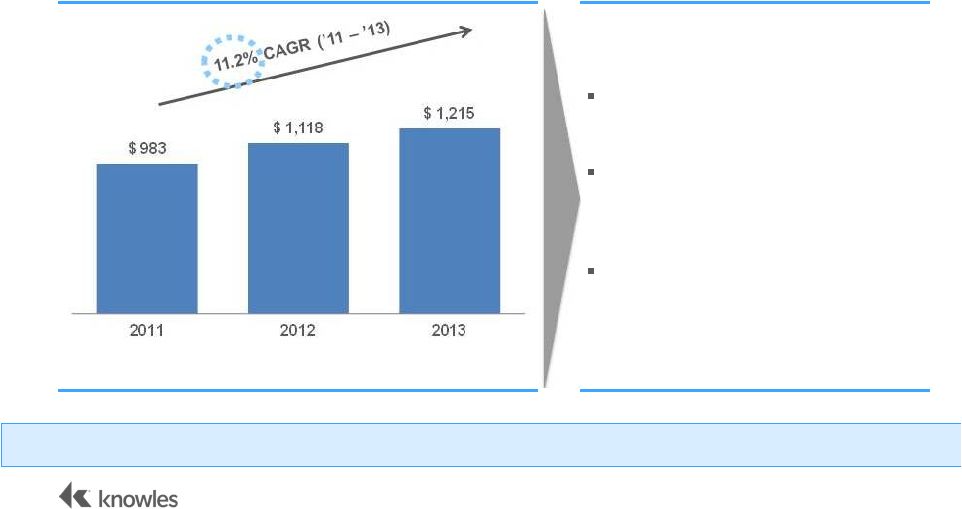
 Specialty Components Snapshot
17
KEY
PRODUCTS
TOTAL REVENUE
($MM) AND
% CHANGE
BUSINESS DYNAMICS
ADJ.
EBITDA
($MM)
1
AND
%
MARGIN
Microphones /
Receivers
Capacitors /
Oscillators
$473
$448
$437
Stable markets
Customer intimacy
Attractive margin and cash flow dynamics
Adds stability and diversity to Knowles portfolio
1
Adj.
EBITDA
is
defined
as
earnings
before
income
taxes
plus
(i)
depreciation
and
amortization
expense
and
(ii)
interest
expense,
excluding
restructuring
costs, stock-based compensation, and acquisition transaction costs. See
Appendices for non-GAAP to GAAP reconciliations.
ACOUSTIC
PRODUCTS
PRECISION
DEVICES |
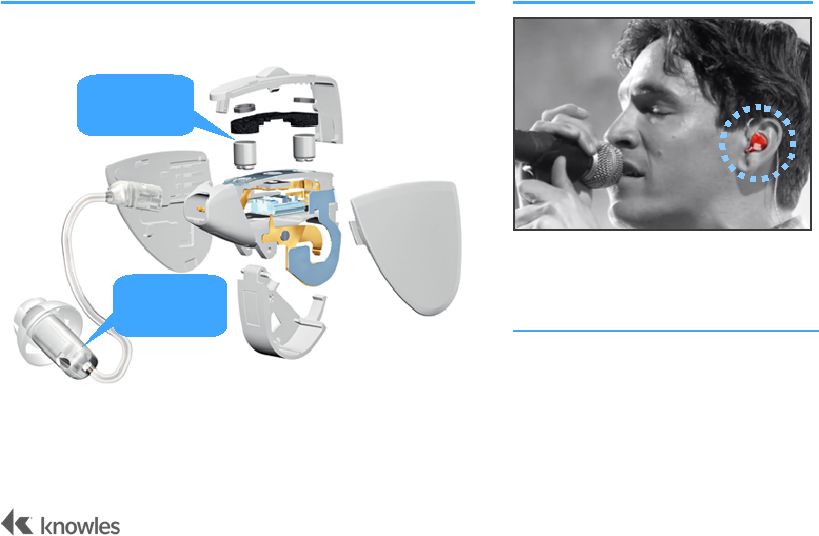 Acoustic Products: What We Do
HEARING HEALTH
PREMIUM AUDIO
“In Ear Monitors”
for musicians
and
enthusiasts
Typically >$100 retail
(up to $1,000)
Receiver content:
1 -
8 receivers per ear
18
Source: Knowles Management
Hearing Aid
Microphones
Hearing Aid
Receiver |
 Acoustic Products: Key Themes
19
1
2
3
Leader in Stable, Resilient Market with
Favorable Macro Trends
Trusted Partner and Technology Leader
Strong Margin Expansion Opportunities |
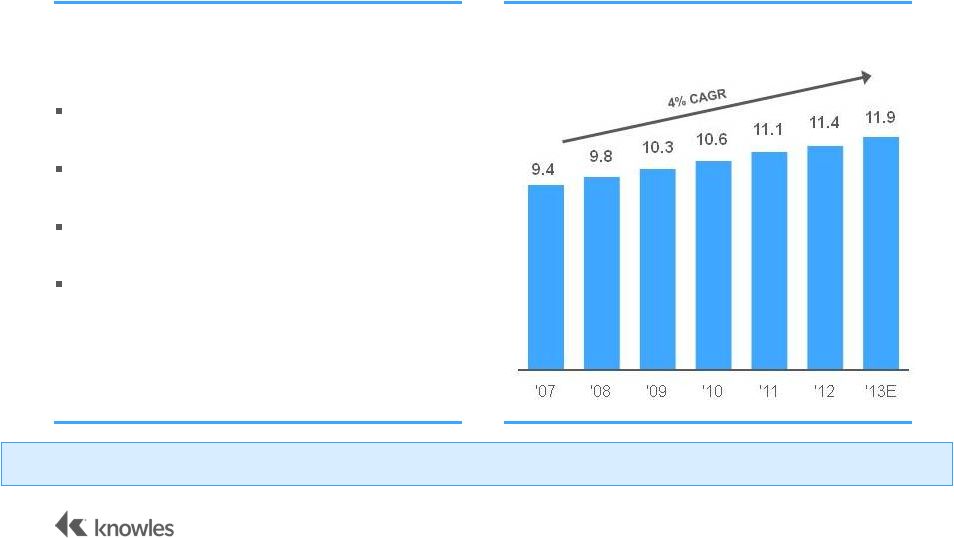 Market Overview –
Hearing Health Acoustics
20
ATTRACTIVE MARKET
DYNAMICS STABILITY
OF HEARING MARKET
Stable market
Limited Competition
Market Leader
Strong market position with all
hearing-aid manufacturers (OEMs)
Worldwide Hearing Units Sold (Millions of units)
Source: William Demant “Trends and Directions in the Hearing Healthcare
Market”, Knowles Management Market
Leader
for
>60
Years
in
an
Attractive,
Stable
Market
with
Favorable
Macro
Trends |
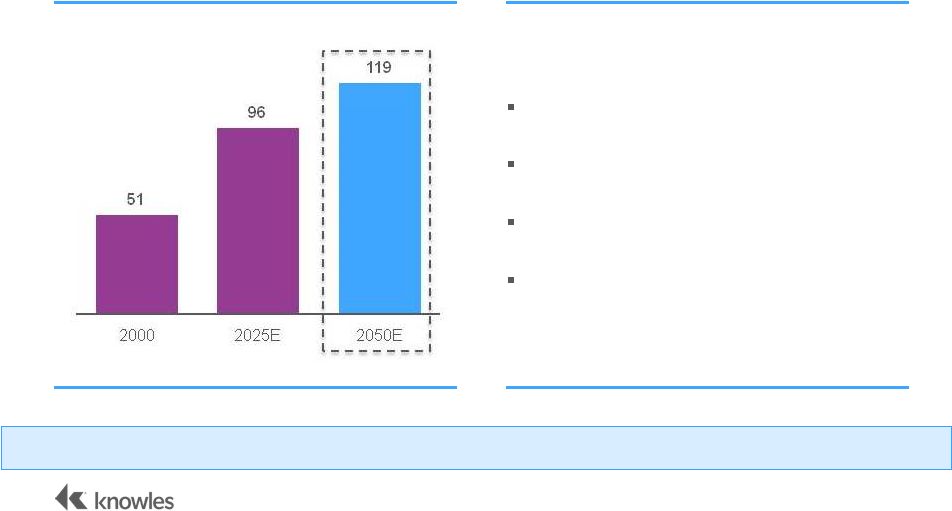 Mega
Trends: Hearing Health 21
Rapidly aging population
Longer life expectancy
Increasingly affluent
Improved distribution infrastructure
NORTH AMERICA AGING
POPULATION
EMERGING
MARKETS
Aged +60 (mm of people in North America)
Source: United Nations, DESA (Population Division)
Population of Adults Aged 60+ Expected to Increase from ~600 million to 2 billion in
2050 |
 Acoustic Products: Why We Win
22
Leading Product Portfolio
1
2
3
4
Critical Role in Customers’
Products
Collaborative Engineering and Development
Relationships
Most Reliable Partner in the Industry |
 Partnered with lead customer in 2004
Became principal supplier to RIC segment from
inception
Today over 50% of world market
is RIC
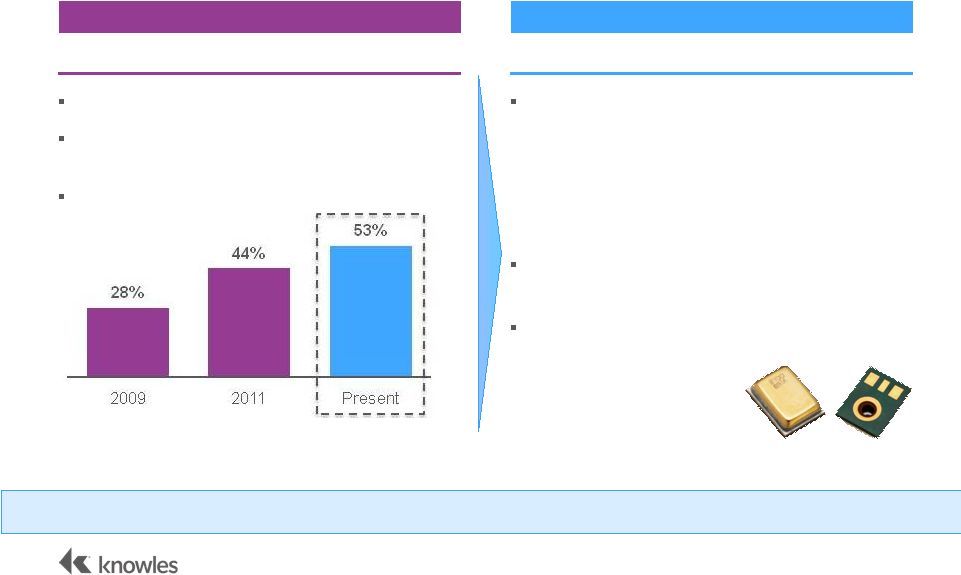
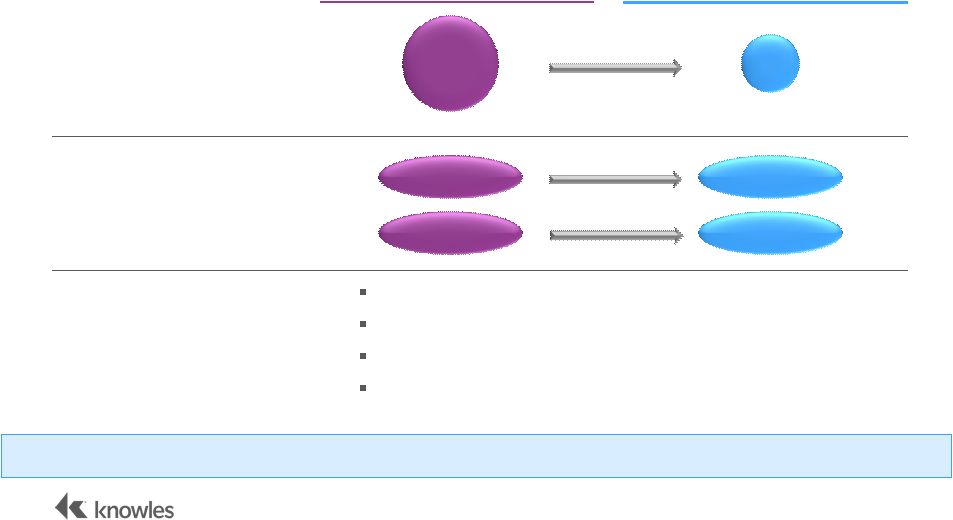
Where We Are Going
23
Present
Future
Product-Technology leadership, MEMs solves
two problems
for OEMs:
1.
Hearing Instruments require greater stability,
consistency
2.
High labor costs from manual assembly
MEMs provides a highly scalable
solution with
superior acoustics
Recent design wins
with 3 of the top 6 hearing
aid OEMs
RECEIVER-IN
-CANAL
INSTRUMENTS
MEMS
MICROPHONES
RIC % of Total U.S. Market
Source: US Hearing Industries Association
Knowles Position in MEMs Microphones Demonstrates Technological Leadership
|
 Low-Cost Manufacturing, Expanding Margins
24
…
LED TO
RELOCATION OF
SPEAKER & RECEIVER
MANUFACTURING Announced August 2013
First Tranche January 2014
To Be Completed Mid-2015
Suzhou, China
Cebu,
Philippines
Estimated ~$10mm in Savings per Year
CONTINUED INFLATION
AND
FX PRESSURE IN
CHINA… |
 Acoustic Products: Key Takeaways
25
1
2
3
Profitable Leader in a Range of Attractive End
Markets
Product and Technology Leader with
Close Customer Relationship
Significant Margin Expansion Opportunity |
 Knowles Specialty
Components (SC)
26
David Wightman
Co-President
Precision Devices |
 Precision Devices Snapshot
27
KEY PRODUCTS
Crystal Oscillators
SAW Filters
Thin Film Filters
Single Layer Capacitors
Multi-Layer Capacitors
High Reliability Capacitors
Precision Devices –
Chosen by Engineers |
 Precision Devices: Key Themes
28
Why We Win
1
2
3
4
5
Attractive Dynamics in Our Chosen Markets
Selected Market Segments
Innovation to Solve Customer Problems
Margin Expansion Opportunity |
 Precision Devices: Why We Win
29
Customer
Intimacy
Product
Innovation
Market Segment
Focus
Operational
Excellence |
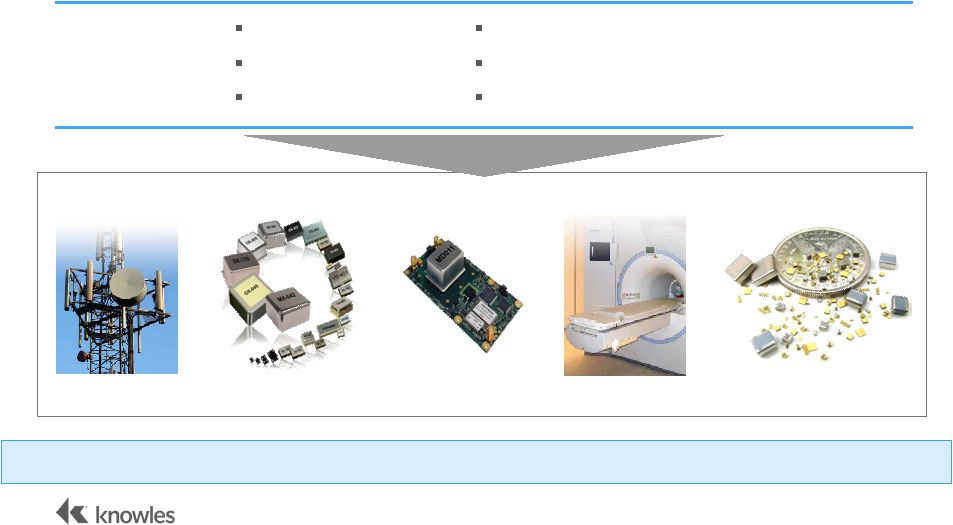
 Attractive Dynamics in Our Chosen Markets
30
Military and Space
Smart Phone Technology advancements pushes global
military communications
Telecoms
Small Cell deployments supporting Data Traffic
Cloud Computing supporting large data centers
Medical
Medical equipment for an aging population
Increasing standards of care in emerging markets
Industrial
Test and Measurement equipment for next generation
networks
Increased applications in harsh operating environments
Technology Driven Solutions to
Meet Customer Specific Demands |
 Focused on Specific, Mission-Critical Market
Segments
31
Medical
Military and
Aerospace
Telecom
Industrial
Opportunity for
Portfolio
Expansion via
Low Cost
Manufacturing
Consumer Electronics
Knowles Focuses on Mission Critical Segments where
Competitive Differentiation Leads to Strong Margins
|
 Knowles Recipe for Success –
Capacitor Innovation
32
IDENTIFY THE
PROBLEM
MRI Case Study
Material development of ceramic and
electrode systems
New plating technique
New tests for high energy pulse requirements
Soldering techniques for high volume
assembly
Requires high-energy, non-magnetic
capacitors capable of withstanding
high energy pulses
CREATE A
SOLUTION
Primary source for the full range of
non-magnetic capacitors as Knowles
Capacitors
can now provide a “one
source”
solution
ACHIEVE A
BENEFICIAL OUTCOME
Knowles Identifies the Problem, Creates a Solution, and Becomes a Preferred
Source |
 Margin Expansion Opportunity
33
Reduction in
Footprint
Direct Labor
Savings
Operational
Excellence /
SG&A
Transition from four
capacitor units into
one global operation
Relocating UK
manufacturing to
Suzhou, China
Overhead and SG&A
reduction
opportunities
Positioned for $9mm of Annualized Savings
|
 Precision Devices: Key Takeaways
34
Profitable Leader in a Diversity of Carefully
Selected End Markets
1
2
3
Positioned to Build-On Knowles Attributes:
Customer Intimacy, Product Leadership,
Relationship with Engineering Communities
Significant Margin Expansion Opportunity |
 Mobile Consumer
Electronics (MCE)
35
Christian Scherp
Co-President,
Speakers & Receivers
Michael Adell
Co-President,
Microphones |
 Speakers / Receivers
Mobile Consumer Electronics Snapshot
36
Microphones
TOTAL
REVENUE
($MM)¹
AND
%
GROWTH
ADJ. EBITDA ($MM)²
AND
% MARGIN
KEY
PRODUCTS
STRONG FINANCIAL
PROFILE ¹
2011 includes a partial year of Sound Solutions revenue
²
Adj.
EBITDA
is
defined
as
earnings
before
income
taxes
plus
(i)
depreciation
and
amortization
expense
and
(ii)
interest
expense,
excluding
restructuring
costs,
stock-based compensation, and acquisition transaction costs. See Appendices for
non-GAAP to GAAP reconciliations. Profitable Business with Attractive
Growth Opportunities |
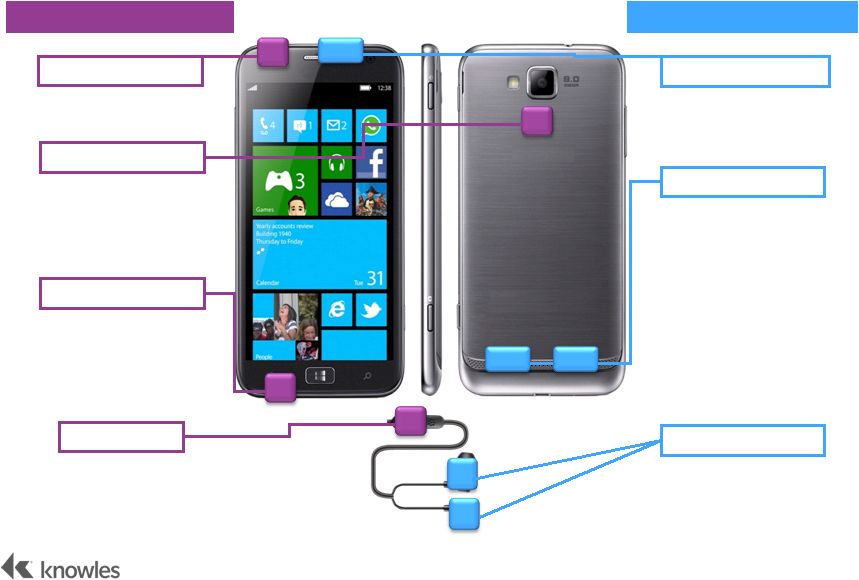 Typical Smartphone Acoustics Applications
37
Main Microphone
High Definition
Loud Speaker
Ear-Bud Speakers
Hands-Free
Reduces background
noise
Improves Video
Sound Recording
Calls / Voice
Recognition
Noise Canceling
Microphones
Clear sounds
High Definition Media
Playback
High Performance
Speakers
Microphones
Speakers / Receivers
Noise Cancelling
Voice Call Receiver |
 MCE:
Key Themes 38
Attractive Growth Markets
1
2
3
4
5
Market Leadership
Commitment to Innovation
Acoustic Content Growth
Transition to Integrated Audio Solutions |
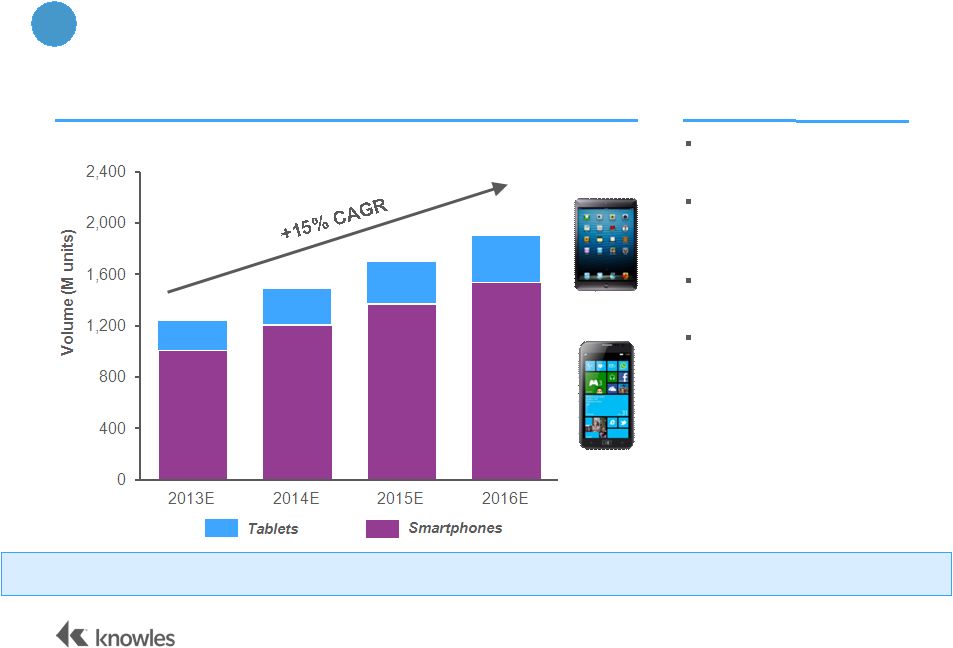 Attractive End-Markets
39
SMARTPHONES AND TABLETS VOLUME Overall “total”
market
growing at ~6% CAGR
Smartphone market
slowing to low double
digit growth
Notebook declines
offset by Tablet
Knowles is well
positioned in growth
markets
HIGHLIGHTS
1
Focus Markets Continue to Grow
Source: IDC (Nov. 2013), Management Projections |
   Attractive Growth Markets –
Evolving Market Demands
40
Time
Traditional Communication
Music, movies and games
Augmented Listening
Speech recognition
1
Market Demands Driving Growth |
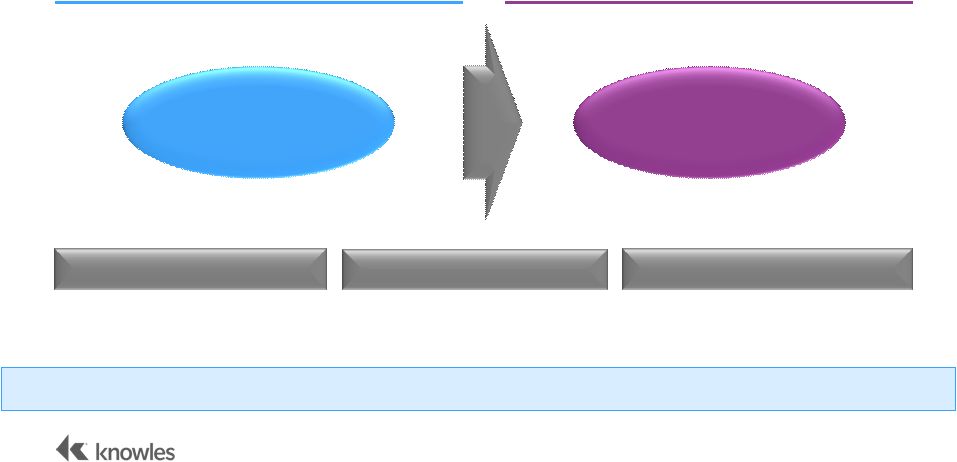
   Market Leadership
41
Shift towards
Integrated
Solutions
Shift towards
Integrated
Solutions
Standalone Components
System Solution
2 |
 Competitive Landscape
42
2
Knowles’
unique combination of application knowledge, silicon design, and proprietary
manufacturing Source: Knowles Management |
 Commitment to Innovation
43
3
Knowles is Constantly Innovating Across its Entire Business
|
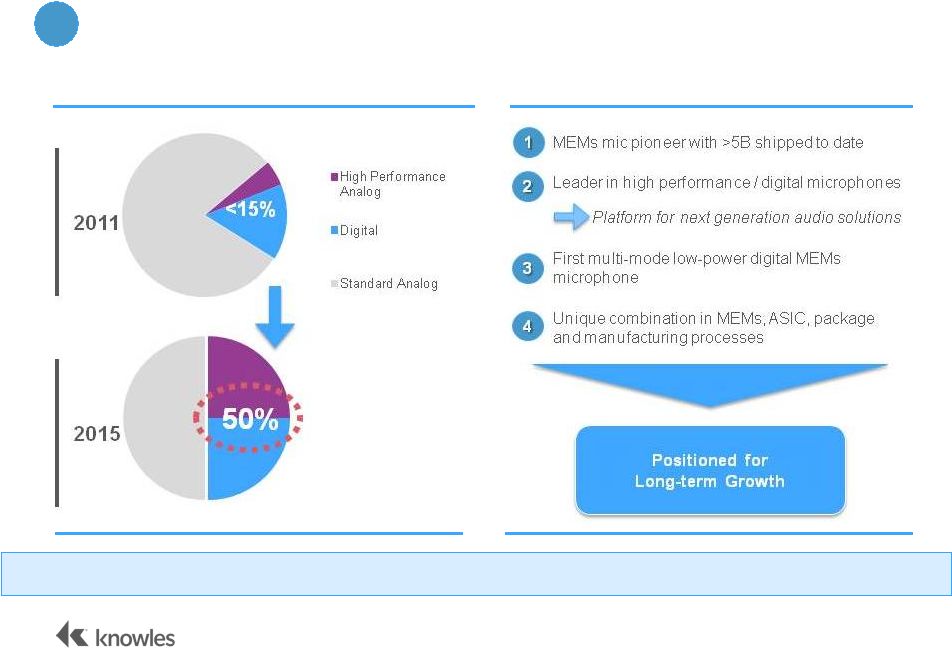 Commitment to Innovation –
Microphones
44
TREND
TOWARD
HIGHER
PERFORMANCE
MICS
KNOWLES
COMMITMENT TO
INNOVATION
Source: Knowles Management
3
Strategically Positioned to Capture Trend to Next Generation Microphone
Solutions |
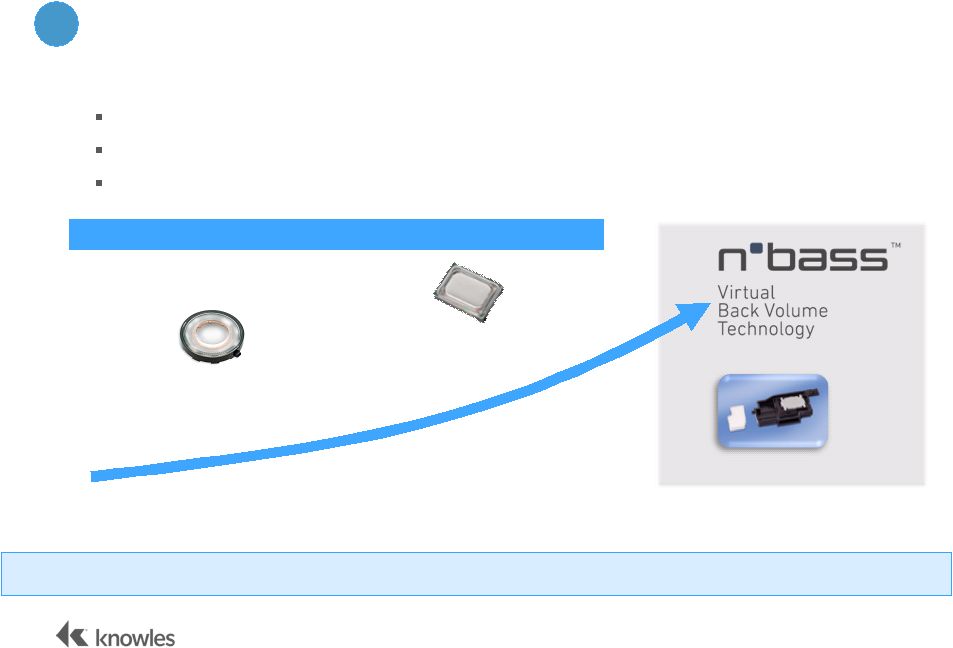 Commitment to Innovation –
Speakers and Receivers
45
The best “acoustic brain”
in the industry with strong pre-development capabilities
Unique competence for ultra-thin future speaker solutions
Pushing beyond acoustics to include software, silicon, sensors and more
1997
2005
2013
World’s first Telecom
Micro-speaker
World’s first Rectangular
Micro-speaker
Over 6.6 billion pieces sold
3
Strategic Investment in R&D Drives Knowles Leading-edge Audio
Solutions |
 Acoustic Content Growth
46
$1 -
2
$2 -
3
$3 -
5
Receiver
Dual Mics
Speaker
Receiver
Single Mic
Speaker
Receiver
Multi Mics
Integrated Speaker
Box/Antenna
Addressable
Content
2008
2012
FUTURE
Source: Knowles Management
4
Opportunities to Increase Content in Each Successive Generation
|
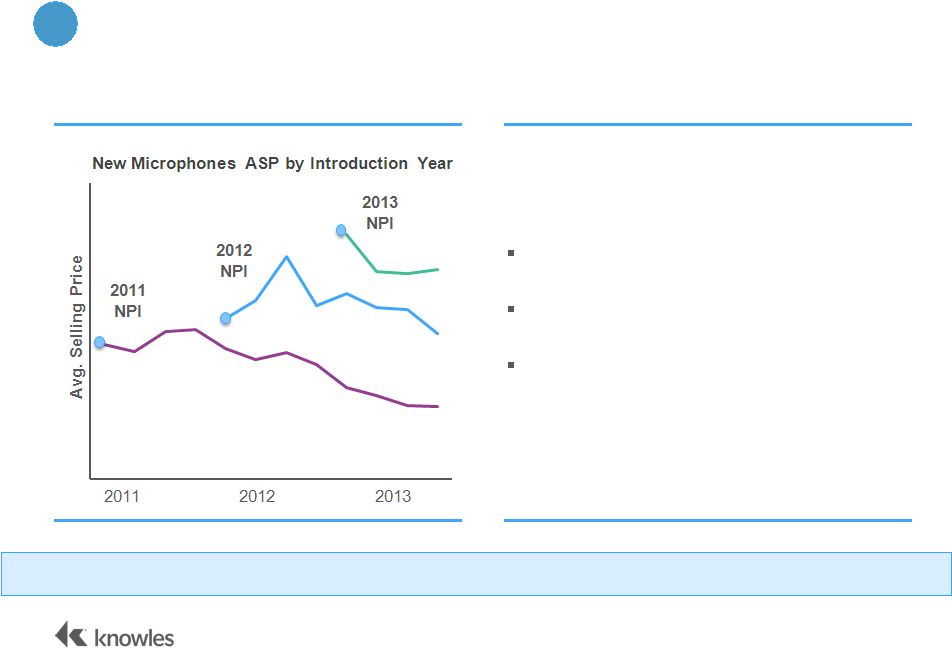 Acoustic Content Growth
47
WITH
EACH NEW PRODUCT,
SELLING PRICE RISES STRONG
AND
INNOVATIVE
INFRASTRUCTURE
Patented microphone technology
In-house ASIC, MEMs, and packaging
Robust product pipeline driven by new
use-cases
NPI = New Product Introduction
Source: Knowles Management
4
Product Innovation Resets ASPs |
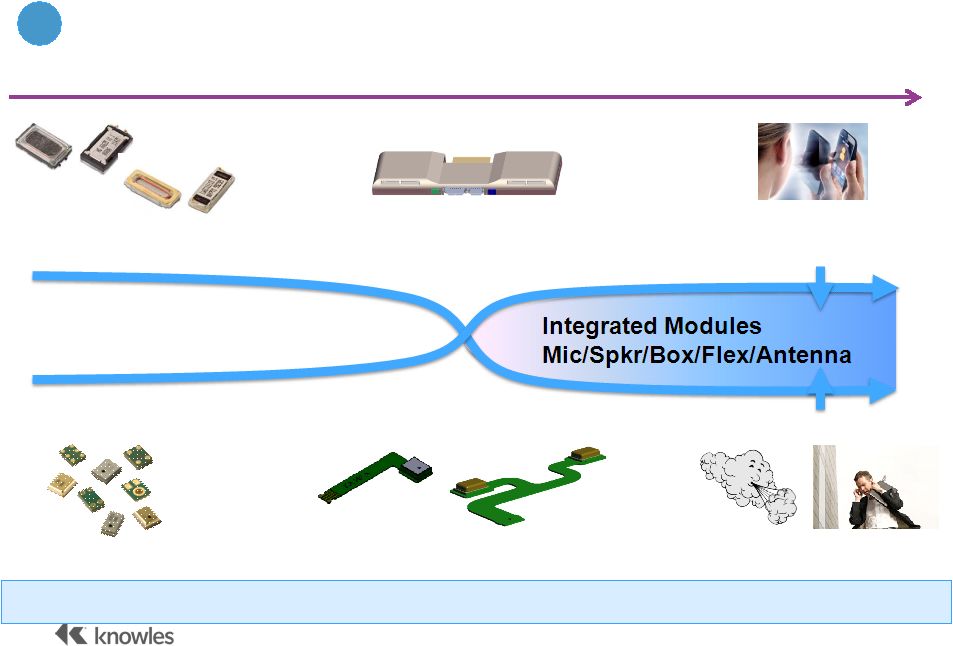 Microphone
Speaker/Receiver
Integrated Audio
Components
Speaker
Modules
(Multi) Mic on Flex
Intelligent Audio Smart Mic
Intelligent Audio
Smart Speaker
Intelligent Audio
5
Capturing Value through Audio Integration
$
$$
$$$
Integrated Solutions Model –
Future Trends |
 Intelligent Audio System
Integrated Speaker Box
Concert
Recording
AudioZoom
Stereo
Capture/Playback
2mic Noise
Reduction
5.1 Surround Sound
Capture / Playback
Wind Noise
Reduction
Gesture
Recognition
Active Noise
Cancellation
Playback
Optimization
Hardware / Software System
Future Knowles Products
Product
Platform
Intelligent
Solutions
Integrated Solutions Model –
Future Trends
49
5
Platform for Pioneering Intelligent Acoustic Applications
|
 MCE:
Key Takeaways 50
Attractive Growth Markets
Market Leadership
Commitment to Innovation
Acoustic Content Growth
Transition to Integrated Audio Solutions
1
2
3
4
5 |
 Financial Overview
51
John Anderson
Senior Vice
President &
Chief Financial
Officer |
 Financial Highlights
52
Earnings Growth Through Robust Revenue Improvement and Margin Expansion
Significant
market and
content
growth
in
Mobile
Consumer
Strong track
record of
cash flow
generation
Margin
expansion
opportunity
to drive
earnings
growth
Stable
revenue
and
cash flow
from
Specialty
Components
Disciplined
approach to
capital
allocation |
 Track Record of Consistent Revenue Growth
53
REVENUE ($MM)
KEY
GROWTH DRIVERS
Strong position in growing
smartphone and tablet market
Content growth through multi-mic
adoption and integrated acoustic
systems
Hearing aid penetration in aging
populations and developing markets
Revenue Expansion Driven by Smartphone Market Expansion and Content Growth
Note: 2011 includes a partial year of Sound Solutions revenue
|
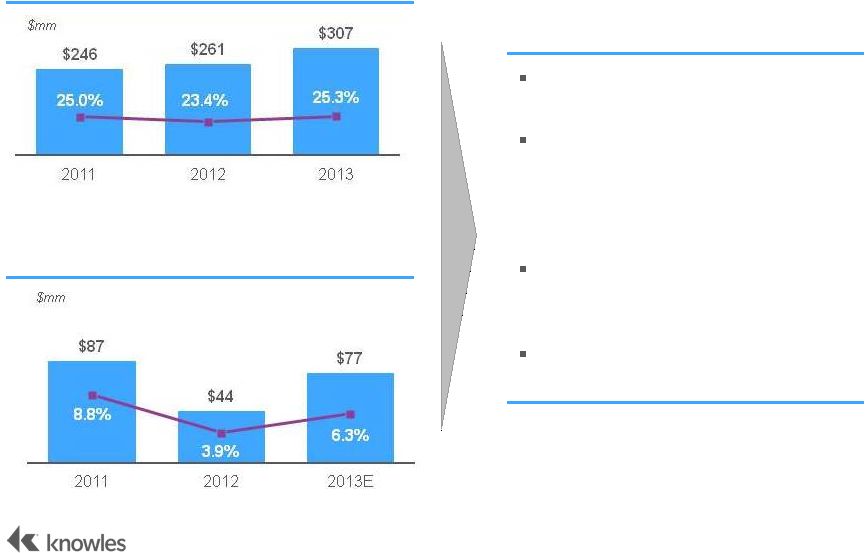 Strong Margins and Cash Flow Generation
54
ADJ.
EBITDA (AND
% MARGIN)¹
KEY
DRIVERS
Higher volumes and scale efficiencies
2013 Adj. EBITDA margin expansion
due to increased ASP on new
products and improved operating
leverage
Productivity and restructuring actions
beginning to lower costs
Significant capital spent on capacity
expansion and facility restructuring
FREE CASH FLOW
(AND % OF
REVENUES)²
¹
Adj.
EBITDA
is
defined
as
earnings
before
income
taxes
plus
(i)
depreciation
and
amortization
expense
and
(ii)
interest
expense,
excluding
restructuring costs, stock-based compensation, and acquisition transaction
costs. See Appendix for GAAP to Non-GAAP reconciliations. ²
Free cash flow is calculated as cash flow provided by operating activities less
capital expenditures. |
 Margin Expansion Strategy
55
TODAY
MID
TERM
Footprint
Consolidation
Movement to
Lower-Cost
Regions
Operational
Excellence
Low cost materials sourcing
Lean focus / productivity enhancements
Further back office streamlining
Improved operating leverage
18
11
Suzhou
UK
Cebu
Suzhou
Expect to Drive $40mm -
$50mm Annualized Cost Savings
1: Exclusive of costs associated with restructuring. Restructuring of 4 of the 7
facilities has been announced and commenced. Annualized cost savings from
costs incurred in 2012 & 2013 are expected to be approximately $19 million of the expected
amount.
1 |
 Efficient Capital Structure and Capital Allocation
56
Organic growth investments
Continued funding of research and
development
Productivity improvements
Expanding manufacturing footprint in cost-
competitive regions
Bolt-on acquisitions
Evaluate return of capital (mid-term)
STRONG BALANCE SHEET
AT SPIN
CAPITAL ALLOCATION
PRIORITIES (US$ in millions)
At Spin
Cash
$40
Total Debt
$400
Net Debt
$360
Total Debt / Adj. EBITDA¹
1.3x
Net Debt / Adj. EBITDA¹
1.2x
Intent to maintain
Investment Grade-like credit metrics
Focused on Efficient Capital Allocation to Drive Shareholder Value
1: Adj. EBITDA is defined as earnings before income taxes plus (i) depreciation and
amortization expense and (ii) interest expense, excluding restructuring
costs, stock-based compensation, and other items. See Appendix for GAAP
to Non-GAAP reconciliations. |
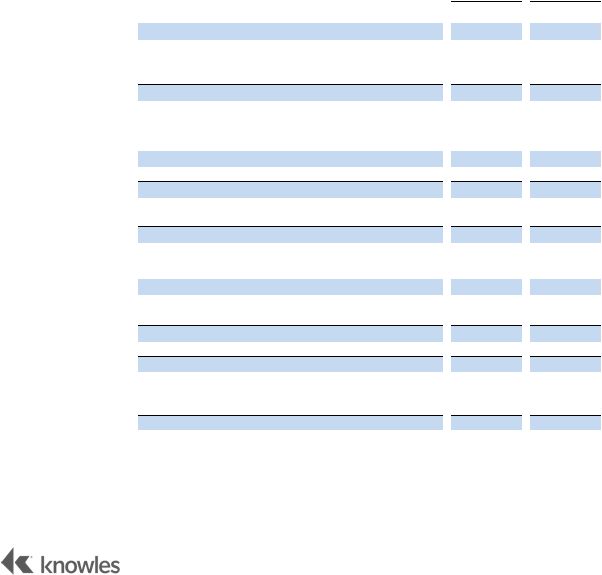
 2013
Historical Data and Projections for Q1’14 (non-GAAP)
57
Note: See Appendices for GAAP to Non-GAAP reconciliations.
Q1’13
Q2’13
Q3’13
Q4’13
Q1’14E
Revenue ($M)
$276
$297
$312
$330
$260-265
Gross Profit ($M)
$97
$106
$122
$125
$88-91
Gross Profit Margin (%)
35.2%
35.7%
39.2%
37.9%
34.0-35.0%
Operating Profit ($M)
$39
$50
$69
$66
$31-33
Operating Margin (%)
14.2%
16.9%
22.1%
20.0%
12.0-13.0% |
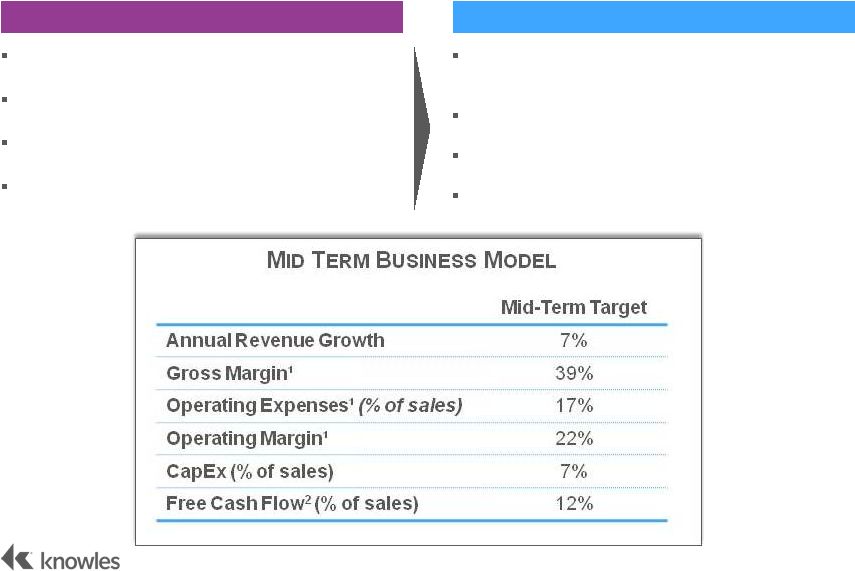 Where We Are
 Going
Mid Term Financial Model Targets
58
Increased market share in high growth, high
margin businesses
Expansion into adjacent markets
Additional customer penetration and content
Lower cost structure
Long-standing acoustic solutions market leader
Highly diversified products
Global footprint
Experienced management team
¹
Non-GAAP. See appendices for non-GAAP to GAAP reconciliations.
²
Free Cash Flow calculated as Operating Cash Flow less Capex.
|
 Knowles
Conclusion + Q&A |
 Key
Investment Highlights 60
Market-Leading Acoustic Supplier with Strong
Engineering Relationships
Attractive End-Markets
Innovative Technology Drives Differentiated
Solutions
Proprietary Operational Capabilities with Margin
Expansion Potential
Experienced Management with Proven Track
Records |
 Appendices
61 |
 62
KNOWLES CORPORATION
GAAP FINANCIAL MEASURES AND NON-GAAP FINANCIAL MEASURES
(1)
(unaudited, dollars in millions)
Q1
Q2
Q3
Q4
Total
Q1
Q2
Q3
Q4
Total
Revenue
276.2
$
296.7
$
311.6
$
330.3
$
1,214.8
$
261.1
$
260.7
$
299.6
$
296.6
$
1,118.0
$
Non-GAAP Gross profit
97.3
105.8
122.0
125.1
450.2
88.6
92.9
111.5
115.0
408.0
Non-GAAP Selling and administrative expenses
58.0
55.6
53.1
59.1
225.8
49.6
54.8
53.1
54.7
212.2
Non-GAAP Operating earnings
39.3
$
50.2
$
68.9
$
66.0
$
224.4
$
39.0
$
38.1
$
58.4
$
60.3
$
195.8
$
Notes:
2013
2012
(1) In addition to the GAAP financial measures included herein, Knowles has presented
certain non-GAAP financial measures. Knowles uses non-GAAP measures as supplements to its GAAP
results of operations in evaluating certain aspects of its business, and its Board of
Directors and executive management team focus on non-GAAP items as key measures of Knowles'
performance for business planning purposes. These measures assist Knowles in comparing
its performance between various reporting periods on a consistent basis, as these measures remove
from operating results the impact of items that, in Knowles' opinion, do not reflect its core
operating performance. Knowles believes that its presentation of non-GAAP financial measures is
useful because it provides investors and securities analysts with the same information that
Knowles uses internally for purposes of assessing its core operating performance. |
 63
KNOWLES CORPORATION
RECONCILIATION OF GAAP FINANCIAL MEASURES TO NON-GAAP FINANCIAL MEASURES
(unaudited, dollars in millions)
Q1
Q2
Q3
Q4
Total
Q1
Q2
Q3
Q4
Total
GAAP Gross Profit
94.9
$
100.1
$
117.9
$
118.6
$
431.5
$
88.6
$
92.9
$
111.5
$
114.0
$
407.0
$
Asset Impairment and Related Inventory Charges
-
-
0.4
1.7
2.1
-
-
-
-
-
Restructuring Charges
1.8
4.0
1.0
1.0
7.8
-
-
-
0.4
0.4
Production Transfers Costs
(1)
0.6
1.7
2.7
3.8
8.8
-
-
-
0.6
0.6
Non-GAAP Gross Profit
97.3
$
105.8
$
122.0
$
125.1
$
450.2
$
88.6
$
92.9
$
111.5
$
115.0
$
408.0
$
Non-GAAP Gross Profit as % of Revenues
35.2%
35.7%
39.2%
37.9%
37.1%
33.9%
35.6%
37.2%
38.8%
36.5%
GAAP Selling and Administrative Expenses
72.4
$
72.5
$
66.2
$
73.0
$
284.1
$
62.9
$
68.2
$
66.6
$
73.2
$
270.9
$
Stock-Based Compensation Expense
(0.5)
(0.7)
(0.5)
(0.3)
(2.0)
(0.5)
(0.5)
(0.5)
(0.4)
(1.9)
Intangibles Amortization Expense
(11.6)
(12.3)
(11.5)
(10.5)
(45.9)
(11.7)
(12.1)
(11.1)
(13.6)
(48.5)
Asset Impairment Charges
(0.5)
-
-
(2.6)
(3.1)
-
-
(0.8)
(0.9)
(1.7)
Restructuring Charges
(1.6)
(5.5)
(1.0)
(0.4)
(8.5)
(1.0)
(0.7)
(0.8)
(3.0)
(5.5)
Production Transfers Costs
(1)
(0.2)
0.2
(0.1)
(0.1)
(0.2)
(0.1)
(0.1)
(0.3)
(0.6)
(1.1)
Other
-
1.4
-
-
1.4
-
-
-
-
-
Non-GAAP Selling and Administrative Expenses
58.0
$
55.6
$
53.1
$
59.1
$
225.8
$
49.6
$
54.8
$
53.1
$
54.7
$
212.2
$
Non-GAAP S&A Expenses as % of Revenues
21.0%
18.7%
17.0%
17.9%
18.6%
19.0%
21.0%
17.7%
18.4%
19.0%
GAAP Operating Earnings
22.5
$
27.6
$
51.7
$
45.6
$
147.4
$
25.7
$
24.7
$
44.9
$
40.8
$
136.1
$
Stock-Based Compensation Expense
0.5
0.7
0.5
0.3
2.0
0.5
0.5
0.5
0.4
1.9
Intangibles Amortization Expense
11.6
12.3
11.5
10.5
45.9
11.7
12.1
11.1
13.6
48.5
Asset Impairment and Related Inventory Charges
0.5
-
0.4
4.3
5.2
-
-
0.8
0.9
1.7
Restructuring Charges
3.4
9.5
2.0
1.4
16.3
1.0
0.7
0.8
3.4
5.9
Production Transfers Costs
(1)
0.8
1.5
2.8
3.9
9.0
0.1
0.1
0.3
1.2
1.7
Other
-
(1.4)
-
-
(1.4)
-
-
-
-
-
Non-GAAP Operating Earnings
39.3
$
50.2
$
68.9
$
66.0
$
224.4
$
39.0
$
38.1
$
58.4
$
60.3
$
195.8
$
Non-GAAP Operating Earnings as % of Revenues
14.2%
16.9%
22.1%
20.0%
18.5%
14.9%
14.6%
19.5%
20.3%
17.5%
Notes:
2013
2012
(1) Production Transfer Costs represent one-time and duplicate costs incurred to
migrate manufacturing to new facilities, primarily for speakers, hearing health products, and capacitors. These amounts
are included in the corresponding GAAP Gross Profit, GAAP Selling and Administrative Expenses
and GAAP Operating Earnings for each period presented. |
 64
KNOWLES CORPORATION
(unaudited, dollars in millions)
2013
Mobile Consumer Electronics
Adjusted EBITDA
(1)
245.7
$
Asset Impairment and Related Inventory Charges
(5.1)
Restructuring Charges
(7.3)
Production Transfers Costs
(2)
(3.6)
EBITDA
(3)
229.7
$
MCE EBITDA as % of MCE Revenues
29.5%
Specialty Components
Adjusted EBITDA
(1)
106.2
$
Restructuring Charges
(9.2)
Production Transfers Costs
(2)
(5.2)
Other
1.4
EBITDA
(3)
93.2
$
SC EBITDA as % of SC Revenues
21.3%
Total Segments EBITDA
(3)
322.9
$
Corporate/Other
Adjusted EBITDA
(1)
(44.9)
$
Stock-Based Compensation Expense
(1.9)
EBITDA
(3)
(46.8)
$
Combined EBITDA
(3)
276.1
$
Interest Expense, net
(42.0)
Depreciation and Amortization Expense
(130.9)
Earnings before income taxes
103.2
$
RECONCILIATION OF SEGMENT NON-GAAP FINANCIAL MEASURES
TO GAAP FINANCIAL MEASURES
(1) Adjusted EBITDA is defined as net earnings plus (i) depreciation and amortization
expense, (ii) interest expense, and (iii) income taxes, excluding restructuring costs,
stock- based compensation, and acquisition transaction costs.
(3) EBITDA is defined as net earnings plus (i) depreciation and
amortization expense, (ii)
interest expense, and (iii) income taxes.
(2) Production Transfer Costs represent one-time and duplicate costs incurred to
migrate manufacturing to new facilities, primarily for speakers,
hearing health products,
and capacitors. |
 65
KNOWLES CORPORATION
(unaudited, dollars in millions)
2012
2011
Mobile Consumer Electronics
Adjusted EBITDA
(1)
184.7
$
154.8
$
Asset Impairment and Related Inventory Charges
(1.7)
-
Restructuring Charges
(1.2)
-
Production Transfers Costs
(2)
(1.7)
-
EBITDA
(3)
180.1
$
154.8
$
MCE EBITDA as % of MCE Revenues
26.9%
30.4%
Specialty Components
Adjusted EBITDA
(1)
115.0
$
130.1
$
Restructuring Charges
(4.6)
(0.5)
EBITDA
(3)
110.4
$
129.6
$
SC EBITDA as % of SC Revenues
24.6%
27.4%
Total Segments EBITDA
(3)
290.5
$
284.4
$
Corporate/Other
Adjusted EBITDA
(1)
(38.3)
$
(39.2)
$
Stock-Based Compensation Expense
(1.9)
(1.9)
Acquisition Transaction Costs
(4)
-
(13.1)
EBITDA
(3)
(40.2)
$
(54.2)
$
Combined EBITDA
(3)
250.3
$
230.2
$
Interest Expense, net
(56.5)
(39.9)
$
Depreciation and Amortization Expense
(114.9)
(84.8)
$
Benefit from (provision for) income taxes
0.2
(7.1)
$
Net Earnings
79.1
$
98.4
$
(4) Acquisition Transaction Costs represent expenditures associated with the purchase
of the Sound Solutions business.
RECONCILIATION OF SEGMENT NON-GAAP FINANCIAL
MEASURES TO GAAP FINANCIAL MEASURES
(1) Adjusted EBITDA is defined as net earnings plus (i) depreciation and amortization
expense, (ii) interest expense, and (iii) income taxes, excluding restructuring costs,
stock-based compensation, and acquisition transaction costs.
(3) EBITDA is defined as net earnings plus (i) depreciation and
amortization expense, (ii) interest expense,
and (iii) income taxes.
(2) Production Transfer Costs represent one-time and duplicate costs incurred to
migrate manufacturing to new facilities, primarily for speakers, hearing health
products, and capacitors. |
 66
KNOWLES CORPORATION
(unaudited, dollars in millions)
2013
Revenues
1,214.8
$
Earnings Before Taxes
103.2
Depreciation and Amortization Expense
130.9
Interest Expense, net
42.0
EBITDA
(1)
276.1
$
EBITDA margin
(2)
22.7%
RECONCILIATION OF EARNINGS BEFORE TAXES TO
EBITDA
(1) EBITDA is defined as net earnings plus (i) depreciation and amortization expense,
(ii) interest expense, and (iii) income taxes.
(2) EBITDA margin is defined as EBITDA as a percentage of revenue.
|
 67
KNOWLES CORPORATION
(unaudited, dollars in millions)
2012
2011
2010
2009
2008
Revenues
1,118.0
$
983.3
$
730.4
$
587.0
$
630.4
$
Net Earnings
79.1
98.4
109.3
37.3
33.1
Depreciation and Amortization Expense
114.9
84.8
54.4
50.7
49.5
Interest Expense, net
56.5
39.9
20.3
21.2
37.5
Benefit from (provision for) income taxes
(0.2)
7.1
7.5
18.5
13.0
EBITDA
(1)
250.3
$
230.2
$
191.4
$
127.6
$
133.1
$
EBITDA margin
(2)
22.4%
23.4%
26.2%
21.7%
21.1%
(1) EBITDA
is
defined
as
net
earnings
plus
(i)
depreciation
and
amortization
expense,
(ii)
interest
expense,
and
(iii)
income
taxes.
(2) EBITDA margin is defined as EBITDA as a percentage of revenue.
RECONCILIATION OF NET EARNINGS TO
EBITDA |