Attached files
| file | filename |
|---|---|
| 8-K - FORM 8-K - Dealertrack Technologies, Inc | v369176_8k.htm |
| EX-99.1 - EXHIBIT 99.1 - Dealertrack Technologies, Inc | v369176_ex99-1.htm |
Investor Presentation February 19, 2014

2 Statements in this press release regarding Dealertrack’s expected 2014 performance based on both GAAP and non - GAAP measures, the long - term outlook for its business, expectations concerning our pending acquisition of Dealer . com, and all other statements in this release other than the recitation of historical facts are forward - looking statements (as defined in the Private Securities Litigation Reform Act of 1995 ) . These statements involve a number of risks, uncertainties and other factors that could cause actual results, performance or achievements of Dealertrack to be materially different from any future results, performance or achievements expressed or implied by these forward - looking statements . Factors that might cause such a difference include : economic trends that affect the automotive retail industry or the indirect automotive financing industry including the number of new and used cars sold ; credit availability ; reductions in automotive dealerships ; increased competitive pressure from other industry participants, including Open Dealer Exchange, RouteOne, CUDL, Finance Express and AppOne ; the impact of some vendors of software products for automotive dealers making it more difficult for Dealertrack’s customers to use Dealertrack’s solutions and services ; security breaches, interruptions, failures and/or other errors involving Dealertrack’s systems or networks ; the failure or inability to execute any element of Dealertrack’s business strategy, including selling additional products and services to existing and new customers ; Dealertrack’s success in implementing an ERP system ; the volatility of Dealertrack’s stock price ; new regulations or changes to existing regulations ; the integration of recent acquisitions and the expected benefits, as well as the integration and expected benefits of any future acquisitions that Dealertrack may pursue ; Dealertrack’s success in expanding its customer base and product and service offerings, the impact of recent economic trends, and difficulties and increased costs associated with raising additional capital ; the impairment of intangible assets, such as trademarks and goodwill ; failure to consummate or delay in consummating our pending acquisition of Dealer . com ; the possibility that the expected benefits of our acquisition of Dealer . com may not materialize as expected ; failure to successfully integrate the business, infrastructure and employees of Dealer . com ; and other risks listed in Dealertrack’s reports filed with the Securities and Exchange Commission (SEC), including its most recent Annual Report on Form 10 - K . These filings can be found on Dealertrack’s website at www . dealertrack . com and the SEC’s website at www . sec . gov . Forward - looking statements included herein speak only as of February 19 , 2014 and Dealertrack disclaims any obligation to revise or update such statements to reflect events or circumstances after the date hereof or to reflect the occurrence of unanticipated events or circumstances, except as required by law . Safe Harbor for Forward - Looking Statements
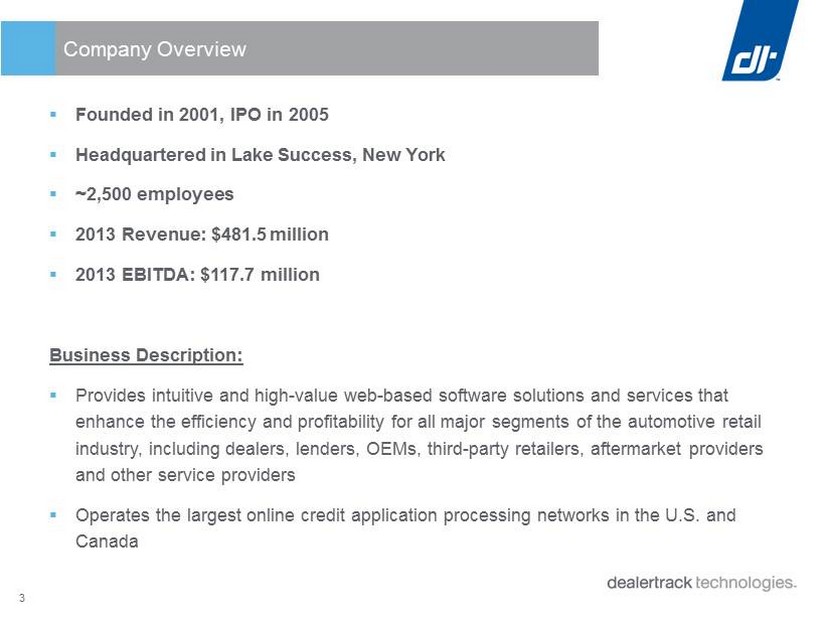
3 ▪ Founded in 2001, IPO in 2005 ▪ Headquartered in Lake Success, New York ▪ ~2,500 employees ▪ 2013 Revenue: $481.5 million ▪ 2013 EBITDA: $117.7 million Business Description: ▪ Provides intuitive and high - value web - based software solutions and services that enhance the efficiency and profitability for all major segments of the automotive retail industry, including dealers, lenders, OEMs, third - party retailers, aftermarket providers and other service providers ▪ Operates the largest online credit application processing networks in the U.S. and Canada Company Overview
4 ▪ Leading provider of web - based software solutions and services that enhance the efficiency and profitability for all major segments of the automotive retail industry ▪ Most comprehensive suite of solutions in industry ▪ Attractive $3 to $4 billion market size provides opportunity for long - term growth ▪ Consistent track record of growth and profitability ▪ Double - digit revenue growth driven by organic and acquisition opportunities ▪ Predictable business model with significant recurring revenue ▪ Seasoned management team with extensive industry experience Investment Highlights
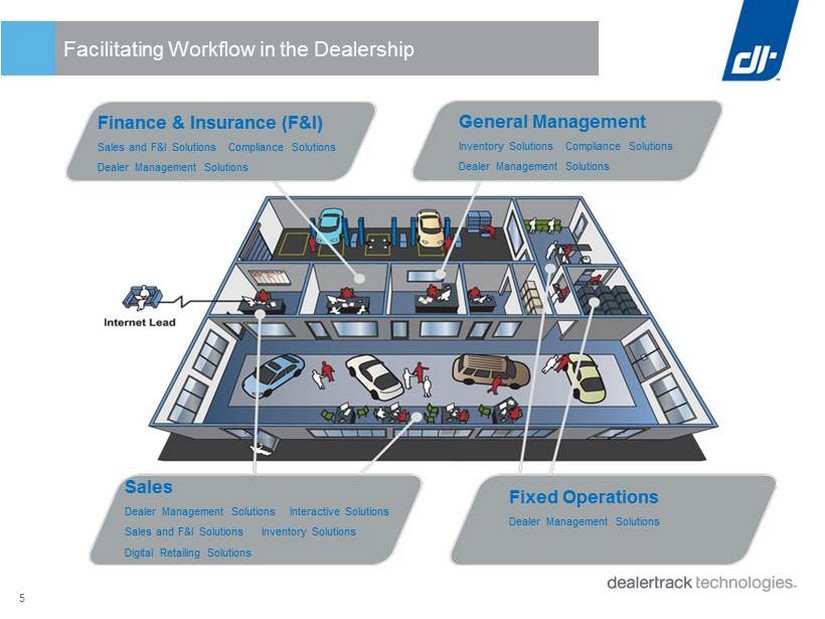
5 Facilitating Workflow in the Dealership Finance & Insurance (F&I) Sales and F&I Solutions Compliance Solutions Dealer Management Solutions General Management Inventory Solutions Compliance Solutions Dealer Management Solutions Sales Dealer Management Solutions Interactive Solutions Sales and F&I Solutions Inventory Solutions Digital Retailing Solutions Fixed Operations Dealer Management Solutions
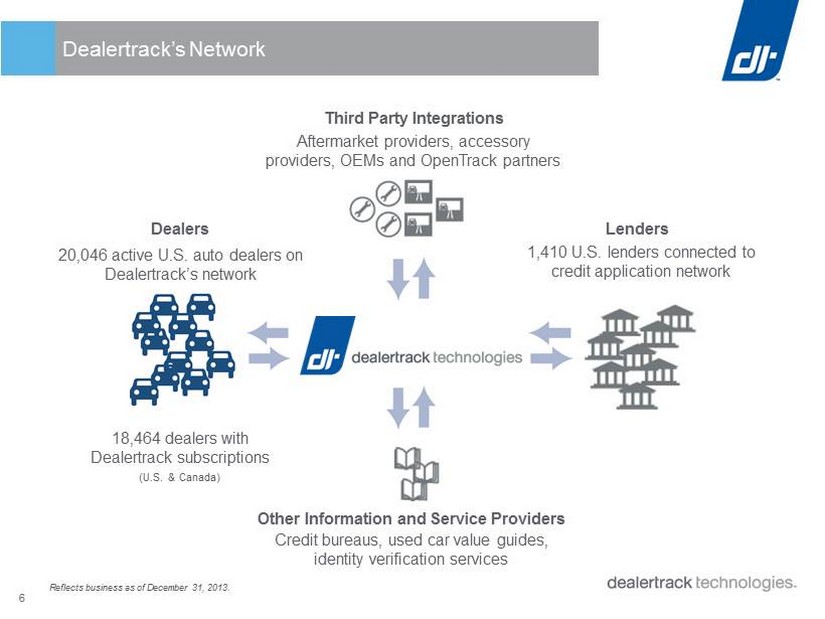
6 Dealertrack’s Network Aftermarket providers, accessory providers, OEMs and OpenTrack partners Third Party Integrations Other Information and Service Providers Lenders 1,410 U.S. lenders connected to credit application network Credit bureaus, used car value guides, identity verification services Dealers 20,046 active U.S. auto dealers on Dealertrack’s network 18,464 dealers with Dealertrack subscriptions (U.S. & Canada) Reflects business as of December 31, 2013.
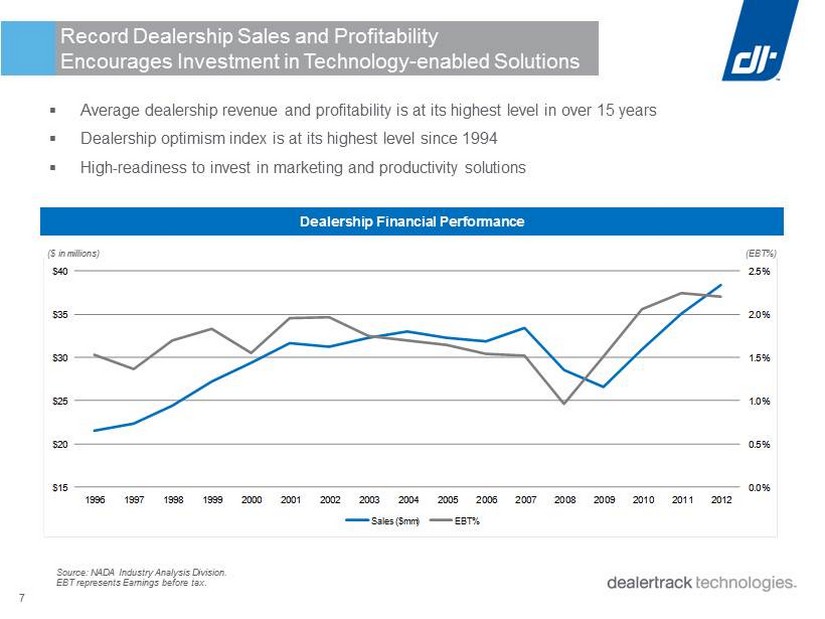
7 ▪ Average dealership revenue and profitability is at its highest level in over 15 years ▪ Dealership optimism index is at its highest level since 1994 ▪ High - readiness to invest in marketing and productivity solutions Source: NADA Industry Analysis Division. EBT represents Earnings before tax. Record Dealership Sales and Profitability Encourages Investment in Technology - enabled Solutions Dealership Financial Performance 0.0% 0.5% 1.0% 1.5% 2.0% 2.5% $15 $20 $25 $30 $35 $40 1996 1997 1998 1999 2000 2001 2002 2003 2004 2005 2006 2007 2008 2009 2010 2011 2012 Sales ($mm) EBT% ( $ in millions) ( EBT%)
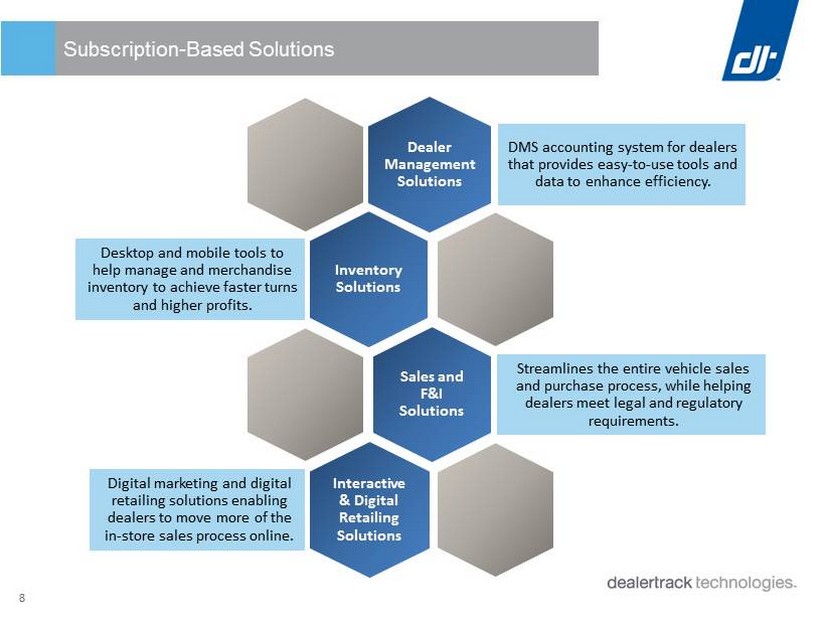
8 Subscription - Based Solutions Dealer Management Solutions DMS accounting system for dealers that provides easy - to - use tools and data to enhance efficiency. Inventory Solutions Desktop and mobile tools to help manage and merchandise inventory to achieve faster turns and higher profits. Sales and F&I Solutions Streamlines the entire vehicle sales and purchase process, while helping dealers meet legal and regulatory requirements. Interactive & Digital Retailing Solutions Digital marketing and digital retailing solutions enabling dealers to move more of the in - store sales process online.

9 0 5,000 10,000 15,000 20,000 25,000 30,000 Bookout Compliance Deal Transfer Desking DMS* eContracting Inventory Menu Interactive Transport Market Opportunity Current Clients Significant Opportunity to Further Penetrate the Market * Top franchise groups not included in DMS market opportunity. Addressable franchise and independent dealers
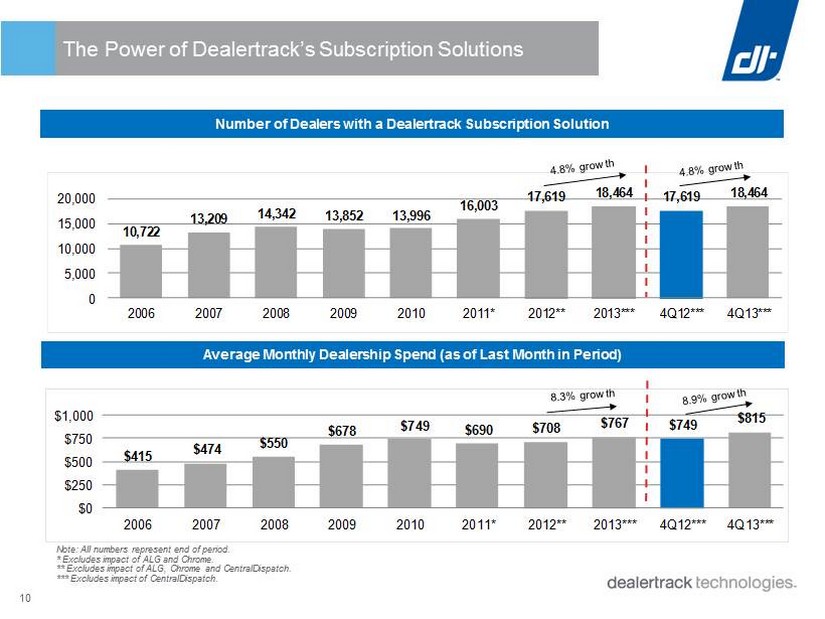
10 The Power of Dealertrack’s Subscription Solutions $415 $474 $550 $678 $749 $690 $708 $767 $749 $815 $0 $250 $500 $750 $1,000 2006 2007 2008 2009 2010 2011* 2012** 2013*** 4Q12*** 4Q13*** Note: All numbers represent end of period . * Excludes impact of ALG and Chrome. ** Excludes impact of ALG, Chrome and CentralDispatch. *** Excludes impact of CentralDispatch. Number of Dealers with a Dealertrack Subscription Solution Average Monthly Dealership Spend (as of Last Month in Period) 10,722 13,209 14,342 13,852 13,996 16,003 17,619 18,464 17,619 18,464 0 5,000 10,000 15,000 20,000 2006 2007 2008 2009 2010 2011* 2012** 2013*** 4Q12*** 4Q13***
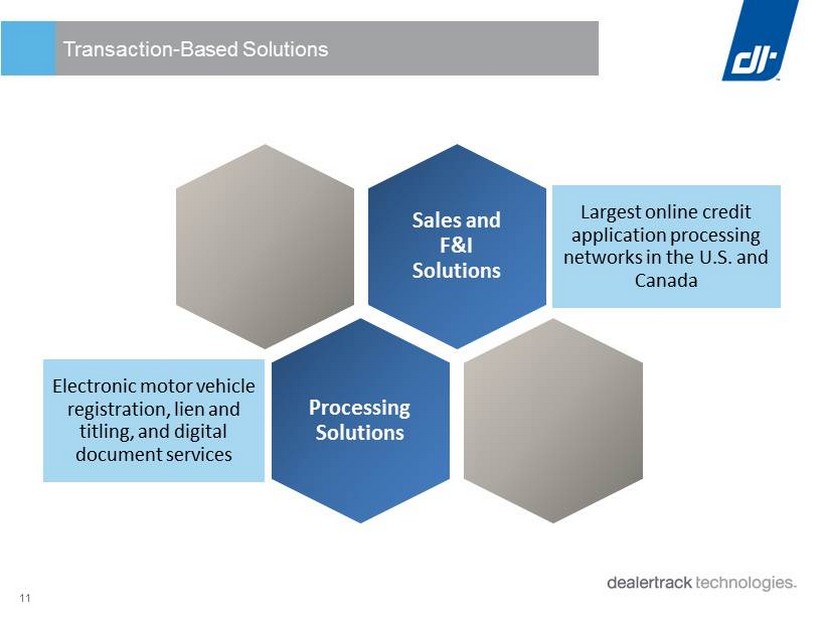
11 Transaction - Based Solutions Sales and F&I Solutions Largest online credit application processing networks in the U.S. and Canada Processing Solutions Electronic motor vehicle registration, lien and titling, and digital document services
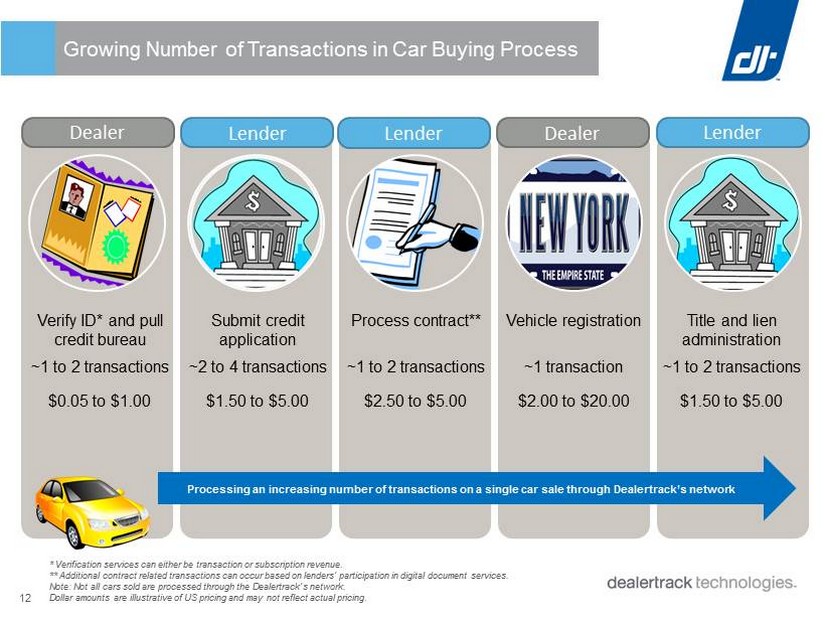
12 Growing Number of Transactions in Car Buying Process Processing an increasing number of transactions on a single car sale through Dealertrack’s network * Verification services can either be transaction or subscription revenue. ** Additional contract related transactions can occur based on lenders’ participation in digital document services . Note: Not all cars sold are processed through the Dealertrack’s network . Dollar amounts are illustrative of US pricing and may not reflect actual pricing. Dealer Dealer Lender Lender Lender Verify ID* and pull credit bureau Submit credit application Process contract** Vehicle registration Title and lien administration ~1 to 2 transactions ~2 to 4 transactions ~1 to 2 transactions ~1 transaction ~1 to 2 transactions $0.05 to $1.00 $1.50 to $5.00 $2.50 to $5.00 $2.00 to $20.00 $1.50 to $5.00
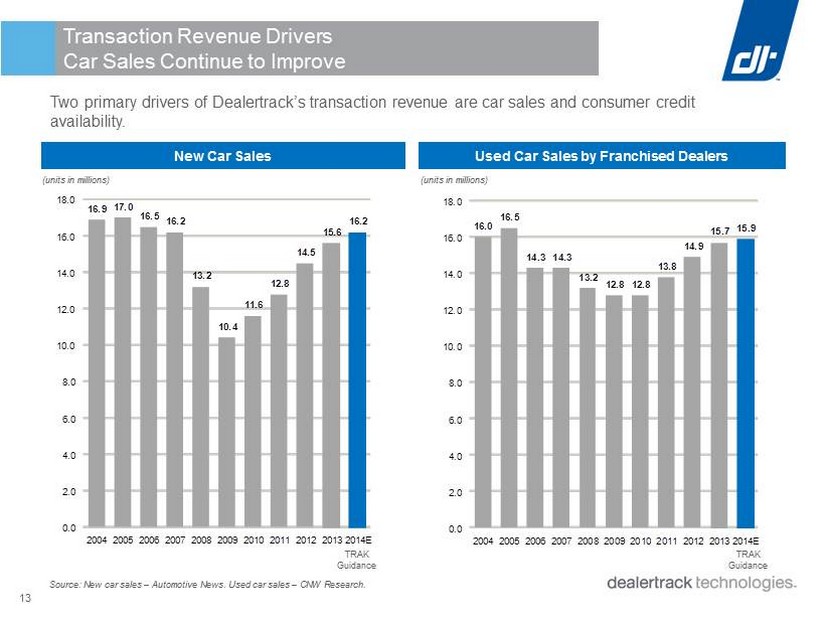
13 Transaction Revenue Drivers Car Sales Continue to Improve New Car Sales Used Car Sales by Franchised Dealers (units in millions) TRAK Guidance (units in millions) Two primary drivers of Dealertrack’s transaction revenue are car sales and consumer credit availability. TRAK Guidance Source: New car sales – Automotive News. Used car sales – CNW Research. 16.9 17.0 16.5 16.2 13.2 10.4 11.6 12.8 14.5 15.6 16.2 0.0 2.0 4.0 6.0 8.0 10.0 12.0 14.0 16.0 18.0 2004 2005 2006 2007 2008 2009 2010 2011 2012 2013 2014E 16.0 16.5 14.3 14.3 13.2 12.8 12.8 13.8 14.9 15.7 15.9 0.0 2.0 4.0 6.0 8.0 10.0 12.0 14.0 16.0 18.0 2004 2005 2006 2007 2008 2009 2010 2011 2012 2013 2014E
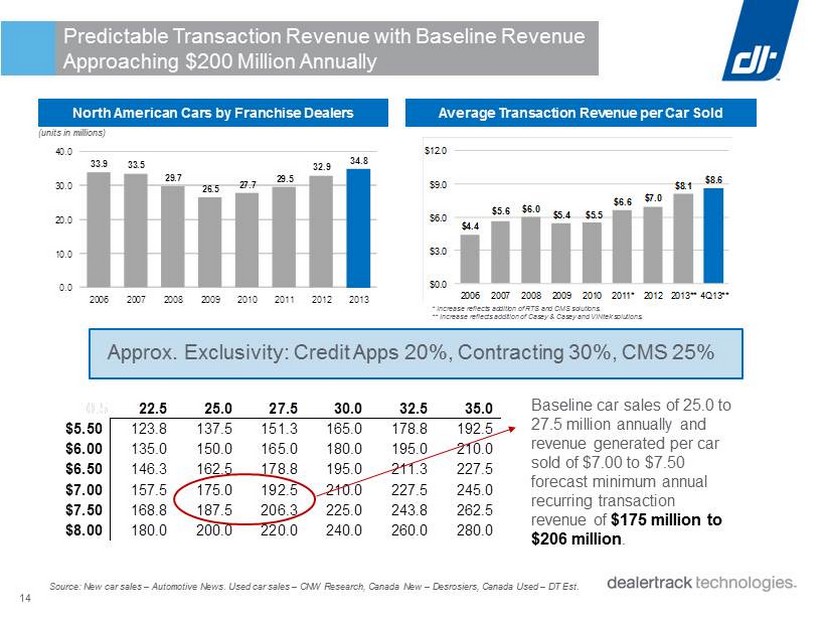
14 0.5 22.5 25.0 27.5 30.0 32.5 35.0 $5.50 123.8 137.5 151.3 165.0 178.8 192.5 $6.00 135.0 150.0 165.0 180.0 195.0 210.0 $6.50 146.3 162.5 178.8 195.0 211.3 227.5 $7.00 157.5 175.0 192.5 210.0 227.5 245.0 $7.50 168.8 187.5 206.3 225.0 243.8 262.5 $8.00 180.0 200.0 220.0 240.0 260.0 280.0 Predictable Transaction Revenue with Baseline Revenue Approaching $200 Million Annually North American Cars by Franchise Dealers (units in millions) Source: New car sales – Automotive News. Used car sales – CNW Research, Canada New – Desrosiers, Canada Used – DT Est. $4.4 $5.6 $6.0 $5.4 $5.5 $6.6 $7.0 $8.1 $8.6 $0.0 $3.0 $6.0 $9.0 $12.0 2006 2007 2008 2009 2010 2011* 2012 2013** 4Q13** Average Transaction Revenue per Car Sold Approx. Exclusivity: Credit Apps 20%, Contracting 30%, CMS 25% Baseline car sales of 25.0 to 27.5 million annually and revenue generated per car sold of $7.00 to $7.50 forecast minimum annual recurring transaction revenue of $175 million to $206 million . * Increase reflects addition of RTS and CMS solutions. ** Increase reflects addition of Casey & Casey and VINtek solutions. 33.9 33.5 29.7 26.5 27.7 29.5 32.9 34.8 0.0 10.0 20.0 30.0 40.0 2006 2007 2008 2009 2010 2011 2012 2013
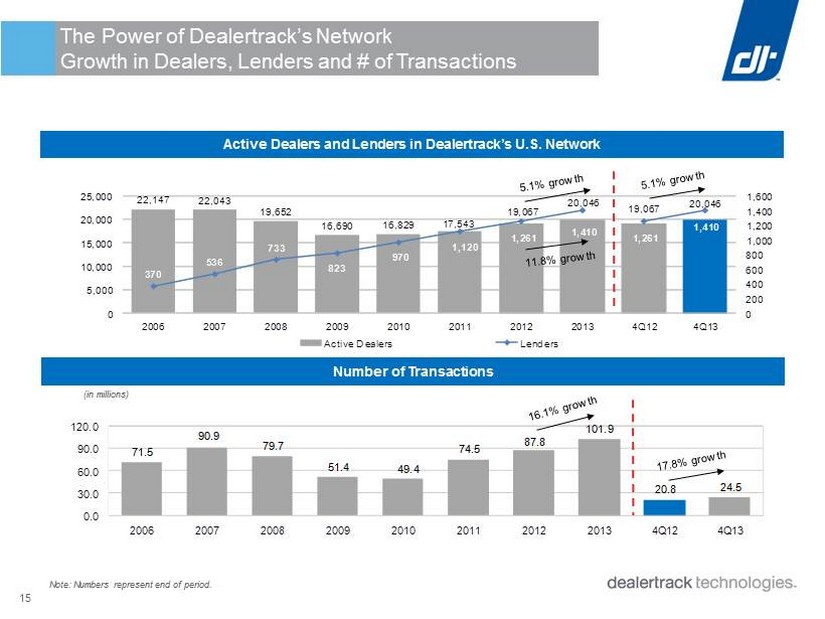
15 22,147 22,043 19,652 16,690 16,829 17,543 19,067 20,046 19,067 20,046 370 536 733 823 970 1,120 1,261 1,410 1,261 1,410 0 200 400 600 800 1,000 1,200 1,400 1,600 0 5,000 10,000 15,000 20,000 25,000 2006 2007 2008 2009 2010 2011 2012 2013 4Q12 4Q13 Active Dealers Lenders Active Dealers and Lenders in Dealertrack’s U.S. Network Note: Numbers represent end of period. Number of Transactions (in millions) 71.5 90.9 79.7 51.4 49.4 74.5 87.8 101.9 20.8 24.5 0.0 30.0 60.0 90.0 120.0 2006 2007 2008 2009 2010 2011 2012 2013 4Q12 4Q13 The Power of Dealertrack’s Network Growth in Dealers, Lenders and # of Transactions
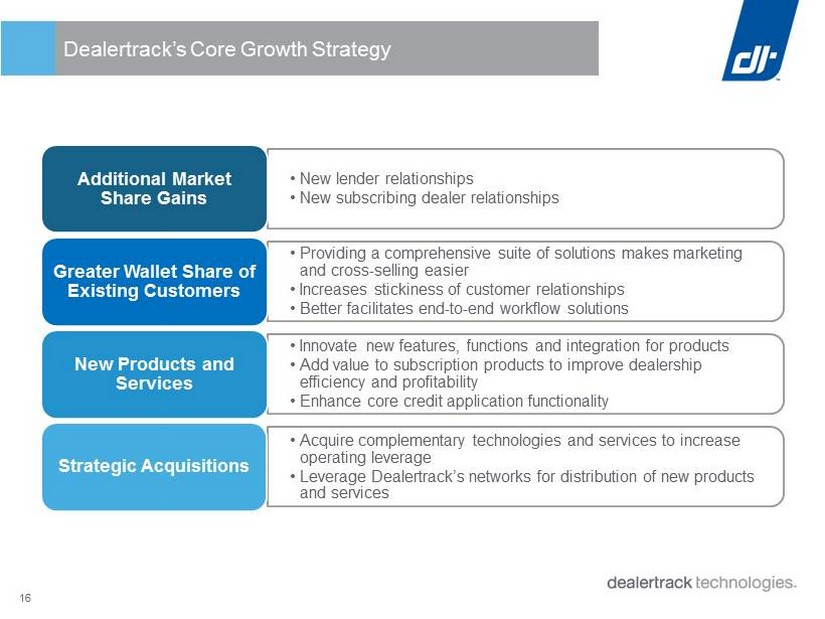
16 Dealertrack’s Core Growth Strategy • New lender relationships • New subscribing dealer relationships Additional Market Share Gains • Providing a comprehensive suite of solutions makes marketing and cross - selling easier • Increases stickiness of customer relationships • Better facilitates end - to - end workflow solutions Greater Wallet Share of Existing Customers • Innovate new features, functions and integration for products • Add value to subscription products to improve dealership efficiency and profitability • Enhance core credit application functionality New Products and Services • Acquire complementary technologies and services to increase operating leverage • Leverage Dealertrack’s networks for distribution of new products and services Strategic Acquisitions
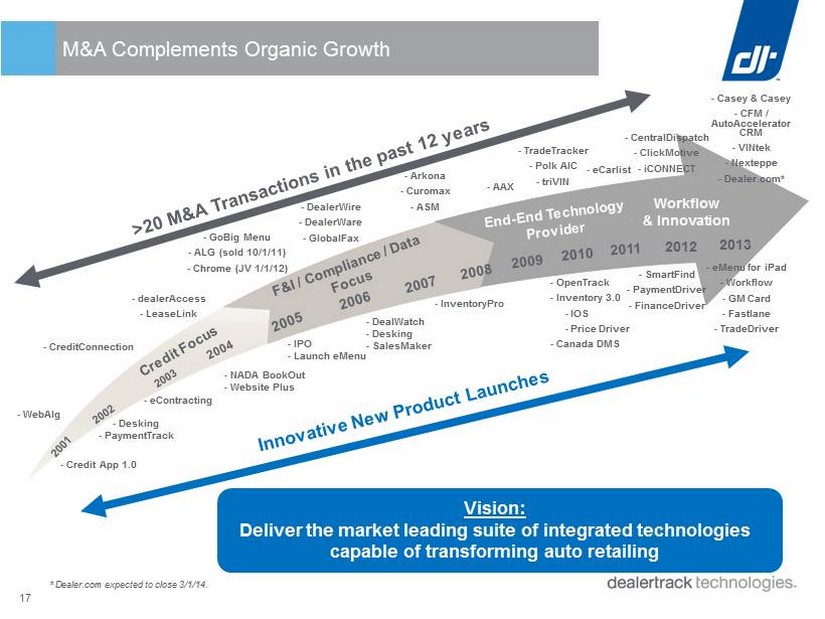
17 M&A Complements Organic Growth - Credit App 1.0 - Desking - PaymentTrack - eContracting - NADA BookOut - Website Plus - IPO - Launch eMenu - DealWatch - Desking - SalesMaker - InventoryPro - WebAlg - CreditConnection - dealerAccess - LeaseLink - GoBig Menu - ALG (sold 10/1/11) - Chrome (JV 1/1/12) - DealerWire - DealerWare - GlobalFax - Arkona - Curomax - ASM - AAX Workflow & Innovation - OpenTrack - Inventory 3.0 - IOS - Price Driver - Canada DMS - TradeTracker - Polk AIC - triVIN 2012 - SmartFind - PaymentDriver - FinanceDriver - CentralDispatch - ClickMotive - iCONNECT Vision: Deliver the market leading suite of integrated technologies capable of transforming auto retailing - eCarlist 2013 - Casey & Casey - CFM / AutoAccelerator CRM - VINtek - Nexteppe - Dealer.com* - eMenu for iPad - Workflow - GM Card - Fastlane - TradeDriver * Dealer.com expected to close 3/1/14.
18 ▪ Sixteen consecutive quarters of year - over - year revenue growth ▪ Transaction revenue growth outpacing car sales growth ▪ Significant component of total revenue (over 35%) from recurring subscription services ▪ Strong subscription renewal rates ▪ Operating leverage drives long - term margin potential ▪ Proven acquisition strategy complements healthy organic growth Financial Highlights
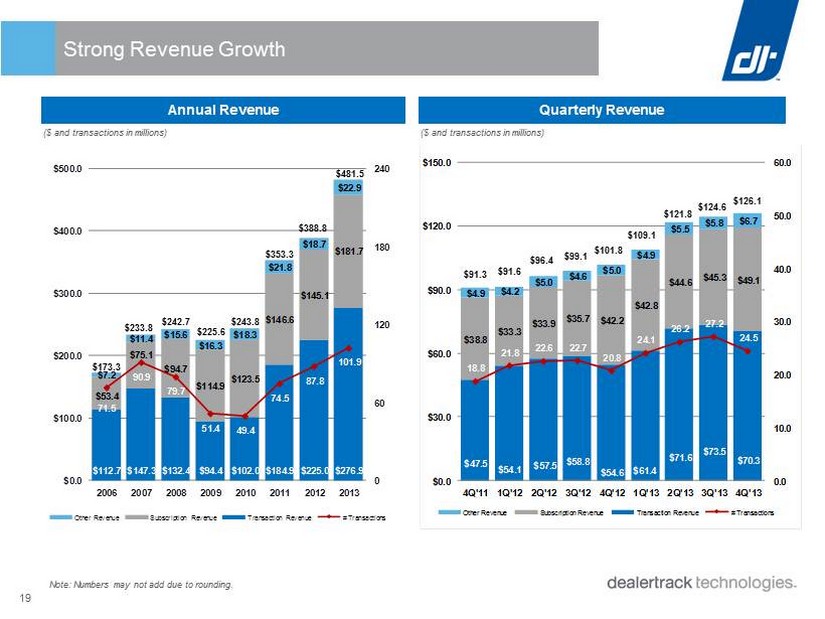
19 Strong Revenue Growth Annual Revenue Quarterly Revenue $112.7 $147.3 $132.4 $94.4 $102.0 $184.9 $225.0 $276.9 $53.4 $75.1 $94.7 $114.9 $123.5 $146.6 $145.1 $181.7 $7.2 $11.4 $15.6 $16.3 $18.3 $21.8 $18.7 $22.9 71.5 90.9 79.7 51.4 49.4 74.5 87.8 101.9 0 60 120 180 240 $0.0 $100.0 $200.0 $300.0 $400.0 $500.0 2006 2007 2008 2009 2010 2011 2012 2013 Other Revenue Subscription Revenue Transaction Revenue # Transactions $173.3 $233.8 $242.7 $225.6 $243.8 $353.3 $ 388.8 $47.5 $54.1 $57.5 $58.8 $54.6 $61.4 $71.6 $73.5 $70.3 $38.8 $33.3 $33.9 $35.7 $42.2 $42.8 $44.6 $45.3 $49.1 $4.9 $4.2 $5.0 $4.6 $5.0 $4.9 $5.5 $5.8 $6.7 18.8 21.8 22.6 22.7 20.8 24.1 26.2 27.2 24.5 0.0 10.0 20.0 30.0 40.0 50.0 60.0 $0.0 $30.0 $60.0 $90.0 $120.0 $150.0 4Q'11 1Q'12 2Q'12 3Q'12 4Q'12 1Q'13 2Q'13 3Q'13 4Q'13 Other Revenue Subscription Revenue Transaction Revenue # Transactions $ 91.6 $91.3 $101.8 $109.1 $ 96.4 $ 99.1 $121.8 ($ and transactions in millions) ($ and transactions in millions) Note: Numbers may not add due to rounding. $124.6 $481.5 $126.1
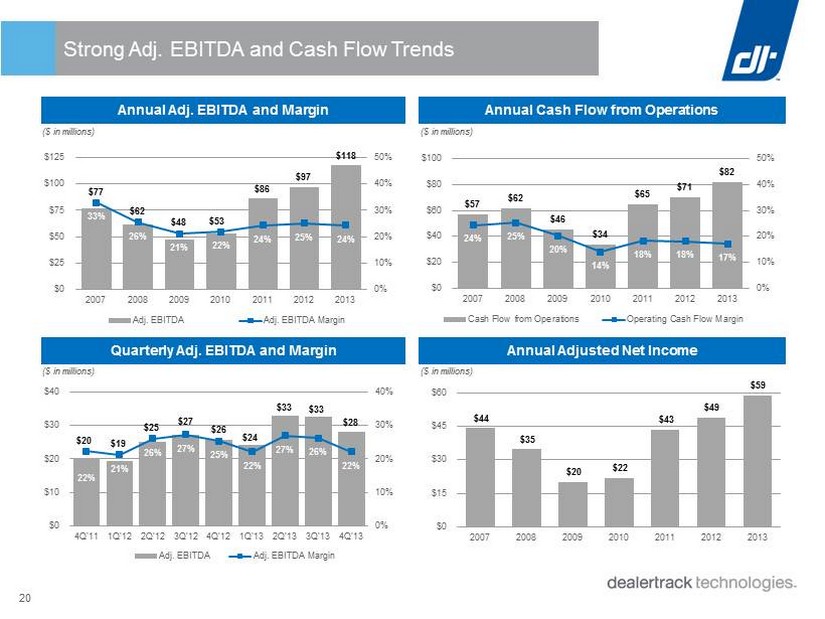
20 $77 $62 $48 $53 $86 $97 $118 33% 26% 21% 22% 24% 25% 24% 0% 10% 20% 30% 40% 50% $0 $25 $50 $75 $100 $125 2007 2008 2009 2010 2011 2012 2013 Adj. EBITDA Adj. EBITDA Margin $20 $19 $25 $27 $26 $24 $33 $33 $28 22% 21% 26% 27% 25% 22% 27% 26% 22% 0% 10% 20% 30% 40% $0 $10 $20 $30 $40 4Q'11 1Q'12 2Q'12 3Q'12 4Q'12 1Q'13 2Q'13 3Q'13 4Q'13 Adj. EBITDA Adj. EBITDA Margin $57 $62 $46 $34 $65 $71 $82 24% 25% 20% 14% 18% 18% 17% 0% 10% 20% 30% 40% 50% $0 $20 $40 $60 $80 $100 2007 2008 2009 2010 2011 2012 2013 Cash Flow from Operations Operating Cash Flow Margin $44 $35 $20 $22 $43 $49 $59 $0 $15 $30 $45 $60 2007 2008 2009 2010 2011 2012 2013 ($ in millions) ($ in millions) Strong Adj. EBITDA and Cash Flow Trends Annual Adj. EBITDA and Margin Annual Cash Flow from Operations Quarterly Adj. EBITDA and Margin Annual Adjusted Net Income ($ in millions) ($ in millions)

21 ▪ Leading provider of web - based software solutions and services that enhance the efficiency and profitability for all major segments of the automotive retail industry ▪ Most comprehensive suite of solutions in industry ▪ Attractive $3 to $4 billion market size provides opportunity for long - term growth ▪ Consistent track record of growth and profitability ▪ Double - digit revenue growth driven by organic and acquisition opportunities ▪ Predictable business model with significant recurring revenue ▪ Seasoned management team with extensive industry experience Investment Highlights

Dealer.com Overview Presentation is Proprietary & Confidential Information

23 Addressing The Needs Of A Changing Automotive Retailing Industry ■ Dealer.com’s primary products provide connectivity and visibility across dealerships’ marketing and operations, so they can better manage their business ■ Unique combination that benefits all tiers across all touch points ■ Derives insights from the largest data set of automotive consumer engagement trends and online shopping behaviors ■ Executes through expertise from proprietary, scalable technology that delivers optimal control and visibility Inventory Advertising Websites CRM Analytics
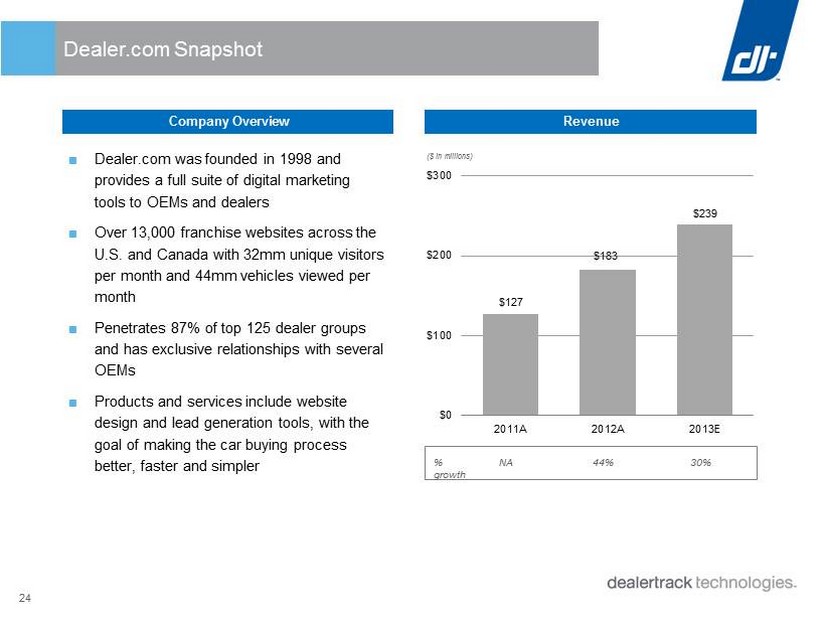
24 Dealer.com Snapshot Company Overview ■ Dealer.com was founded in 1998 and provides a full suite of digital marketing tools to OEMs and dealers ■ Over 13,000 franchise websites across the U.S. and Canada with 32mm unique visitors per month and 44mm vehicles viewed per month ■ Penetrates 87% of top 125 dealer groups and has exclusive relationships with several OEMs ■ Products and services include website design and lead generation tools, with the goal of making the car buying process better, faster and simpler ( $ in m illions) Revenue % growth NA 44% 30% $127 $183 $239 $0 $100 $200 $300 2011A 2012A 2013E
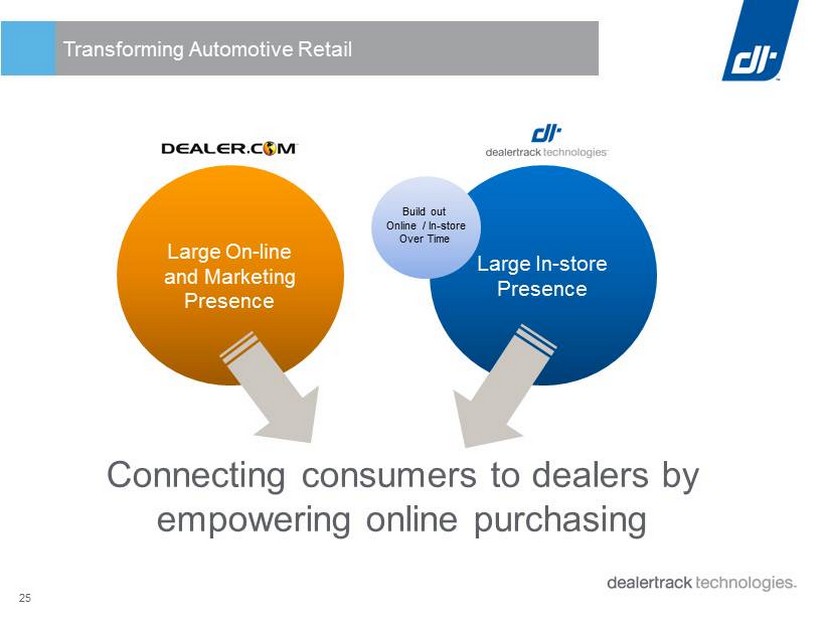
25 Transforming Automotive Retail Large On - line and Marketing Presence Large In - store Presence Build out Online / In - store Over Time Connecting consumers to dealers by empowering online purchasing
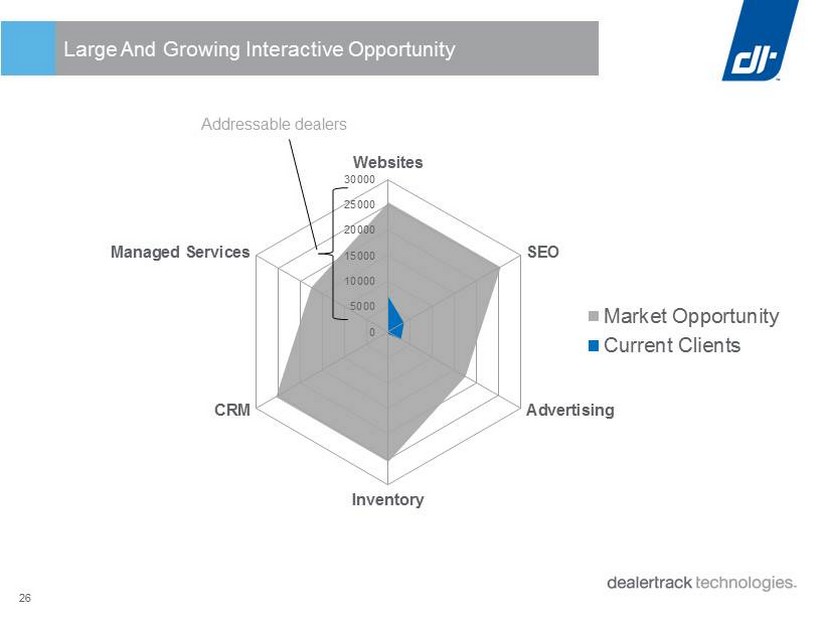
26 Large And Growing Interactive Opportunity Addressable dealers 0 5000 10000 15000 20000 25000 30000 Websites SEO Advertising Inventory CRM Managed Services Market Opportunity Current Clients
Appendix
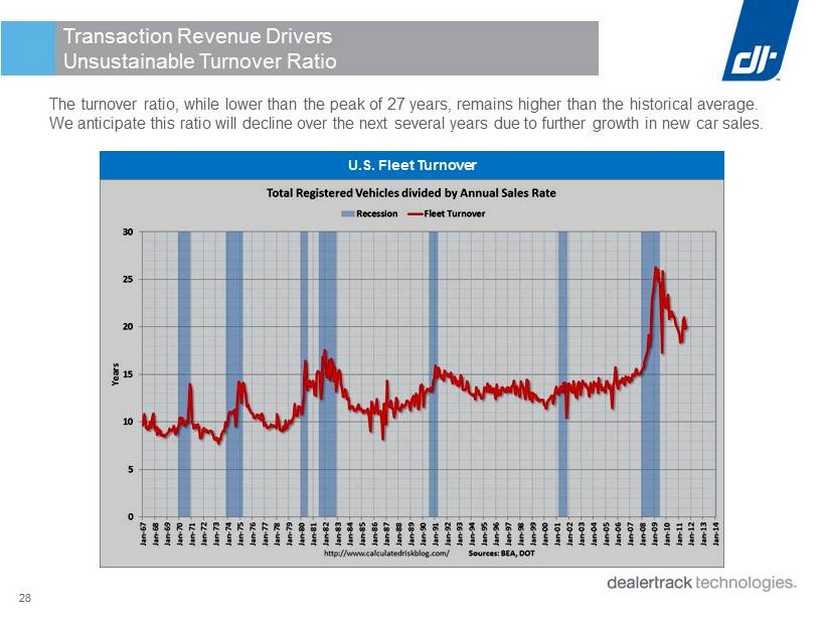
28 Transaction Revenue Drivers Unsustainable Turnover Ratio The turnover ratio, while lower than the peak of 27 years, remains higher than the historical average. We anticipate this ratio will decline over the next several years due to further growth in new car sales . U.S. Fleet Turnover
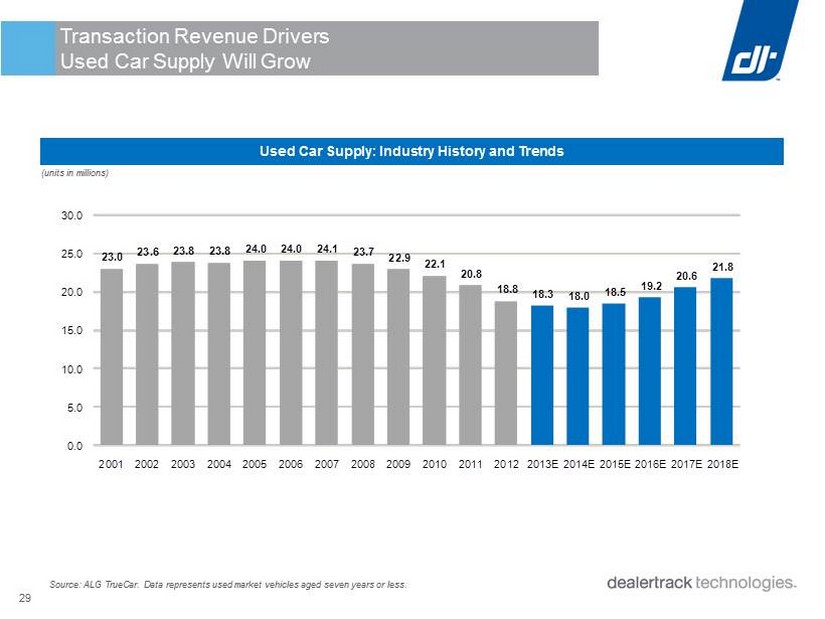
29 Transaction Revenue Drivers Used Car Supply Will Grow Used Car Supply: Industry History and Trends 23.0 23.6 23.8 23.8 24.0 24.0 24.1 23.7 22.9 22.1 20.8 18.8 18.3 18.0 18.5 19.2 20.6 21.8 0.0 5.0 10.0 15.0 20.0 25.0 30.0 2001 2002 2003 2004 2005 2006 2007 2008 2009 2010 2011 2012 2013E 2014E 2015E 2016E 2017E 2018E (units in millions) Source: ALG TrueCar. Data represents used market vehicles aged seven years or less.
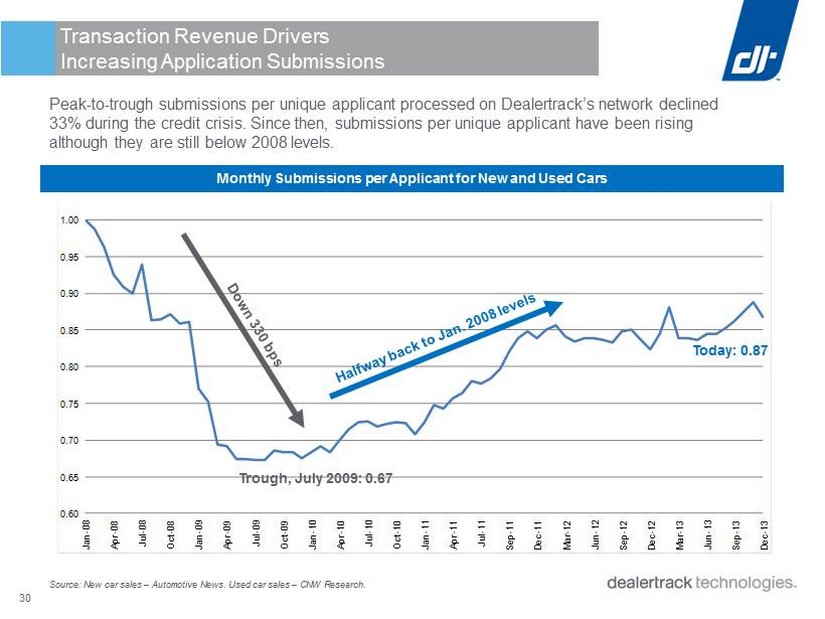
30 0.60 0.65 0.70 0.75 0.80 0.85 0.90 0.95 1.00 Jan - 08 Apr - 08 Jul - 08 Oct - 08 Jan - 09 Apr - 09 Jul - 09 Oct - 09 Jan - 10 Apr - 10 Jul - 10 Oct - 10 Jan - 11 Apr - 11 Jul - 11 Sep - 11 Dec - 11 Mar - 12 Jun - 12 Sep - 12 Dec - 12 Mar - 13 Jun - 13 Sep - 13 Dec - 13 Peak - to - trough submissions per unique applicant processed on Dealertrack’s network declined 33 % during the credit crisis. Since then, submissions per unique applicant have been rising although they are still below 2008 levels. Source : New car sales – Automotive News . Used car sales – CNW Research . Today: 0.87 Trough, July 2009: 0.67 Transaction Revenue Drivers Increasing Application Submissions Monthly Submissions per Applicant for New and Used Cars
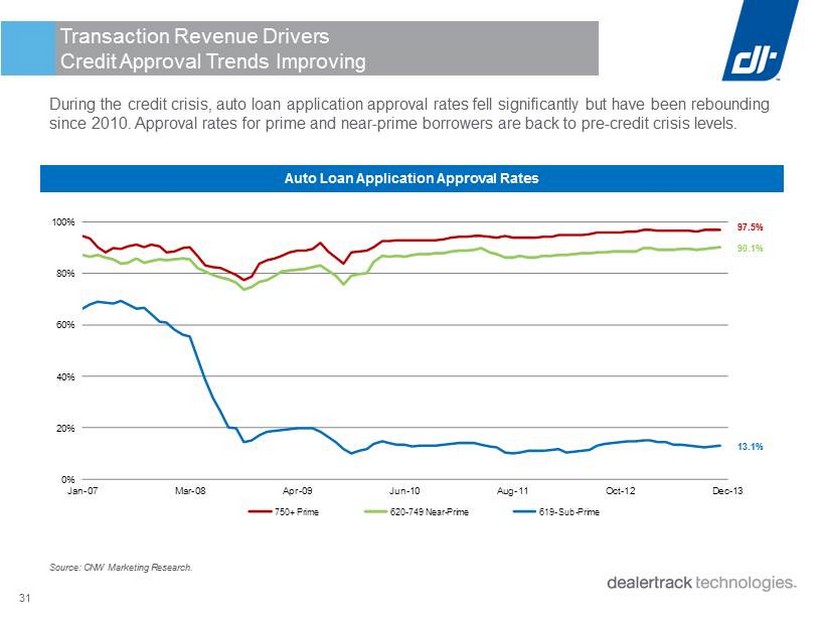
31 Source: CNW Marketing Research . During the credit crisis, auto loan application approval rates fell significantly but have been rebounding since 2010. Approval rates for prime and near - prime borrowers are back to pre - credit crisis levels . 0% 20% 40% 60% 80% 100% Jan - 07 Mar - 08 Apr - 09 Jun - 10 Aug - 11 Oct - 12 Dec - 13 750+ Prime 620 - 749 Near - Prime 619 - Sub - Prime 97.5% 90.1% 13.1% Transaction Revenue Drivers Credit Approval Trends Improving Auto Loan Application Approval Rates
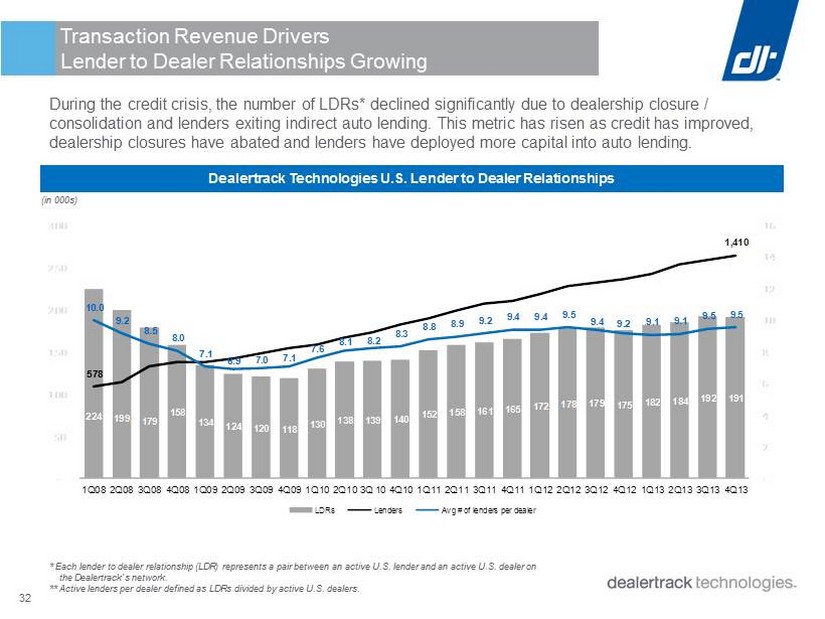
32 224 199 179 158 134 124 120 118 130 138 139 140 152 158 161 165 172 178 179 175 182 184 192 191 578 1,410 10.0 9.2 8.5 8.0 7.1 6.9 7.0 7.1 7.6 8.1 8.2 8.3 8.8 8.9 9.2 9.4 9.4 9.5 9.4 9.2 9.1 9.1 9.5 9.5 - 2 4 6 8 10 12 14 16 - 50 100 150 200 250 300 1Q08 2Q08 3Q08 4Q08 1Q09 2Q09 3Q09 4Q09 1Q10 2Q10 3Q 10 4Q10 1Q11 2Q11 3Q11 4Q11 1Q12 2Q12 3Q12 4Q12 1Q13 2Q13 3Q13 4Q13 LDRs Lenders Avg # of lenders per dealer During the credit crisis, the number of LDRs* declined significantly due to dealership closure / consolidation and lenders exiting indirect auto lending. This metric has risen as credit has improved, dealership closures have abated and lenders have deployed more capital into auto lending . * Each lender to dealer relationship (LDR) represents a pair between an active U.S. lender and an active U.S. dealer on the Dealertrack’s network . ** Active lenders per dealer defined as LDRs divided by active U.S. dealers. Transaction Revenue Drivers Lender to Dealer Relationships Growing Dealertrack Technologies U.S. Lender to Dealer Relationships (in 000s)

33 100 1,000 10,000 100,000 1,000,000 1985 1986 1987 1988 1989 1990 1991 1992 1993 1994 1995 1996 1997 1998 1999 2000 2001 2002 2003 2004 2005 2006 2007 2008 2009 2010 2011 2012 Auto Credit Cards Home Equity ($ in millions) Auto loan asset - backed securities (ABS) issuance is at its highest level since 2007 and continues to improve. Source: SIFMA US Asset - Backed Securities Issuance. Transaction Revenue Drivers Auto ABS Issuance is Strengthening Consumer Credit Trends

34 Other niche players ( Compliance / Menu / Desking) Other niche players Selected Competitive Landscape Note: Selected list may not include all competitors. DMS / Sales Subscription Products Credit Application Network Vehicle Registration / Title Management Inventory Management Solutions Interactive Solutions (Websites)
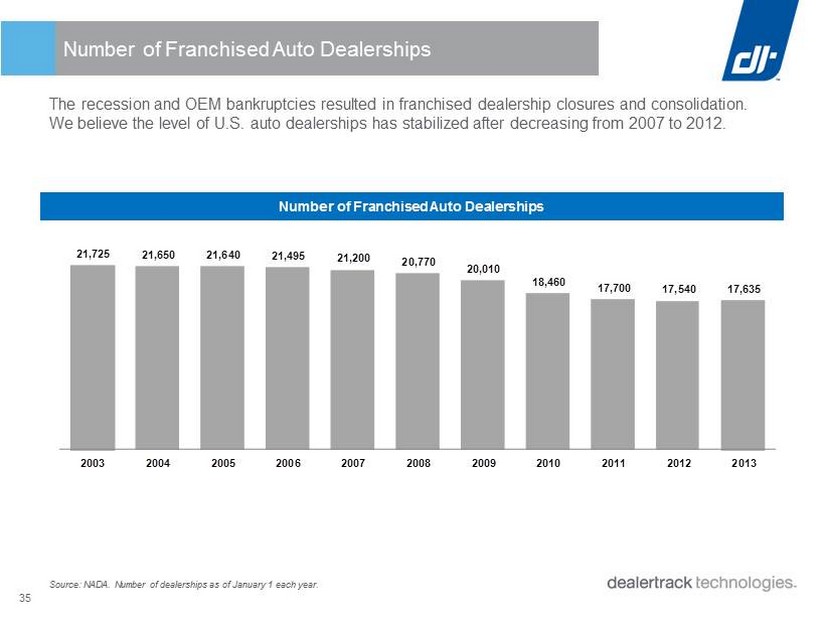
35 The recession and OEM bankruptcies resulted in franchised dealership closures and consolidation. We believe the level of U.S. auto dealerships has stabilized after decreasing from 2007 to 2012. 21,725 21,650 21,640 21,495 21,200 20,770 20,010 18,460 17,700 17,540 17,635 2003 2004 2005 2006 2007 2008 2009 2010 2011 2012 2013 Number of Franchised Auto Dealerships Source: NADA. Number of dealerships as of January 1 each year. Number of Franchised Auto Dealerships
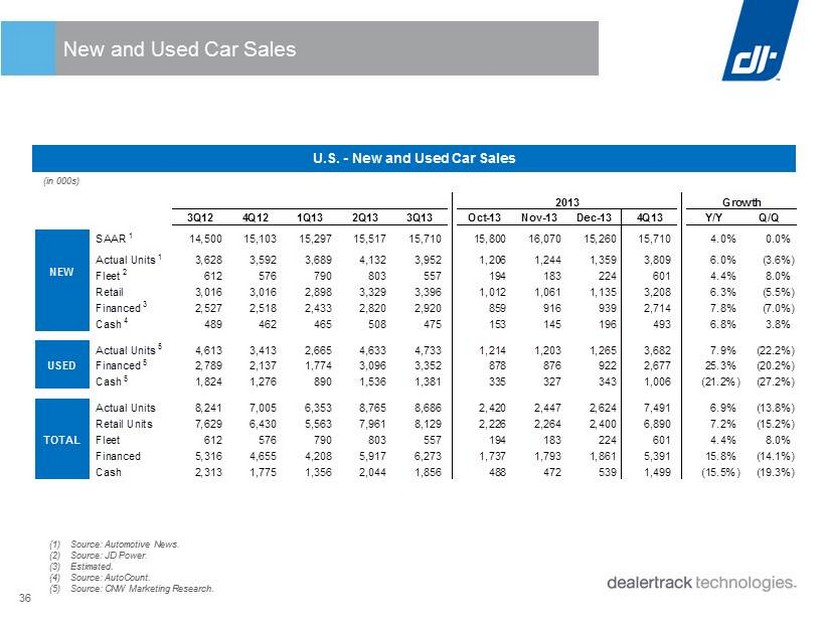
36 New and Used Car Sales 2013 Growth 3Q12 4Q12 1Q13 2Q13 3Q13 Oct-13 Nov-13 Dec-13 4Q13 Y/Y Q/Q SAAR 1 14,500 15,103 15,297 15,517 15,710 15,800 16,070 15,260 15,710 4.0% 0.0% Actual Units 1 3,628 3,592 3,689 4,132 3,952 1,206 1,244 1,359 3,809 6.0% (3.6%) Fleet 2 612 576 790 803 557 194 183 224 601 4.4% 8.0% Retail 3,016 3,016 2,898 3,329 3,396 1,012 1,061 1,135 3,208 6.3% (5.5%) Financed 3 2,527 2,518 2,433 2,820 2,920 859 916 939 2,714 7.8% (7.0%) Cash 4 489 462 465 508 475 153 145 196 493 6.8% 3.8% Actual Units 5 4,613 3,413 2,665 4,633 4,733 1,214 1,203 1,265 3,682 7.9% (22.2%) USED Financed 5 2,789 2,137 1,774 3,096 3,352 878 876 922 2,677 25.3% (20.2%) Cash 5 1,824 1,276 890 1,536 1,381 335 327 343 1,006 (21.2%) (27.2%) Actual Units 8,241 7,005 6,353 8,765 8,686 2,420 2,447 2,624 7,491 6.9% (13.8%) Retail Units 7,629 6,430 5,563 7,961 8,129 2,226 2,264 2,400 6,890 7.2% (15.2%) TOTAL Fleet 612 576 790 803 557 194 183 224 601 4.4% 8.0% Financed 5,316 4,655 4,208 5,917 6,273 1,737 1,793 1,861 5,391 15.8% (14.1%) Cash 2,313 1,775 1,356 2,044 1,856 488 472 539 1,499 (15.5%) (19.3%) NEW (1) Source: Automotive News. (2) Source: JD Power. (3) Estimated. (4) Source: AutoCount. (5) Source: CNW Marketing Research. U.S. - New and Used Car Sales (in 000s)
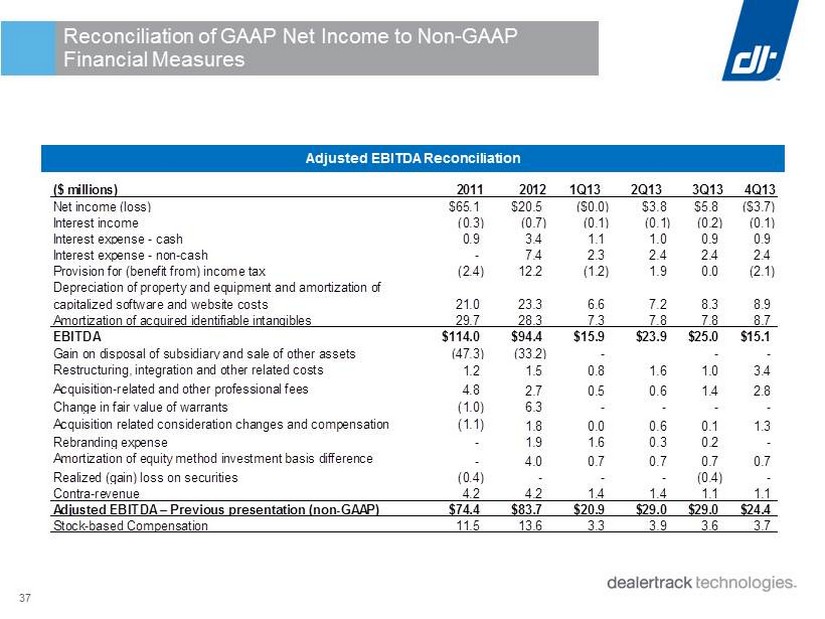
37 Reconciliation of GAAP Net Income to Non - GAAP Financial Measures Adjusted EBITDA Reconciliation ($ millions) 2011 2012 1Q13 2Q13 3Q13 4Q13 Net income (loss) $65.1 $20.5 ($0.0) $3.8 $5.8 ($3.7) Interest income (0.3) (0.7) (0.1) (0.1) (0.2) (0.1) Interest expense - cash 0.9 3.4 1.1 1.0 0.9 0.9 Interest expense - non-cash - 7.4 2.3 2.4 2.4 2.4 Provision for (benefit from) income tax (2.4) 12.2 (1.2) 1.9 0.0 (2.1) Depreciation of property and equipment and amortization of capitalized software and website costs 21.0 23.3 6.6 7.2 8.3 8.9 Amortization of acquired identifiable intangibles 29.7 28.3 7.3 7.8 7.8 8.7 EBITDA $114.0 $94.4 $15.9 $23.9 $25.0 $15.1 Gain on disposal of subsidiary and sale of other assets (47.3) (33.2) - - - Restructuring, integration and other related costs 1.2 1.5 0.8 1.6 1.0 3.4 Acquisition-related and other professional fees 4.8 2.7 0.5 0.6 1.4 2.8 Change in fair value of warrants (1.0) 6.3 - - - - Acquisition related consideration changes and compensation (1.1) 1.8 0.0 0.6 0.1 1.3 Rebranding expense - 1.9 1.6 0.3 0.2 - Amortization of equity method investment basis difference - 4.0 0.7 0.7 0.7 0.7 Realized (gain) loss on securities (0.4) - - - (0.4) - Contra-revenue 4.2 4.2 1.4 1.4 1.1 1.1 Adjusted EBITDA – Previous presentation (non-GAAP) $74.4 $83.7 $20.9 $29.0 $29.0 $24.4 Stock-based Compensation 11.5 13.6 3.3 3.9 3.6 3.7
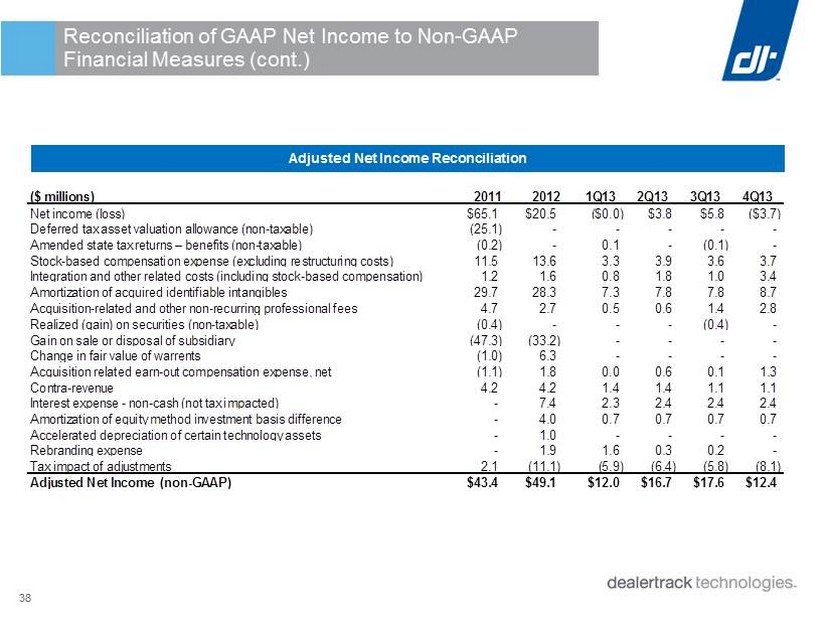
38 Reconciliation of GAAP Net Income to Non - GAAP Financial Measures (cont.) Adjusted Net Income Reconciliation ($ millions) 2011 2012 1Q13 2Q13 3Q13 4Q13 Net income (loss) $65.1 $20.5 ($0.0) $3.8 $5.8 ($3.7) Deferred tax asset valuation allowance (non-taxable) (25.1) - - - - - Amended state tax returns – benefits (non-taxable) (0.2) - 0.1 - (0.1) - Stock-based compensation expense (excluding restructuring costs) 11.5 13.6 3.3 3.9 3.6 3.7 Integration and other related costs (including stock-based compensation) 1.2 1.6 0.8 1.8 1.0 3.4 Amortization of acquired identifiable intangibles 29.7 28.3 7.3 7.8 7.8 8.7 Acquisition-related and other non-recurring professional fees 4.7 2.7 0.5 0.6 1.4 2.8 Realized (gain) on securities (non-taxable) (0.4) - - - (0.4) - Gain on sale or disposal of subsidiary (47.3) (33.2) - - - - Change in fair value of warrents (1.0) 6.3 - - - - Acquisition related earn-out compensation expense, net (1.1) 1.8 0.0 0.6 0.1 1.3 Contra-revenue 4.2 4.2 1.4 1.4 1.1 1.1 Interest expense - non-cash (not tax impacted) - 7.4 2.3 2.4 2.4 2.4 Amortization of equity method investment basis difference - 4.0 0.7 0.7 0.7 0.7 Accelerated depreciation of certain technology assets - 1.0 - - - - Rebranding expense - 1.9 1.6 0.3 0.2 - Tax impact of adjustments 2.1 (11.1) (5.9) (6.4) (5.8) (8.1) Adjusted Net Income (non-GAAP) $43.4 $49.1 $12.0 $16.7 $17.6 $12.4
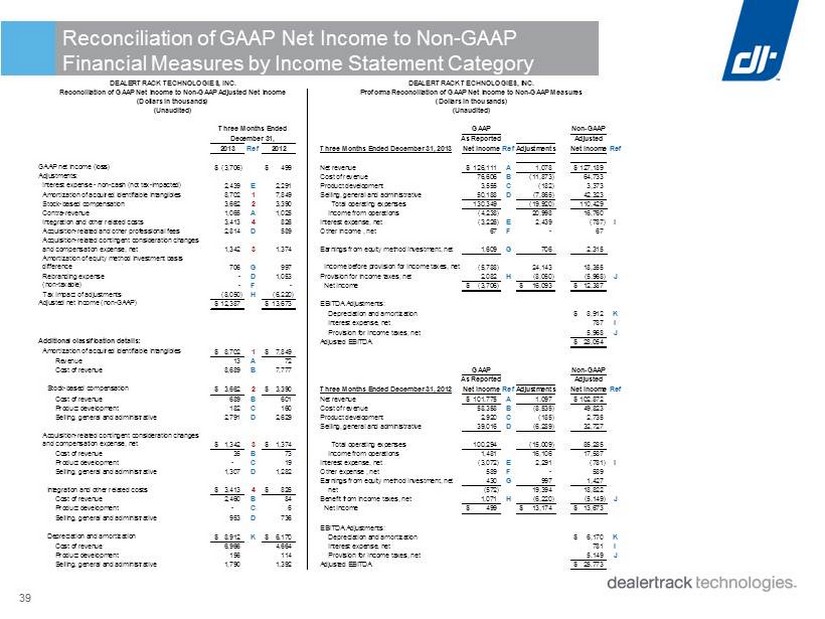
39 Reconciliation of GAAP Net Income to Non - GAAP Financial Measures by Income Statement Category GAAP Non-GAAP As Reported Adjusted 2013 Ref 2012 Three Months Ended December 31, 2013 Net IncomeRefAdjustments Net IncomeRef GAAP net income (loss) (3,706)$ 499$ Net revenue 126,111$ A 1,078 127,189$ Adjustments: Cost of revenue 76,606 B (11,873) 64,733 Interest expense - non-cash (not tax-impacted) 2,439 E 2,291 Product development 3,555 C (182) 3,373 Amortization of acquired identifiable intangibles 8,702 1 7,849 Selling, general and administrative 50,188 D (7,865) 42,323 Stock-based compensation 3,662 2 3,390 Total operating expenses 130,349 (19,920) 110,429 Contra-revenue 1,065 A 1,025 Income from operations (4,238) 20,998 16,760 Integration and other related costs 3,413 4 826 Interest expense, net (3,226) E 2,439 (787) I Acquisition-related and other professional fees 2,814 D 589 Other income , net 67 F - 67 Acquisition-related contingent consideration changes and compensation expense, net 1,342 3 1,374 Earnings from equity method investment, net 1,609 G 706 2,315 Amortization of equity method investment basis difference 706 G 997 Income before provision for income taxes, net (5,788) 24,143 18,355 Rebranding expense - D 1,053 Provision for income taxes, net 2,082 H (8,050) (5,968) J Realized gain on sale of previously impaired securities (non-taxable) - F - Net income (3,706)$ 16,093$ 12,387$ Tax impact of adjustments (8,050) H (6,220) Adjusted net income (non-GAAP) 12,387$ 13,673$ EBITDA Adjustments: Depreciation and amortization 8,912$ K Interest expense, net 787 I Provision for income taxes, net 5,968 J Additional classification details: Adjusted EBITDA 28,054$ Amortization of acquired identifiable intangibles 8,702$ 1 7,849$ Revenue 13 A 72 Cost of revenue 8,689 B 7,777 GAAP Non-GAAP As Reported Adjusted Stock-based compensation 3,662$ 2 3,390$ Three Months Ended December 31, 2012 Net IncomeRefAdjustments Net IncomeRef Cost of revenue 689 B 601 Net revenue 101,775$ A 1,097 102,872$ Product development 182 C 160 Cost of revenue 58,358 B (8,535) 49,823 Selling, general and administrative 2,791 D 2,629 Product development 2,920 C (185) 2,735 Selling, general and administrative 39,016 D (6,289) 32,727 Acquisition-related contingent consideration changes and compensation expense, net 1,342$ 3 1,374$ Total operating expenses 100,294 (15,009) 85,285 Cost of revenue 35 B 73 Income from operations 1,481 16,106 17,587 Product development - C 19 Interest expense, net (3,072) E 2,291 (781) I Selling, general and administrative 1,307 D 1,282 Other expense , net 589 F - 589 Earnings from equity method investment, net 430 G 997 1,427 Integration and other related costs 3,413$ 4 826$ Income before provision for income taxes, net (572) 19,394 18,822 Cost of revenue 2,460 B 84 Benefit from income taxes, net 1,071 H (6,220) (5,149) J Product development - C 6 Net income 499$ 13,174$ 13,673$ Selling, general and administrative 953 D 736 EBITDA Adjustments: Depreciation and amortization 8,912$ K 6,170$ Depreciation and amortization 6,170$ K Cost of revenue 6,966 4,664 Interest expense, net 781 I Product development 156 114 Provision for income taxes, net 5,149 J Selling, general and administrative 1,790 1,392 Adjusted EBITDA 25,773$ (Unaudited) (Unaudited) Three Months Ended December 31, DEALERTRACK TECHNOLOGIES, INC. DEALERTRACK TECHNOLOGIES, INC. Reconciliation of GAAP Net Income to Non-GAAP Adjusted Net Income Proforma Reconciliation of GAAP Net Income to Non-GAAP Measures (Dollars in thousands) (Dollars in thousands)
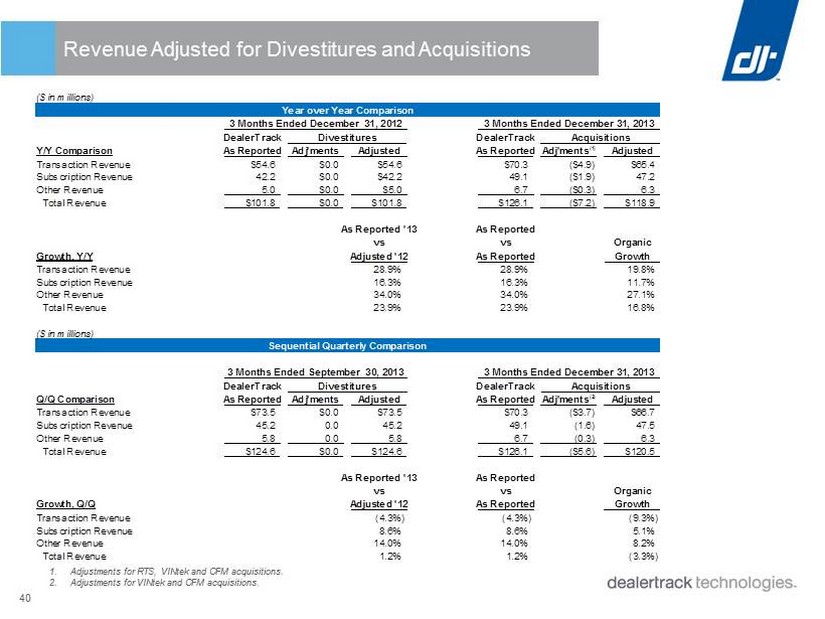
40 Revenue Adjusted for Divestitures and Acquisitions 1. Adjustments for RTS, VINtek and CFM acquisitions. 2. Adjustments for VINtek and CFM acquisitions. ($ in millions) Year over Year Comparison DealerTrack Divestitures DealerTrack Acquisitions Acquisitions Y/Y Comparison As Reported Adj'ments Adjusted As Reported Adj'ments (1) Adjusted Transaction Revenue $54.6 $0.0 $54.6 $70.3 ($4.9) $65.4 Subscription Revenue 42.2 $0.0 $42.2 49.1 ($1.9) 47.2 Other Revenue 5.0 $0.0 $5.0 6.7 ($0.3) 6.3 Total Revenue $101.8 $0.0 $101.8 $126.1 ($7.2) $118.9 As Reported '13 As Reported vs vs Organic Growth, Y/Y Adjusted '12 As Reported Growth Transaction Revenue 28.9% 28.9% 19.8% Subscription Revenue 16.3% 16.3% 11.7% Other Revenue 34.0% 34.0% 27.1% Total Revenue 23.9% 23.9% 16.8% ($ in millions) Sequential Quarterly Comparison DealerTrack Divestitures DealerTrack Acquisitions AcquiSitionS Q/Q Comparison As Reported Adj'ments Adjusted As Reported Adj'ments (2) Adjusted Transaction Revenue $73.5 $0.0 $73.5 $70.3 ($3.7) $66.7 Subscription Revenue 45.2 0.0 45.2 49.1 (1.6) 47.5 Other Revenue 5.8 0.0 5.8 6.7 (0.3) 6.3 Total Revenue $124.6 $0.0 $124.6 $126.1 ($5.6) $120.5 As Reported '13 As Reported vs vs Organic Growth, Q/Q Adjusted '12 As Reported Growth Transaction Revenue (4.3%) (4.3%) (9.3%) Subscription Revenue 8.6% 8.6% 5.1% Other Revenue 14.0% 14.0% 8.2% Total Revenue 1.2% 1.2% (3.3%) 3 Months Ended December 31, 2012 3 Months Ended September 30, 2013 3 Months Ended December 31, 2013 3 Months Ended December 31, 2013
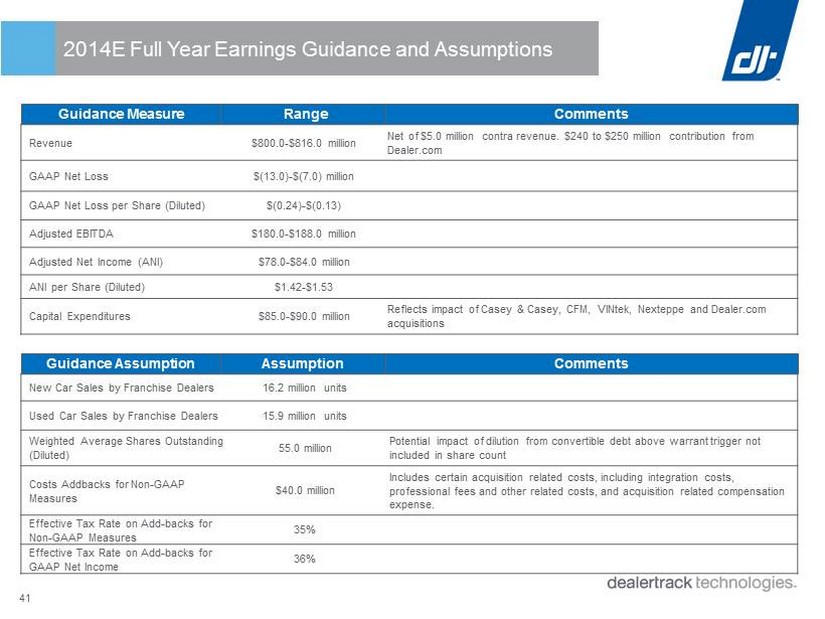
41 2014E Full Year Earnings Guidance and Assumptions New Car Sales by Franchise Dealers 16.2 million units Used Car Sales by Franchise Dealers 15.9 million units Weighted Average Shares Outstanding (Diluted) 55.0 million Potential impact of dilution from convertible debt above warrant trigger not included in share count Costs Addbacks for Non - GAAP Measures $40.0 million Includes certain acquisition related costs, including integration costs, professional fees and other related costs, and acquisition related compensation expense. Effective Tax Rate on Add - backs for Non - GAAP Measures 35% Effective Tax Rate on Add - backs for GAAP Net Income 36% Revenue $800.0 - $816.0 million Net of $5.0 million contra revenue. $240 to $250 million contribution from Dealer.com GAAP Net Loss $(13.0) - $(7.0) million GAAP Net Loss per Share (Diluted) $(0.24) - $(0.13) Adjusted EBITDA $180.0 - $188.0 million Adjusted Net Income (ANI) $78.0 - $84.0 million ANI per Share (Diluted) $1.42 - $1.53 Capital Expenditures $85.0 - $90.0 million Reflects impact of Casey & Casey, CFM, VINtek, Nexteppe and Dealer.com acquisitions Guidance Measure Range Comments Guidance Assumption Assumption Comments