Attached files
| file | filename |
|---|---|
| 8-K - 8-K - CF Industries Holdings, Inc. | a14-3790_38k.htm |
Exhibit 99.1
|
|
2013 Fourth Quarter Financial Results February 19, 2014 NYSE: CF |
|
|
Safe Harbor Statement All statements in this communication, other than those relating to historical facts, are “forward-looking statements.” These forward-looking statements are not guarantees of future performance and are subject to a number of assumptions, risks and uncertainties, many of which are beyond our control, which could cause actual results to differ materially from such statements. These statements include, but are not limited to, statements about the benefits, expected timing of closing and other aspects of the proposed transactions with Mosaic; statements about future strategic plans; and statements about future financial and operating results. Important factors that could cause actual results to differ materially from our expectations include, among others: risks and uncertainties arising from the possibility that the proposed transactions with Mosaic may be delayed or may not occur, including delays arising from any ability to obtain governmental approvals of the transactions; the risk that other conditions to the closing of the proposed transactions with Mosaic may not be satisfied; difficulties with realization of the benefits of the proposed transactions with Mosaic; the risk that disruptions from the proposed transactions with Mosaic will harm relationships with customers, employees and suppliers; the volatility of natural gas prices in North America; the cyclical nature of our business and the agricultural sector; the global commodity nature of our fertilizer products, the impact of global supply and demand on our selling prices, and the intense global competition from other fertilizer producers; conditions in the U.S. agricultural industry; reliance on third party providers of transportation services and equipment; risks associated with cyber security; weather conditions; our ability to complete our production capacity expansion projects on schedule as planned and on budget or at all; risks associated with other expansions of our business, including unanticipated adverse consequences and the significant resources that could be required; potential liabilities and expenditures related to environmental and health and safety laws and regulations; our potential inability to obtain or maintain required permits and governmental approvals or to meet financial assurance requirements from governmental authorities; future regulatory restrictions and requirements related to greenhouse gas emissions; the seasonality of the fertilizer business; the impact of changing market conditions on our forward sales programs; risks involving derivatives and the effectiveness of our risk measurement and hedging activities; the significant risks and hazards involved in producing and handling our products against which we may not be fully insured; our reliance on a limited number of key facilities; risks associated with joint ventures; acts of terrorism and regulations to combat terrorism; difficulties in securing the supply and delivery of raw materials, increases in their costs or delays or interruptions in their delivery; risks associated with international operations; losses on our investments in securities; deterioration of global market and economic conditions; our ability to manage our indebtedness; and loss of key members of management and professional staff. More detailed information about factors that may affect our performance may be found in our filings with the Securities and Exchange Commission, including our most recent periodic reports filed on Form 10-K and Form 10-Q, which are available in the Investor Relations section of the CF Industries Web site. Forward-looking statements are given only as of the date of this release and we disclaim any obligation to update or revise the forward-looking statements, whether as a result of new information, future events or otherwise, except as required by law. |
|
|
Fourth Quarter Highlights $643 million EBITDA and $5.71 Diluted EPS despite urea market testing floor prices Entered into set of strategic agreements with the Mosaic Company including: Sale of phosphate business for $1.4 billion Long-term ammonia supply agreement for 600,000 and 800,000 tons of ammonia per year, providing a defined margin independent of gas costs Repurchased 1.5 million shares at an average price of $223 for $338 million Increased quarterly dividend by 150% to $1.00 per share Operated ammonia plants at system-wide 107% of average stated capacity Opportunistically exported all four major forms of nitrogen 3 |
|
|
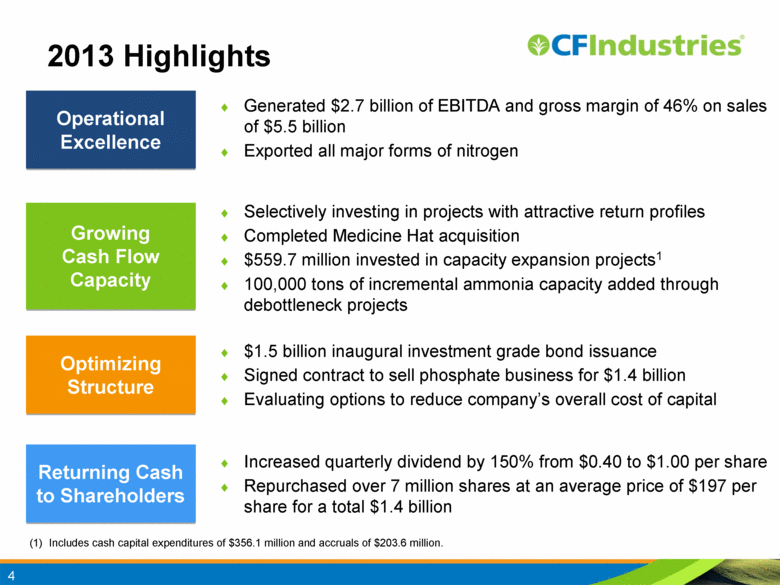
2013 Highlights 4 Generated $2.7 billion of EBITDA and gross margin of 46% on sales of $5.5 billion Exported all major forms of nitrogen Operational Excellence Selectively investing in projects with attractive return profiles Completed Medicine Hat acquisition $559.7 million invested in capacity expansion projects1 100,000 tons of incremental ammonia capacity added through debottleneck projects Growing Cash Flow Capacity Increased quarterly dividend by 150% from $0.40 to $1.00 per share Repurchased over 7 million shares at an average price of $197 per share for a total $1.4 billion Returning Cash to Shareholders $1.5 billion inaugural investment grade bond issuance Signed contract to sell phosphate business for $1.4 billion Evaluating options to reduce company’s overall cost of capital Optimizing Structure (1) Includes cash capital expenditures of $356.1 million and accruals of $203.6 million. |
|
|
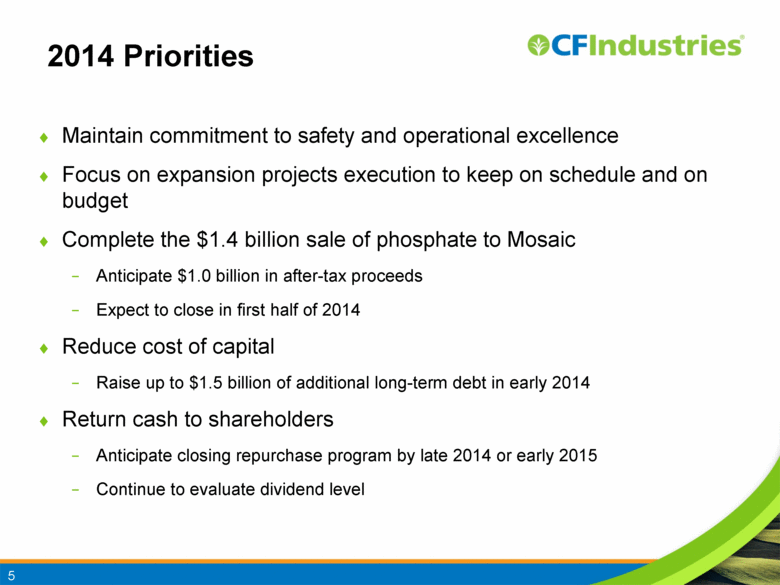
2014 Priorities Maintain commitment to safety and operational excellence Focus on expansion projects execution to keep on schedule and on budget Complete the $1.4 billion sale of phosphate to Mosaic Anticipate $1.0 billion in after-tax proceeds Expect to close in first half of 2014 Reduce cost of capital Raise up to $1.5 billion of additional long-term debt in early 2014 Return cash to shareholders Anticipate closing repurchase program by late 2014 or early 2015 Continue to evaluate dividend level 5 |
|
|
Strategic Advantages North American natural gas cost advantage Network of production, logistical and distribution assets Experienced, high-performance team 6 |
|
|
7 Excludes 34% of Canadian Fertilizers Limited (CFL) that was owned by Viterra. CFL operations were treated as a consolidated variable interest entity in CF Industries Holdings, Inc. financial statements. Approved ammonia debottleneck projects that have been completed. Acquisition of all outstanding interests in CFL closed April 30, 2013. Includes ammonia debottleneck projects that were completed in 2013. As of February 14, 2014, the company had 55.2 million shares outstanding and $1.4 billion of remaining share repurchase authorization. New plant construction projects. CF Industries Nitrogen Volumes and Shares Outstanding Million Nutrient Tons Million Shares Outstanding Share Count April 30, 2013 April 30, 2010 Jan. 31, 2013 Increased cash flow capacity as measured by N/1000 shares by over 125% since 2010 Capacity projects underway will increase total N capacity by 25% Repurchased 0.7 million shares since January 1, 2014 at an average price of $230 Remaining share repurchase authorization of $1.4 billion as of February 14, 2014 (4) 53.5 87.2 100.0 111.3 121.6 Total N tons per 1,000 shares Increasing Cash Flow Per Share |
|
|
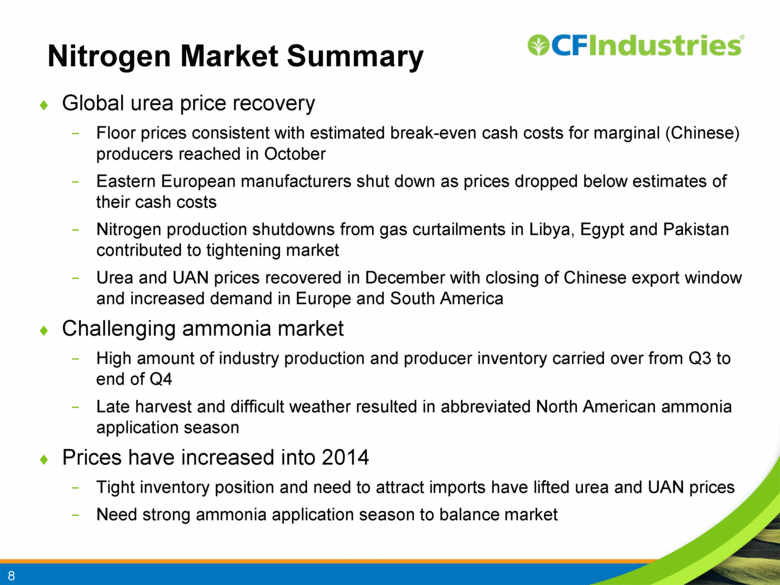
Nitrogen Market Summary Global urea price recovery Floor prices consistent with estimated break-even cash costs for marginal (Chinese) producers reached in October Eastern European manufacturers shut down as prices dropped below estimates of their cash costs Nitrogen production shutdowns from gas curtailments in Libya, Egypt and Pakistan contributed to tightening market Urea and UAN prices recovered in December with closing of Chinese export window and increased demand in Europe and South America Challenging ammonia market High amount of industry production and producer inventory carried over from Q3 to end of Q4 Late harvest and difficult weather resulted in abbreviated North American ammonia application season Prices have increased into 2014 Tight inventory position and need to attract imports have lifted urea and UAN prices Need strong ammonia application season to balance market 8 |
|
|
9 China Cost: High Tax Period Low Tax Period Western Europe Ukraine DF Group $0 $100 $200 $300 $400 0 50 100 150 200 250 Estimated High Tax Period Floor Algeria Middle East $0 $2 $4 $6 $8 $10 $12 2009 2010 2011 2012 2013 Henry Hub Price Zeebrugge Cash Price -40 -30 -20 -10 0 10 20 30 40 J13 F M A M J J A S O N D J14 Encourages Imports Discourages Imports 0 2 4 6 8 10 2010 2011 2012 2013E 2014F 2015F 2016F 2017F 2018F Ammonia Urea UAN AN Source: TFI, USDOC, CF Note: Fertilizer Year Source: Fertecon, Green Markets, CF Industries Market Highlights Source: Industry publications, CF Industries $/ton Millions of Product Tons Other Africa North America Egypt Other LatAm Eastern Europe China (Gas) China (Anthracite) Low Other FSU China (Anthracite) High Ukraine OPZ China (Thermal) Russia Low Russia Base South Asia Southeast Asia Trinidad + Venezuela Demand: 180 mil. short tons Henry Hub Natural Gas Price vs. Zeebrugge Index (U.S. Dollars per MMBtu) Delivered Price Differential – U.S. Gulf vs. Middle East (U.S. Dollars per Ton) U.S. Gulf traded below M. East delivered through fall Source: PIRA, IFERC 2014 Urea Cost Curve North American Nitrogen Imports (Millions of Nutrient Tons) |
|
|
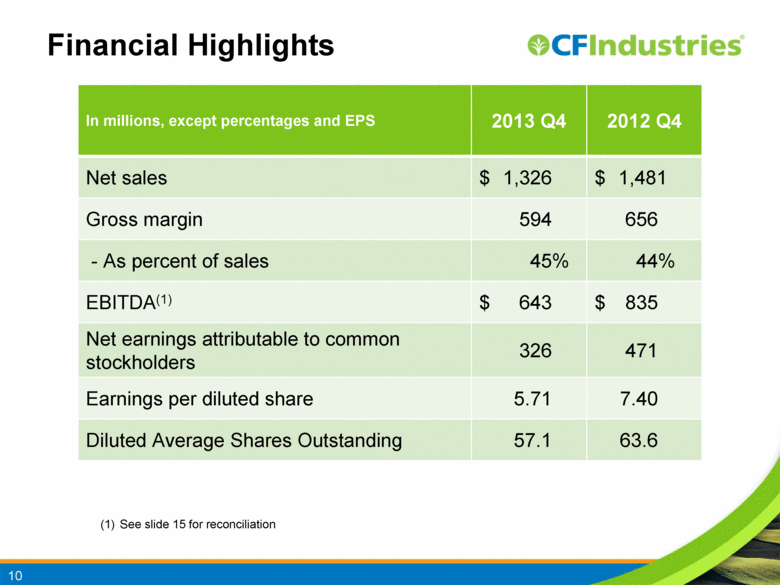
Financial Highlights 10 In millions, except percentages and EPS 2013 Q4 2012 Q4 Net sales $ 1,326 $ 1,481 Gross margin 594 656 - As percent of sales 45% 44% EBITDA(1) $ 643 $ 835 Net earnings attributable to common stockholders 326 471 Earnings per diluted share 5.71 7.40 Diluted Average Shares Outstanding 57.1 63.6 (1) See slide 15 for reconciliation |
|
|
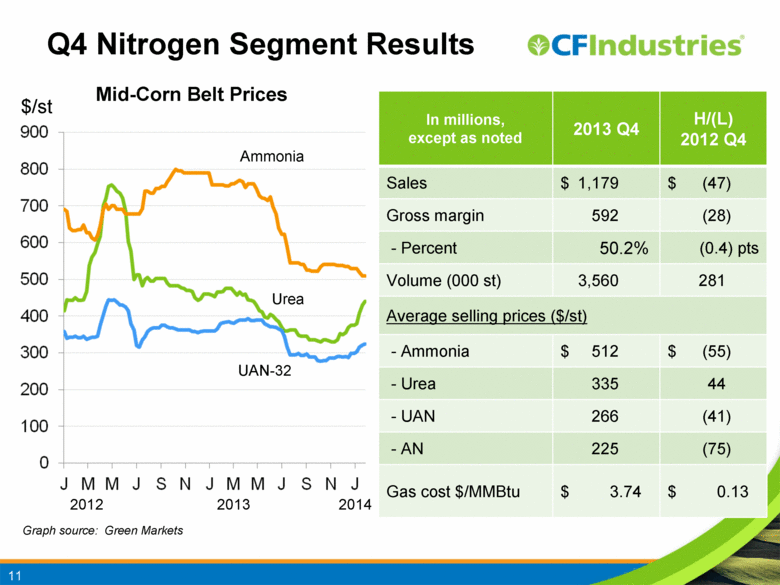
Q4 Nitrogen Segment Results In millions, except as noted 2013 Q4 H/(L) 2012 Q4 Sales $ 1,179 $ (47) Gross margin 592 (28) - Percent 50.2% (0.4) pts Volume (000 st) 3,560 281 Average selling prices ($/st) - Ammonia $ 512 $ (55) - Urea 335 44 - UAN 266 (41) - AN 225 (75) Gas cost $/MMBtu $ 3.74 $ 0.13 11 Mid-Corn Belt Prices $/st Graph source: Green Markets Ammonia Urea UAN-32 2012 2013 2014 |
|
|
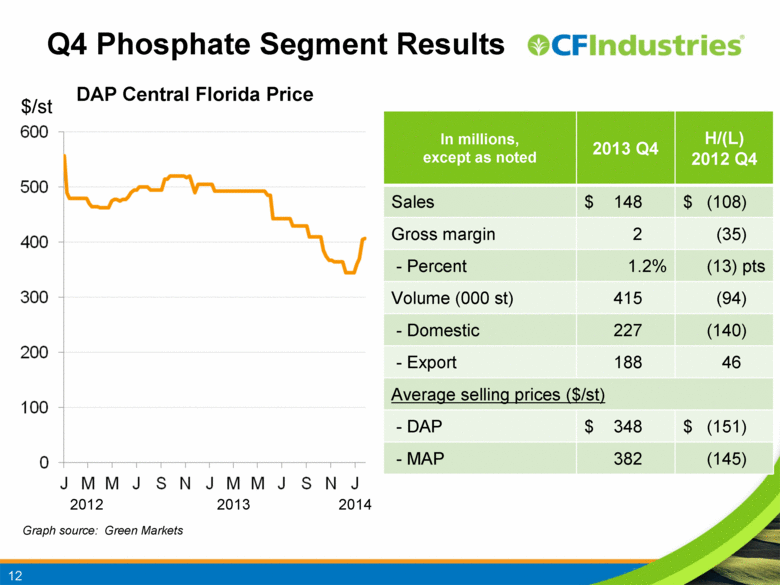
In millions, except as noted 2013 Q4 H/(L) 2012 Q4 Sales $ 148 $ (108) Gross margin 2 (35) - Percent 1.2% (13) pts Volume (000 st) 415 (94) - Domestic 227 (140) - Export 188 46 Average selling prices ($/st) - DAP $ 348 $ (151) - MAP 382 (145) Q4 Phosphate Segment Results 12 Graph source: Green Markets DAP Central Florida Price $/st 2012 2013 2014 |
|
|
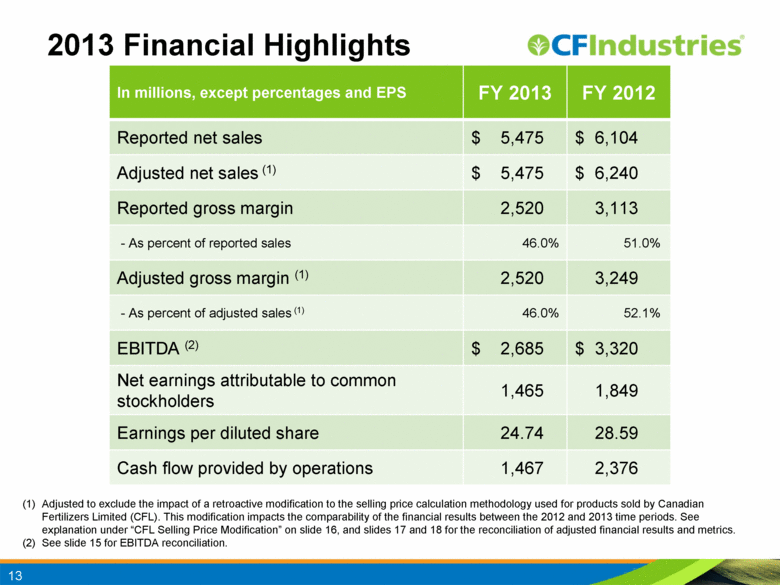
2013 Financial Highlights 13 (1) Adjusted to exclude the impact of a retroactive modification to the selling price calculation methodology used for products sold by Canadian Fertilizers Limited (CFL). This modification impacts the comparability of the financial results between the 2012 and 2013 time periods. See explanation under “CFL Selling Price Modification” on slide 16, and slides 17 and 18 for the reconciliation of adjusted financial results and metrics. (2) See slide 15 for EBITDA reconciliation. In millions, except percentages and EPS FY 2013 FY 2012 Reported net sales $ 5,475 $ 6,104 Adjusted net sales (1) $ 5,475 $ 6,240 Reported gross margin 2,520 3,113 - As percent of reported sales 46.0% 51.0% Adjusted gross margin (1) 2,520 3,249 - As percent of adjusted sales (1) 46.0% 52.1% EBITDA (2) $ 2,685 $ 3,320 Net earnings attributable to common stockholders 1,465 1,849 Earnings per diluted share 24.74 28.59 Cash flow provided by operations 1,467 2,376 |
|
|
For more information, please visit www.cfindustries.com 14 |
|
|
EBITDA and Selected Items 15 (in millions) Three months ended December 31, Twelve months ended December 31, 2013 2012 2013 2012 Net earnings attributable to common stockholders $ 325.8 $ 470.7 $ 1,464.6 $ 1,848.7 Interest expense (income) – net 39.2 28.1 147.5 131.0 Income taxes 187.2 241.9 686.5 963.8 Depreciation, depletion and amortization 96.8 101.1 410.6 419.8 Less: Other adjustments(1) (6.0) (6.6) (24.3) (43.1) EBITDA(1) $ 643.0 $ 835.2 $ 2,684.9 $ 3,320.2 Memo: Selected items included above Unrealized mark-to-market gains on natural gas derivatives $ (54.0) $ (5.0) $ (52.9) $ (66.5) Gains on foreign currency derivatives (6.5) (8.1) (20.8) (8.1) Early write-off of loan fees - - - 15.2 Provision for liability to pre-IPO owners for NOL settlement - - 55.2 - Retiree medical curtailment - - - (10.9) Total $ (60.5) $ (13.1) $ (18.5) $ (70.3) (1) EBITDA is defined as net earnings attributable to common stockholders plus interest expense (income)-net, income taxes, and depreciation, depletion and amortization. Other adjustments include the elimination of loan fee amortization that is included in both interest and amortization, and the portion of depreciation that is included in non-controlling interest. We have presented EBITDA because management uses the measure to track performance and believes that it is frequently used by securities analysts, investors and other interested parties in the evaluation of companies in our industry. |
|
|
CFL Selling Price Modifications 16 Prior to April 30, 2013, CF Industries, Inc. (CF Industries) owned 49% of the voting common shares and 66% of the non-voting preferred shares of Canadian Fertilizers Limited (CFL), an Alberta, Canada based nitrogen fertilizer manufacturer and had the right to purchase 66% of the production of CFL. Also prior to April 30, 2013, Viterra, Inc. (Viterra) held 34% of the equity ownership of CFL and had the right to purchase up to 34% of CFL’s production. Both CF Industries and Viterra were entitled to receive distributions of net earnings of CFL based upon their respective purchases from CFL. CFL was a variable interest entity that was consolidated in the Company’s financial statements. On April 30, 2013, CF Industries completed the acquisitions of all of the outstanding interests in CFL that it did not already own and CFL became a wholly owned subsidiary of the Company. CF Industries’ and Viterra’s purchases of nitrogen fertilizer products from CFL were made under product purchase agreements, and the selling prices were determined under the provisions of these agreements. An initial selling price was paid to CFL based upon CFL’s production cost plus an agreed-upon margin once title passed as the product was shipped. At the end of the year, the difference between the market price of products purchased from CFL and the price based on production cost plus an agreed-upon margin was paid to CFL. The sales revenue attributable to this difference was accrued by the Company on an interim basis. Until April 30, 2013 when CFL became a wholly owned subsidiary in the Company’s financial statements, net sales and accounts receivable attributable to CFL were solely generated by transactions with Viterra, as all transactions with CF Industries were eliminated in consolidation in the Company’s financial statements. In the fourth quarter of 2012, the CFL Board of Directors approved amendments to the product purchase agreements retroactive to January 1, 2012 that modified the selling prices that CFL charged for products sold to Viterra and CF Industries which eliminated the requirement to pay to CFL the difference between the market price and the price based on production cost plus an agreed-upon margin. The following summarizes the selling prices in the product purchase agreements that impacted the Company’s results both before and after the effective date of the amendment. For 2012 and between January 1, 2013 and April 30, 2013, the Company’s consolidated financial statements reflect production cost plus an agreed-upon margin based selling prices for products purchased from CFL including sales made by CFL to Viterra. Starting on April 30, 2013, CFL became a wholly owned subsidiary of CF Industries. Once CFL became a wholly owned subsidiary, CF industries began purchasing all of the output of CFL for resale and reported those sales in its consolidated financial statements at market based selling prices. As a result, the financial results for 2013 include four months of selling prices based on production cost plus an agreed-upon margin and eight months of market based selling prices. These selling price amendments to the product purchase agreements impact the comparability of the Company’s financial results. These changes affect the year-over-year comparability of net sales, gross margin, operating earnings, earnings before income taxes and net earnings attributable to noncontrolling interest, but do not impact the comparability of the Company’s net earnings attributable to common stockholders or net cash flows for the same period. In order to provide comparable information for the periods presented, certain financial information is being provided for the prior year comparable periods adjusted as if the current year CFL pricing calculation pattern of four months of cost based pricing and eight months of market based pricing had been used in the prior year comparable periods. |
|
|
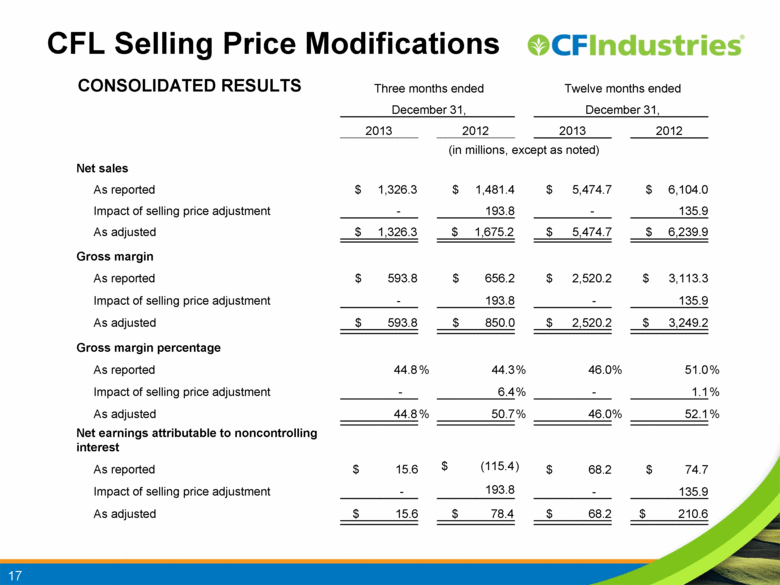
17 CFL Selling Price Modifications CONSOLIDATED RESULTS Three months ended Twelve months ended December 31, December 31, 2013 2012 2013 2012 (in millions, except as noted) Net sales As reported $ 1,326.3 $ 1,481.4 $ 5,474.7 $ 6,104.0 Impact of selling price adjustment - 193.8 - 135.9 As adjusted $ 1,326.3 $ 1,675.2 $ 5,474.7 $ 6,239.9 Gross margin As reported $ 593.8 $ 656.2 $ 2,520.2 $ 3,113.3 Impact of selling price adjustment - 193.8 - 135.9 As adjusted $ 593.8 $ 850.0 $ 2,520.2 $ 3,249.2 Gross margin percentage As reported 44.8 % 44.3 % 46.0 % 51.0 % Impact of selling price adjustment - 6.4 % - 1.1 % As adjusted 44.8 % 50.7 % 46.0 % 52.1 % Net earnings attributable to noncontrolling interest As reported $ 15.6 $ (115.4 ) $ 68.2 $ 74.7 Impact of selling price adjustment - 193.8 - 135.9 As adjusted $ 15.6 $ 78.4 $ 68.2 $ 210.6 |
|
|
18 Three months ended Twelve months ended NITROGEN SEGMENT DATA December 31, December 31, 2013 2012 2013 2012 (in millions, except as noted) Net sales As reported $ 1,178.7 $ 1,225.6 $ 4,677.8 $ 5,096.6 Impact of selling price adjustment - 193.8 - 135.9 As adjusted $ 1,178.7 $ 1,419.4 $ 4,677.8 $ 5,232.5 Gross margin As reported $ 592.1 $ 620.0 $ 2,445.3 $ 2,913.6 Impact of selling price adjustment - 193.8 - 135.9 As adjusted $ 592.1 $ 813.8 $ 2,445.3 $ 3,049.5 Gross margin percentage As reported 50.2 % 50.6 % 52.3 % 57.2 % Impact of selling price adjustment - 6.7 % - 1.1 % As adjusted 50.2 % 57.3 % 52.3 % 58.3 % Average selling prices (dollars per ton) Ammonia As reported $ 512 $ 567 $ 592 $ 602 Impact of selling price adjustment - 113 - 26 As adjusted $ 512 $ 680 $ 592 $ 628 Granular urea As reported $ 335 $ 291 $ 369 $ 441 Impact of selling price adjustment - 158 - 24 As adjusted $ 335 $ 449 $ 369 $ 465 CFL Selling Price Modifications |

