Attached files
| file | filename |
|---|---|
| 8-K - 8-K - NOVANTA INC | d678940d8k.htm |
 Investor Presentation
February 19, 2014
Exhibit 99.1 |
 Page 2
Forward-Looking Statements
The
statements
in
this
presentation
that
relate
to
guidance,
pro
forma
presentations,
and
future
plans,
goals,
business opportunities, events or performance are forward-looking statements that involve risks and
uncertainties, including risks associated with business and economic conditions, failure to
achieve expected benefits of the JADAK acquisition, failure to successfully integrate current and
future acquisitions, including JADAK, into our business, customer and/or supplier contract
cancellations, manufacturing risks, competitive factors, ability to successfully introduce new
products, uncertainties pertaining to customer orders,
demand
for
products
and
services,
growth
and
development
of
markets
for
the
Company's
products
and services, and other risks identified in our filings made with the Securities and Exchange
Commission. Actual results, events and performance may differ materially. Readers are
cautioned not to place undue reliance on these forward-looking statements, which speak only
as of the date of this presentation. The Company disclaims any obligation to update these
forward-looking statements as a result of developments occurring after the date of this
presentation. Readers are encouraged to refer to the risk disclosures described in the
Company’s Form 10-K for the year ended December 31, 2012 and subsequent filings with the
SEC, as applicable. Non-GAAP Measures
In this presentation, we present the non-GAAP financial measures of Adjusted EBITDA , free cash flow
and net
debt
.
Please
see
“Use
of
Non-GAAP
Financial
Measures”
and
the
subsequent
slides
in
the
Appendix
to
this presentation for the reasons we use these measures, a reconciliation of these measures to the most
directly
comparable
GAAP
measures
and
other
information
relating
to
these
measures.
The Company neither updates nor confirms any guidance regarding the future operating results of the
Company which may have been given prior to this presentation.
Note factors affecting future performance…
…and use of Non-GAAP financial measures |
 Our
aspirations… 2012 Strategic Vision
A leading provider of precision photonic and
motion technologies for OEM’s in demanding
markets –
delivering attractive shareholder
returns through sustained profitable growth
Strategic Priorities
•
Organic growth mid to high single
digits
•
>20% Adj. EBITDA margins
•
Long term shareholder returns
above peer average
Performance Goals
Page 3
•
Accelerate growth (organic and M&A)
•
Improve mix (growth, volatility) –
more Medical, less Semiconductor
•
Strive to become a world class
operating company
…are
clear
and
achievable |
 …to achieve our
strategic goals JADAK Technologies Inc.
“A significant milestone in our overall medical strategy to offer
a broad range
of enabling technologies to medical OEM’s.”
“A growing, profitable business with a strong management team and
an
exceptional customer and technology franchise.”
“A leader in data collection and machine vision technologies that
make
medical equipment safer, assure accuracy and reduce medical errors.”
Our acquisition of JADAK…
…further enhances our growing medical technology franchise
Page 4 |
 …to achieve our
strategic goals JADAK Profile
JADAK is a strong technology company…
…with an excellent medical market presence
•
Leading provider of component level machine vision, auto ID, and
RFID technologies
to medical equipment OEM’s
•
Founded in 2000 -
based in N. Syracuse, NY –
130 employees -
privately owned
•
Revenue $50M+, EBITDA margins in high teens –
revenue doubled in past 5 years
•
Products sold to OEM’s for integration into a wide range of medical equipment
•
Exceptional technology and customer franchise –
strong relationships with premier
medical OEM’s
Page 5 |
 JADAK has four
major product categories… Embedded
Components
Fixed Mount and
Smart Cameras
Handheld
Scanners
Machine Vision
Software
•
Barcode Options
•
Machine Vision
Options
•
RFID Options
•
Barcode Options
•
Machine Vision
Options
•
RFID Options
•
Corded / Wireless
Options
•
Medical Grade
•
Highly Customizable
•
Works on all
platforms
•
Allows user to
configure code
JADAK Product Lines
Page 6
…which are sold to major OEM customers |
 …for leading OEMs in numerous medical applications
JADAK provides optical scanning technology…
Clinical Analysis
Equipment
Patient Monitors
Surgical Tools
Pharmacy Carts
Barcode
Optics Module
JADAK Applications
Portable Glucose Monitors
*
* VDC Research
CAGR 8%
Page 7
$0
$20
$40
$60
$80
$100
$120
$140
2011
2012
2013
2014
2015
2016
2017
Bar Code Scanning in Heathcare ($M) |
 …through numerous dimensions
JADAK creates sustainable OEM relationships…
JADAK Customer Value Proposition
Medical OEM Customers
Medical OEM Customers
Page 8 |
 Common customers, application areas and channels with
existing GSI medical business
–
enables
medical
“key
account”
sales
strategy
Core
technologies
are
familiar
to
GSI
-
based
on
optoelectronic
image
sensor
technologies with significant application specific development
JADAK’s OEM business model
is virtually identical to GSI’s from technology
development to sales cycle to production
JADAK
brings
predictable,
profitable
growth
to
GSI
portfolio
–
growth
is
driven
by reductions in medical errors (improved safety)
The management team
is stable, cohesive and has demonstrated a long term
commitment
to
the
business
and
the
local
community
which
reduces
risk
JADAK is a strong fit…
…with GSI’s strategy and core competencies
Strategic Fit
Page 9 |
 We
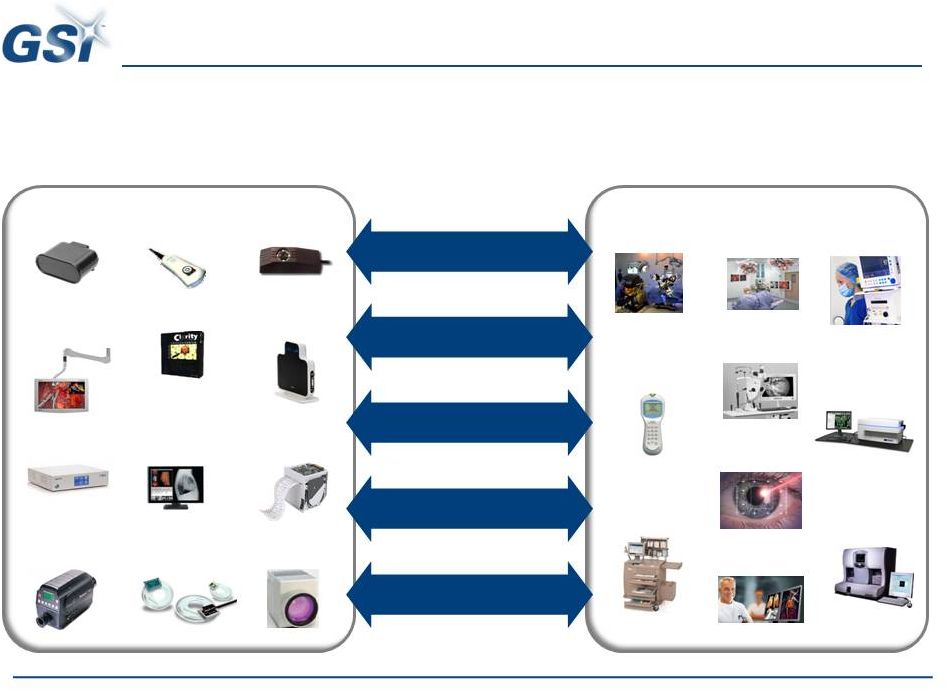
will offer a dozen medical enabling technologies… …to major
OEM’s in numerous applications Go Forward Medical Business
Page 10
Bar Code
Scanning
RFID
Machine
Vision
Surgical
Displays
Radiology
Displays
Wireless
Networking
Optical
Encoders
Thermal
Printers
Color
Analyzers
Software
Informatics
Laser
Scanning
Enabling Technologies
Major Applications
Blood
Analysis
Robotic
Surgery
Minimally
Invasive
Surgery
Radiology
Glucose
Monitoring
Drug
Delivery
Patient
Monitoring
Life
Sciences
Laser
Surgery
Retinal
Diagnostics
~$170M annual sales
Precision Technologies
Key Account Sales Force
Medical Quality System
OEM Design-in Expertise |
 With
this transaction… …
the medical space is our largest market
Laser
Products
Medical
Technologies
Scientific
Medical
Micro-
electronics
GSI Pro Forma (w/ JADAK)
Industrial
Precision
Motion
Product Groups
End Market Mix
* Data presented represents last nine months, ended 3Q 2013, adjusted for
Jadak’s impact on GSI’s operation segments and end-market revenues on a pro forma basis.
Page 11 |
 Key
Priorities for 2014 •
Acquisitions:
Successful integration of JADAK, potential
follow-on deals: Medical & Advanced Industrial Markets
(i.e. scanning & precision motion)
•
Organic Growth:
~$5M of growth investment in key
platforms –
driven by confidence in long-term prospects
•
Productivity:
Driving $5M+ savings in 2014, funding
internal investments, mitigating risks & delivering
potential upside results
We have clear focus…
…for success in 2014
Page 12 |
 …assumes modest improvement in base business
$271M
Revenue Outlook
+25%*
Low Single
Digit Growth
13
Our conservative view of 2014…
+ JADAK ~$50M
annualized
2012
2013
2014 Outlook
*Includes acquisition of NDS Surgical Imaging on January 15, 2013. Reflects prior
full year guidance. The company is neither updating, nor confirming its prior guidance, but is simply using its prior guidance for comparison and illustrative purposes
Page 13 |
 Page 14
2014 productivity funds ~$5M of growth investment…
Adjusted EBITDA Outlook
14
*Adjusted EBITDA is a non-GAAP measure. The reconciliation to our most comparable GAAP
numbers is provided in the appendix. ** 2013 Reflects prior full year guidance.
The company is neither updating, nor confirming its prior guidance, but is simply using its prior guidance for comparison and illustrative purposes
…while we deliver +8% profit growth ex. JADAK
$42M
~$50M*
+ 8-10%
+ JADAK ~$10M
annualized
2012
2013
2014 Outlook |
 Deal
Financing We funded the transaction…
…through cash on hand and our new $215M credit facility
•
1
st
Quarter 2014:
Borrowing $68M from bank revolver at Libor
+ 275 basis points; total gross debt of approximately $140M,
and slightly more than $100M of net debt
•
Year-End 2014:
Expect to lower net debt to less than $70M,
with gross debt at Libor +250 basis points
($ in millions)
Sources
Amount
Uses
Amount
Cash & Cash Equivalents
26.0
$
JADAK Acquisition
93.5
$
Revolver ($175M)*
68.0
$
Transaction Fees
0.5
$
Total
94.0
$
Total
94.0
$
Sources and Uses
Page 15 |
 Free Cash Flow
Outlook 2012
2013
2014
(pre-Acq)
2014
(Post-JADAK)
Net Debt
($16M)
~$15M
~($20M)
~$70M
*EXCLUDES ~$10.6M net cash refund related to U.S. IRS audit for
the GSI Group’s 2000 through 2008 tax years.
Significant cash generation…
…from stronger portfolio and better operating capabilities
2012
2013
2014 Outlook
$24M
$25-30M*
+ $35M
Page 16
*Free Cash Flow and Net Debt are non-GAAP measures. The reconciliation to our
most comparable GAAP numbers is provided in the appendix. Free cash flow and Net Debt reflects prior full year guidance. The Company is neither updating, nor confirming its prior guidance, but is
simply using its prior guidance for comparison and illustrative purposes
+ JADAK ~$5M
annualized |
 Page
17 Appendix |
 Page
18 Non-GAAP Measures
The non-GAAP financial measures used in this presentation are non-GAAP
Adjusted EBITDA, free cash flow, and net debt. The Company believes that the
non-GAAP financial measures provide useful and supplementary information to investors
regarding the Company’s financial performance. It is management’s belief
that these non-GAAP financial measures would be particularly useful to
investors because of the significant changes that have occurred outside of the Company’s day-to-day
business in accordance with the execution of the Company’s strategy. This
strategy includes streamlining the Company’s existing operations through
site and functional consolidations, strategic divestitures, expanding the Company’s business
through significant internal investments, and broadening the Company’s product
and service offerings through acquisition of innovative and complementary
technologies and solutions. The financial impact of certain elements of these activities,
particularly acquisitions, divestitures, and site and functional
restructurings, are often large relative to the Company’s overall
financial performance, which can adversely affect the comparability of its operating
results and investors’ ability to analyze the
business from period to period.
The Company’s Adjusted EBITDA, a non-GAAP financial measure, is used by
management to evaluate operating performance, communicate financial results to
the Board of Directors, benchmark results against historical performance and the performance
of peers, and evaluate investment opportunities including acquisitions and
divestitures. In addition, Adjusted EBITDA is used to determine bonus payments
for senior management and employees. Accordingly, the Company believes that this non-GAAP
measure provides greater transparency and insight into management’s method of
analysis. Non-GAAP financial measures should not be considered as
substitutes for, or superior to, measures of financial performance prepared in
accordance with GAAP. They are limited in value because they exclude charges that have a material effect on the
Company’s reported results and, therefore, should not be relied upon as the sole
financial measures to evaluate the Company’s financial results. The
non-GAAP financial measures are meant to supplement, and to be viewed in conjunction with, GAAP
financial measures. Investors are encouraged to review the reconciliation of these
non-GAAP financial measures to their most directly comparable GAAP
financial measures as provided in the tables accompanying this presentation.
Use of Non-GAAP Financial Measures |
 Non-GAAP Free Cash Flow
& Net Debt
(a)
Free cash flow, a non-GAAP measure, is defined as cash provided by
operating activities less capital expenditures. (b)
Net debt, a non-GAAP measure, is defined as total debt less cash and cash
equivalents. Nine Months Ended
Twelve Months Ended
September 27, 2013
December 31, 2012
Cash provided by operating activities
$34,448
$28,430
Less: Capital expenditures
3,073
4,308
Free Cash Flow (a)
$31,375
$24,122
Debt
($78,375)
($50,000)
Less: Cash and cash equivalents
53,690
65,788
Net Debt (b)
$24,665
$15,788
* Free Cash Flow includes the cash flows of Continuing and Discontinued
Operations *
Page 19 |
 Non-GAAP Adjusted EBITDA Reconciliation
Twelve Months Ended
Last Twelve Months
December 31, 2012
December 31, 2011
September 27, 2013
(in thousands of dollars)
Income from operations (GAAP)
$ 15,007
$ 35,848
$ 14,311
Depreciation and amortization
13,196
14,467
18,458
Share-based compensation
4,580
3,276
5,313
Restructuring and other costs
8,842
2,406
7,338
Acquisition fair value adjustments
_
_
903
Net income attributable to noncontrolling interest
(40)
(28)
(37)
Adjusted EBITDA (Non-GAAP)
$ 41,585
$ 55,969
$ 46,286
Page 20 |