Attached files
| file | filename |
|---|---|
| 8-K - CHINA FUND INC | fp0009649_8k.htm |
|
Jan 31, 2014
|
Monthly Insight
The China Fund, Inc. (CHN)
|
|
Investment Objective
|
The investment objective of the Fund is to achieve long term capital appreciation. The Fund seeks to achieve its objective through investment in the equity securities of companies and other entities with significant assets, investments, production activities, trading or other business interests in China or which derive a significant part of their revenue from China.
The Fund has an operating policy that the Fund will invest at least 80% of its assets in China companies. For this purpose, ‘China companies’ are (i) companies for which the principal securities trading market is in China; (ii) companies for which the principal securities trading market is outside of China or in companies organized outside of China, that in both cases derive at least 50% of their revenues from goods or services sold or produced, or have a least 50% of their assets in China; or (iii) companies organized in China. Under the policy, China means the People’s Republic of China, including Hong Kong, and Taiwan. The Fund will provide its stockholders with at least 60 days’ prior notice of any change to this policy.
|
Performance Overview
|
|
Performance History
|
1 month
|
3 months
|
YTD
|
1 Year
|
3 Years
(p.a.)
|
5 Years
(p.a.)
|
10 Years
(p.a.)
|
Since
Inception
|
|
NAV (%)
|
-3.69
|
-1.24
|
-3.69
|
7.70
|
-0.26
|
17.39
|
13.14
|
10.80
|
|
Market price (%)
|
-6.44
|
-1.46
|
-6.44
|
-0.62
|
-1.63
|
16.96
|
9.34
|
9.71
|
|
Benchmark (%)
|
-5.48
|
-4.67
|
-5.48
|
-1.99
|
0.13
|
15.62
|
8.27
|
N/A
|
|
Performance History
|
2013
|
2012
|
2011
|
2010
|
2009
|
2008
|
2007
|
2006
|
|
NAV (%)
|
17.03
|
12.07
|
-24.37
|
27.25
|
72.82
|
-46.95
|
86.20
|
57.10
|
|
Market price (%)
|
11.48
|
20.46
|
-27.51
|
23.60
|
72.19
|
-40.65
|
50.24
|
65.67
|
|
Benchmark (%)
|
7.25
|
22.65
|
-18.36
|
13.60
|
67.12
|
-49.37
|
37.97
|
39.50
|
Source: State Street Bank and Trust Company. Source for index data: MSCI as at Jan 31, 2014.
|
Portfolio Analysis
|
|
Sector allocation (%)
|
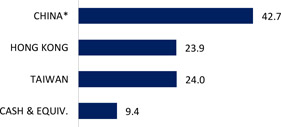
Country allocation (%)
|
 |
 |
|
Source: State Street Bank and Trust Company as at Jan 31, 2014.
|
* China includes A-shares (2.8%), A-share equity linked securities (8.3%), B-shares (0.0%), H-shares (17.8%) and Red-chips (13.8%).
|

The China Fund, Inc. (CHN)
|
Portfolio Analysis (continued)
|
|
Top 10 Holdings
|
Sector
|
%
|
|
|
BEIJING ENTERPRISES HOLDINGS, LTD.
|
INDUSTRIALS
|
4.1
|
|
|
TENCENT HOLDINGS, LTD.
|
I.T.
|
3.7
|
|
|
CHINA MINSHENG BANKING CORP., LTD.
|
FINANCIALS
|
3.7
|
|
|
HUTCHISON WHAMPOA, LTD.
|
INDUSTRIALS
|
3.5
|
|
|
CHINA EVERBRIGHT INTERNATIONAL, LTD.
|
INDUSTRIALS
|
3.4
|
|
|
TAIWAN SEMICONDUCTOR MANUFACTURING CO., LTD.
|
I.T.
|
3.4
|
|
|
LI & FUNG, LTD.
|
CONSUMER DISCRETIONARY
|
3.2
|
|
|
HAND ENTERPRISE SOLUTIONS CO., LTD.
|
I.T.
|
2.8
|
|
|
PING AN INSURANCE, LTD.
|
FINANCIALS
|
2.6
|
|
|
ENN ENERGY HOLDINGS, LTD.
|
UTILITIES
|
2.6
|
|
|
Total
|
33.0
|
||
|
Direct Investments
|
Sector
|
%
|
|
Nil
|
||
|
Total
|
-
|
|
Source: State Street Bank and Trust Company as at Jan 31, 2014.
|
Fund Details
|
|
NAV
|
$22.19
|
|
Market price
|
$19.47
|
|
Premium/Discount
|
-12.26%
|
|
Market cap
|
US$305.33m
|
|
Shares outstanding
|
15,682,029
|
|
Exchange listed
|
NYSE
|
|
Listing date
|
July 10, 1992
|
|
Benchmark
|
MSCI Golden Dragon Index (Total Return)
|
|
Fund Manager
|
Christina Chung
|
|
Listed and direct investment manager
|
RCM Asia Pacific Limited
|
Source: State Street Bank and Trust Company as at Jan 31, 2014.
|
Distribution History (10 years)
|
|
Declaration
date
|
Ex-dividend
date
|
Record
date
|
Payable
date
|
Dividend/
Share
|
Income
|
Long-term
Capital
|
Short-term
Capital
|
|
13 Dec 2013
|
19 Dec 2013
|
23 Dec 2013
|
27 Dec 2013
|
3.3140
|
0.4387
|
2.8753
|
0.0000
|
|
10 Dec 2012
|
20 Dec 2012
|
24 Dec 2012
|
28 Dec 2012
|
3.2517
|
0.3473
|
2.9044
|
0.0000
|
|
8 Dec 2011
|
21 Dec 2011
|
23 Dec 2011
|
29 Dec 2011
|
2.9964
|
0.1742
|
2.8222
|
0.0000
|
|
8 Dec 2010
|
21 Dec 2010
|
24 Dec 2010
|
29 Dec 2010
|
2.2742
|
0.3746
|
1.8996
|
0.0000
|
|
9 Dec 2009
|
22 Dec 2009
|
24 Dec 2009
|
29 Dec 2009
|
0.2557
|
0.2557
|
0.0000
|
0.0000
|
|
8 Dec 2008
|
22 Dec 2008
|
24 Dec 2008
|
23 Jan 2009
|
5.8174
|
0.4813
|
5.3361
|
0.0000
|
|
7 Dec 2007
|
19 Dec 2007
|
21 Dec 2007
|
25 Jan 2008
|
12.1200
|
0.2800
|
9.0000
|
2.8400
|
|
8 Dec 2006
|
19 Dec 2006
|
21 Dec 2006
|
29 Dec 2006
|
4.0116
|
0.2996
|
2.7309
|
0.9811
|
|
9 Dec 2005
|
19 Dec 2005
|
21 Dec 2005
|
29 Dec 2005
|
2.5119
|
0.2172
|
2.2947
|
0.0000
|
|
13 Dec 2004
|
20 Dec 2004
|
22 Dec 2004
|
7 Jan 2005
|
3.5701
|
0.1963
|
3.2664
|
0.1074
|
Source: State Street Bank and Trust Company as at December 31, 2013. Dividend/Share includes Income, Long-term Capital gains and Short-term Capital gains.
2
The China Fund, Inc. (CHN)
The China Fund Inc. NAV Performance of USD $10,000 since inception (with dividends reinvested at NAV price)
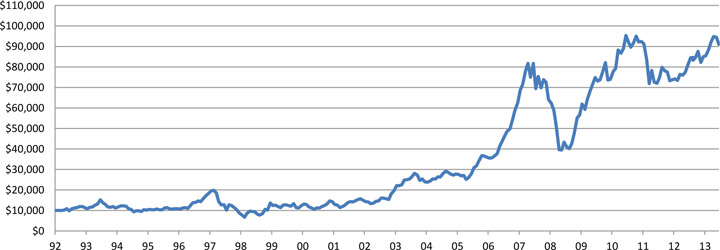
Past performance is not a guide to future returns.
Source: State Street Bank and Trust Company as at Jan 31, 2014.
The China Fund Inc. Premium / Discount

Past performance is not a guide to future returns.
Source: State Street Bank and Trust Company as at Jan 31, 2014.
3
The China Fund, Inc. (CHN)
Manager’s Commentary
Market Review
With China’s macroeconomic data suggesting a moderation in economic activity, the Hong Kong equity markets consolidated with the Hang Seng Index pulling back 5.5% in January. The January HSBC/Markit PMI fell to 49.5 indicating potential growth deceleration in the near term and consistent with the sequential industrial slowdown in recent months. The drop reaffirms the weaker growth momentum in recent months which was likely heightened by pollution control, anti-corruption measures as well as the relatively tight monetary and fiscal policy stances. Market sentiment was also dampened by concerns over the potential default of maturing trust loans and the interbank rate hovering at a relatively high level.
In Hong Kong, the latest Government Policy Address had minimal impact on the equity market with no surprises with respect to the housing policy.
In Taiwan, December export orders grew by 7.4% year-on-year, far exceeding the market consensus of 2% year-on-year, mainly attributable to the export of Apple products. In general, the fourth quarter corporate earnings results were mildly positive with key technology companies delivering solid numbers, while there was profit taking pressures for non-technology stocks.
Fund Review
The Fund outperformed the benchmark for the month. The overweight in information technology and underweight in financials contributed the most to relative returns, while stock selection in information technology and consumer discretionary detracted. The top two contributors for the month were Hand Enterprise and Tong Hsing Electronics. There was no material positive news on Hand Enterprise and the share price recovered from relatively low levels. Tong Hsing Electronics, a Taiwanese company, is a leading supplier of ceramic substrates for LED lighting and the company benefited from the increasing demand of LED lighting. Conversely, one of the main detractors was Digital China. The company issued a profit warning during the month, which was attributed mainly to a change in accounting year end. We remain positive on the company for the medium term. Also, the shares in Integrated Waste Solutions (formerly known as Fook Woo) resumed trading in late January, after being suspended since November 2011. We took the opportunity to exit the position.
Outlook
Greater China equities are likely to post a moderate rebound after a sharp sell-off. In China, we would expect news flow on reform initiatives to help support market sentiment in the short term. In addition, concerns over a ‘hard landing’ in China should ease over time as we believe that China’s economy should be relatively stable in 2014.
In Taiwan, we expect the equity market will benefit from the continuous corporate earnings growth, a positive liquidity situation due to favorable monetary policies and the local elections at the end of the year. We favor companies that are likely to benefit from the expected economic recovery in the developed markets in 2014.
Source: RCM Asia Pacific Limited as at January 31, 2014.
The China Fund, Inc. (CHN)
Portfolio Holdings
|
CUSIP
|
Security Description
|
Cost Base
|
Base MV
|
Shares
|
Percentage of
Net Assets
|
|
608169900
|
Beijing Enterprises Holdings, Ltd.
|
12,981,141
|
14,277,698
|
1,683,500
|
4.1
|
|
B01CT3905
|
Tencent Holdings, Ltd.
|
5,167,991
|
13,021,734
|
186,200
|
3.7
|
|
B57JY2909
|
China Minsheng Banking Corp., Ltd.
|
14,491,196
|
12,818,201
|
13,027,000
|
3.7
|
|
644806002
|
Hutchison Whampoa, Ltd.
|
10,763,479
|
12,105,172
|
975,000
|
3.5
|
|
663094902
|
China Everbright International, Ltd.
|
3,964,141
|
11,772,589
|
8,944,000
|
3.4
|
|
688910900
|
Taiwan Semiconductor Manufacturing Co., Ltd.
|
9,146,686
|
11,679,182
|
3,370,000
|
3.4
|
|
628625907
|
Li & Fung, Ltd.
|
11,326,774
|
11,191,190
|
8,016,000
|
3.2
|
|
B3VN92906
|
HAND Enterprise Solutions Co., Ltd.
|
589,162
|
9,545,502
|
3,138,673
|
2.8
|
|
913BMZ902
|
Ping An Insurance (Group) Company of China, Ltd. Access Product (expiration 06/30/15)
|
9,494,979
|
9,091,241
|
1,418,047
|
2.6
|
|
633393905
|
Enn Energy Holdings, Ltd.
|
367,996
|
8,914,063
|
1,376,000
|
2.6
|
|
B1L8PB906
|
Tong Hsing Electronic Industries, Ltd.
|
7,822,224
|
8,843,188
|
1,723,000
|
2.5
|
|
17313A533
|
Gree Electric Appliances, Inc. Access Product (expiration 01/16/15)
|
6,453,442
|
8,540,046
|
1,838,546
|
2.5
|
|
637248907
|
MediaTek, Inc.
|
7,101,686
|
8,288,258
|
627,000
|
2.4
|
|
B00G0S903
|
CNOOC, Ltd.
|
10,305,318
|
8,107,722
|
5,160,000
|
2.3
|
|
671815900
|
Qingling Motors Co., Ltd.
|
8,718,221
|
8,056,411
|
28,960,000
|
2.3
|
|
B3WH02907
|
Hermes Microvision, Inc.
|
7,867,215
|
7,973,001
|
269,000
|
2.3
|
|
635186901
|
Digital China Holdings, Ltd.
|
14,070,844
|
7,965,638
|
8,138,000
|
2.3
|
|
626073902
|
Delta Electronics, Inc.
|
4,010,493
|
7,831,092
|
1,425,000
|
2.3
|
|
607355906
|
China Mobile, Ltd.
|
8,371,940
|
7,787,493
|
816,000
|
2.2
|
|
B1DYPZ905
|
China Merchants Bank Co., Ltd.
|
9,119,882
|
7,619,425
|
4,312,000
|
2.2
|
|
620267906
|
Advantech Co., Ltd.
|
3,787,770
|
7,417,147
|
1,189,000
|
2.1
|
|
B2R2ZC908
|
CSR Corp., Ltd.
|
7,466,210
|
7,251,396
|
9,930,000
|
2.1
|
|
658444906
|
Merida Industry Co., Ltd.
|
6,624,015
|
6,949,814
|
1,126,000
|
2.0
|
|
674347901
|
Semiconductor Manufacturing International Corp.
|
6,358,447
|
6,410,086
|
63,001,000
|
1.8
|
|
685992000
|
Sun Hung Kai Properties, Ltd.
|
7,077,680
|
6,371,211
|
521,000
|
1.8
|
|
B1G1QD902
|
Industrial & Commercial Bank of China Ltd.
|
6,201,503
|
6,161,222
|
9,925,000
|
1.7
|
|
622657906
|
PetroChina Co., Ltd.
|
6,262,451
|
5,884,620
|
6,084,000
|
1.7
|
|
674842901
|
Ruentex Development Co., Ltd.
|
2,674,949
|
5,837,303
|
3,311,904
|
1.7
|
|
ACI009HH0
|
China Suntien Green Energy Corp., Ltd.
|
4,612,718
|
5,565,533
|
12,785,000
|
1.6
|
|
B58J1S907
|
Chailease Holding Co., Ltd.
|
5,196,680
|
5,256,552
|
2,132,000
|
1.5
|
|
B236JB905
|
Tiangong International Co., Ltd.
|
5,449,044
|
4,998,165
|
18,480,000
|
1.4
|
|
645166901
|
Largan Precision Co., Ltd.
|
3,937,557
|
4,537,338
|
118,000
|
1.3
|
|
B0Y91C906
|
China National Building Material Co., Ltd.
|
5,073,552
|
4,466,343
|
4,630,000
|
1.3
|
|
644094906
|
Taiwan FamilyMart Co., Ltd.
|
525,306
|
4,436,670
|
742,652
|
1.3
|
|
B633D9904
|
Zhongsheng Group Holdings, Ltd.
|
3,919,603
|
4,399,552
|
2,996,500
|
1.3
|
|
613623909
|
Hengan International Group Co., Ltd.
|
3,889,897
|
4,069,615
|
375,500
|
1.2
|
|
B688XD907
|
Beijing Jingneng Clean Energy Co., Ltd.
|
3,525,009
|
4,061,099
|
6,244,000
|
1.2
|
|
665157905
|
Comba Telecom Systems Holdings, Ltd.
|
7,565,579
|
3,754,240
|
10,958,500
|
1.1
|
|
ACI07LD80
|
Dongxu Optoelectronic Technology Co., Ltd. (expiration 06/30/15)
|
2,846,947
|
3,625,754
|
962,760
|
1.0
|
|
17313X574
|
China State Construction Engineering Corp., Ltd. (expiration 01/16/15)
|
4,674,320
|
3,614,128
|
7,375,772
|
1.0
|
|
B16NHT900
|
Shui On Land, Ltd.
|
4,155,621
|
3,545,415
|
11,055,500
|
1.0
|
|
643280902
|
Chipbond Technology Corp.
|
3,949,251
|
2,988,068
|
1,916,000
|
0.8
|
|
993HWH901
|
Daqin Railway Co., Ltd. Access Product (expiration 11/02/16)
|
2,786,924
|
2,913,502
|
2,449,968
|
0.8
|
|
651795908
|
Natural Beauty Bio-Technology, Ltd.
|
4,906,910
|
2,703,656
|
47,710,000
|
0.8
|
|
42751U205
|
Hermes Microvision, Inc.
|
1,368,073
|
1,386,833
|
46,900
|
0.4
|
|
B1B25Q909
|
Daqin Railway Co., Ltd. Access Product (expiration 01/20/15)
|
1,246,037
|
1,272,567
|
1,070,283
|
0.4
|
|
ACI0090H8
|
Zong Su Foods (acquired 09/21/10)
|
15,000,034
|
-
|
2,677
|
0.0
|
Source: State Street Bank and Trust Company as at Jan 31, 2014.
5
The China Fund, Inc. (CHN)
|
The information contained herein has been obtained from sources believed to be reliable but RCM (an Allianz Global Investors company) and its affiliates do not warrant the information to be accurate, complete or reliable. The opinions expressed herein are subject to change at any time and without notice. Past performance is not indicative of future results. This material is not intended as an offer or solicitation for the purchase or sale of any financial instrument. Investors should consider the investment objectives, risks, charges and expenses of any mutual fund carefully before investing. This and other information is contained in the fund’s annual and semiannual reports, proxy statement and other fund information, which may be obtained by contacting your financial advisor or visiting the fund’s website at www.chinafundinc.com. This information is unaudited and is intended for informational purposes only. It is presented only to provide information on investment strategies and opportunities. The Fund seeks to achieve its objective through investment in the equity securities of companies and other entities with significant assets, investments, production activities, trading or other business interests in China or which derive a significant part of their revenue from China. Investing in non-U.S. securities entails additional risks, including political and economic risk and the risk of currency fluctuations, as well as lower liquidity. These risks, which can result in greater price volatility, will generally be enhanced in less diversified funds that concentrate investments in a particular geographic region. The Fund is a closed-end exchange traded management investment company. This material is presented only to provide information and is not intended for trading purposes. Closed-end funds, unlike open- end funds, are not continuously offered. After the initial public offering, shares are sold on the open market through a stock exchange, where shares may trade at a premium or a discount. Holdings are subject to change daily.
|