Attached files
| file | filename |
|---|---|
| EX-99.2 - CALLON PETROLEUM COMPANY - UPCOMING INVESTOR EVENT NEWS RELEASE - Callon Petroleum Co | ex992-upcominginvestoreven.htm |
| 8-K - 8-K - CALLON PETROLEUM COMPANY - FEBRUARY 2014 INVESTOR PRESENTATION - Callon Petroleum Co | a2014-02febx14xfebruary201.htm |
FEBRUARY 2014 INVESTOR PRESENTATION CALLON PETROLEUM COMPANY Exhibit 99.1
2 FORWARD-LOOKING STATEMENTS This presentation contains projections and other forward-looking statements within the meaning of Section 27A of the Securities Act of 1933 and Section 21E of the Securities Exchange Act of 1934. These projections and statements reflect the Company’s current views with respect to future events and financial performance as of this date. No assurances can be given, however, that these events will occur or that these projections will be achieved and actual results could differ materially from those projected as a result of certain factors. For a summary of events that may affect the accuracy of these projections and forward-looking statements, see “Risk Factors” in our Form 10-K filed with the Securities and Exchange Commission. Cautionary Note to Investors – As of January 1, 2010, the SEC changed its rules to permit oil and gas companies, in their filings with the SEC, to disclose not only proved reserves, but also probable reserves and possible reserves. Proved oil and gas reserves are those quantities of oil and gas, which, by analysis of geoscience and engineering data, can be estimated with reasonable certainty to be economically producible – from a given date forward, from known reservoirs, and under existing economic conditions, operating methods, and government regulations – prior to the time at which contracts providing the right to operate expire. Probable reserves include those additional reserves that a company believes are as likely as not to be recovered and possible reserves include those additional reserves that are less certain to be recovered than probable reserves. We use certain terms in this presentation, such as “reserve potential”, “resource potential” and “EUR” that the SEC's guidelines strictly prohibit us from including in filings with the SEC. Investors are urged to consider closely the disclosure in our Form 10-K, available from us by contacting Investor Relations, Callon Petroleum Company, 200 North Canal Street, Natchez, MS 39120. You can also obtain our Form 10-K from the SEC by calling 1-800-SEC-0330 or by downloading it from the SEC’s web site http://www.sec.gov/. February 2014 Investor Presentation
3 IMPORTANT ADDITIONAL INFORMATION February 2014 Investor Presentation Callon, its directors and certain of its executive officers may be deemed to be participants in the solicitation of proxies from Callon stockholders in connection with the matters to be considered at Callon’s 2014 Annual Meeting. Callon intends to file a proxy statement with the U.S. Securities and Exchange Commission (the “SEC”) in connection with any such solicitation of proxies from Callon stockholders. CALLON STOCKHOLDERS ARE STRONGLY ENCOURAGED TO READ ANY SUCH PROXY STATEMENT AND ACCOMPANYING PROXY CARD WHEN THEY BECOME AVAILABLE AS THEY WILL CONTAIN IMPORTANT INFORMATION. Information regarding the ownership of Callon’s directors and executive officers in Callon stock, restricted stock and options is included in their SEC filings on Forms 3, 4 and 5, which can be found at the Company’s website (ww.callon.com) in the section “Investors.” More detailed information regarding the identity of potential participants, and their direct or indirect interests, by security holdings or otherwise, will be set forth in the proxy statement and other materials to be filed with the SEC in connection with Callon’s 2014 Annual Meeting. Information can also be found in Callon’s Annual Report on Form 10-K for the year ended December 31, 2012, filed with the SEC on March 14, 2013. Stockholders will be able to obtain any proxy statement, any amendments or supplements to the proxy statement and other documents filed by Callon with the SEC for no charge at the SEC’s website at www.sec.gov. Copies will also be available at no charge at Callon’s website at www.callon.com or by writing to Callon at 200 North Canal Street, Natchez, Mississippi 39120.
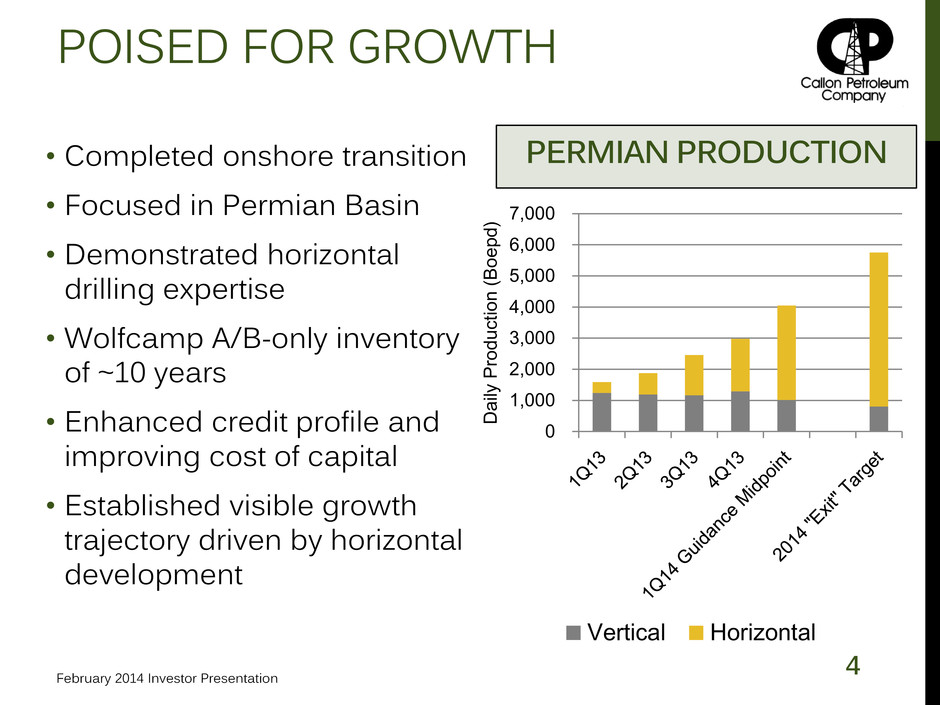
4 POISED FOR GROWTH • Completed onshore transition • Focused in Permian Basin • Demonstrated horizontal drilling expertise • Wolfcamp A/B-only inventory of ~10 years • Enhanced credit profile and improving cost of capital • Established visible growth trajectory driven by horizontal development PERMIAN PRODUCTION 0 1,000 2,000 3,000 4,000 5,000 6,000 7,000 D ail y Produc tion ( B o e p d ) Vertical Horizontal February 2014 Investor Presentation
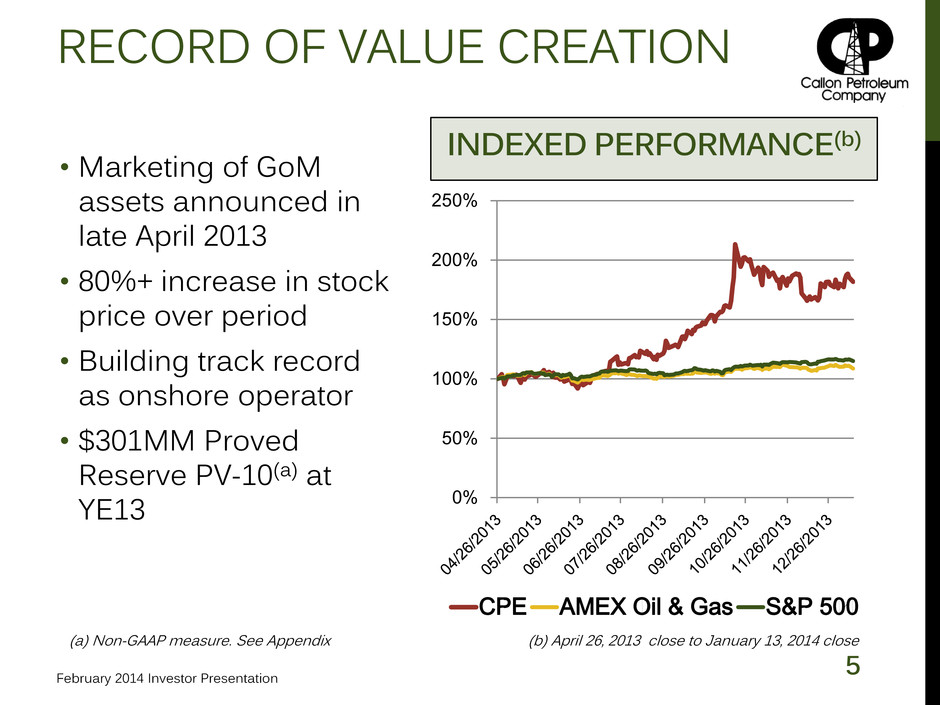
5 RECORD OF VALUE CREATION • Marketing of GoM assets announced in late April 2013 • 80%+ increase in stock price over period • Building track record as onshore operator • $301MM Proved Reserve PV-10(a) at YE13 0% 50% 100% 150% 200% 250% CPE AMEX Oil & Gas S&P 500 INDEXED PERFORMANCE(b) (a) Non-GAAP measure. See Appendix (b) April 26, 2013 close to January 13, 2014 close February 2014 Investor Presentation

6 PURE-PLAY GROWTH STRATEGY Drive growth with ongoing horizontal program development • Transitioned early to improve capital efficiency • Two fields in 2013 Four fields in 2014 • Increasing EURs with extended production history • Minimal vertical development drilling planned (or needed to HBP acreage) • All Southern and Central Midland acreage HBP by YE 2014 Expand the drilling portfolio • Establish additional benches drilled by industry • Continued downspacing initiatives • Northern Midland Basin delineation efforts • Proven ability to acquire and trade acreage Capitalize on opportunities to further reduce cost of capital • Solid credit metrics and improved risk profile • Expansion of borrowing base capacity • Completion of Senior Notes retirement February 2014 Investor Presentation
OPERATIONS FEBRUARY 2014
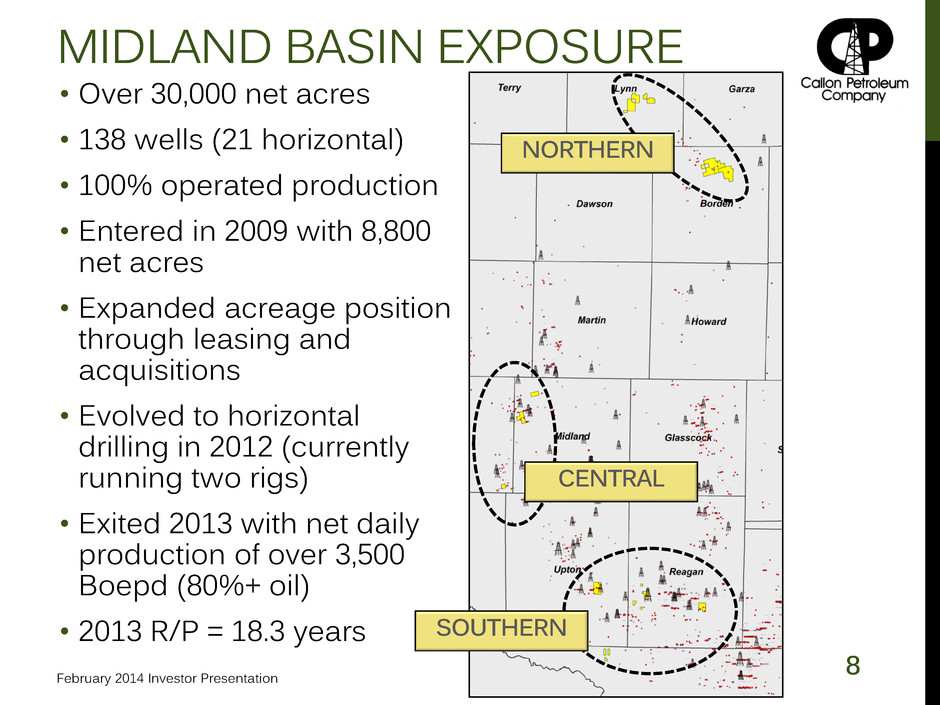
8 MIDLAND BASIN EXPOSURE • Over 30,000 net acres • 138 wells (21 horizontal) • 100% operated production • Entered in 2009 with 8,800 net acres • Expanded acreage position through leasing and acquisitions • Evolved to horizontal drilling in 2012 (currently running two rigs) • Exited 2013 with net daily production of over 3,500 Boepd (80%+ oil) • 2013 R/P = 18.3 years February 2014 Investor Presentation SOUTHERN NORTHERN CENTRAL
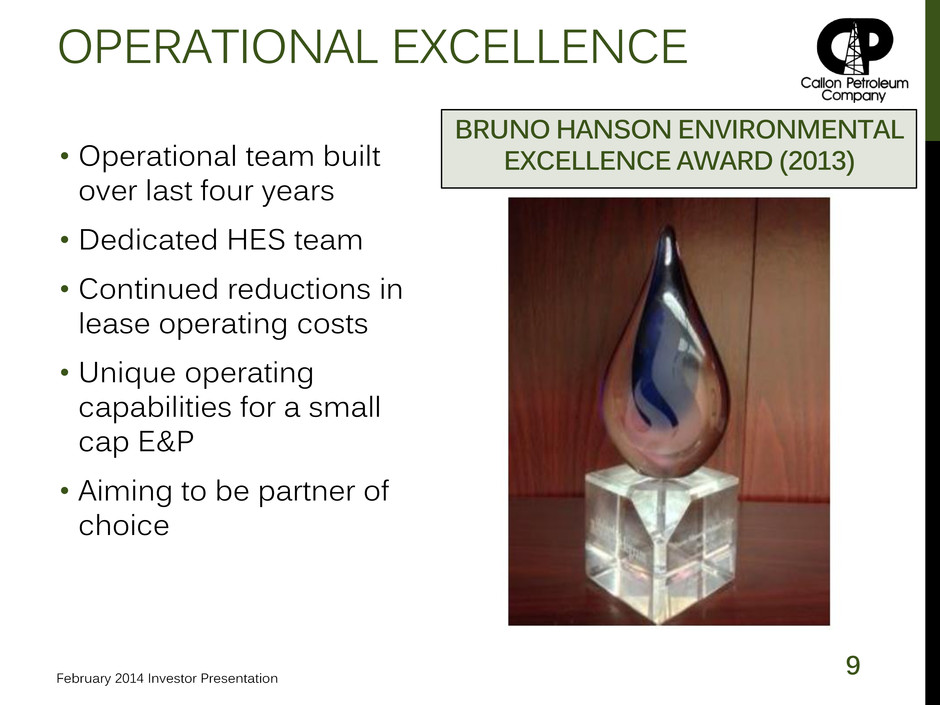
9 OPERATIONAL EXCELLENCE • Operational team built over last four years • Dedicated HES team • Continued reductions in lease operating costs • Unique operating capabilities for a small cap E&P • Aiming to be partner of choice BRUNO HANSON ENVIRONMENTAL EXCELLENCE AWARD (2013) February 2014 Investor Presentation
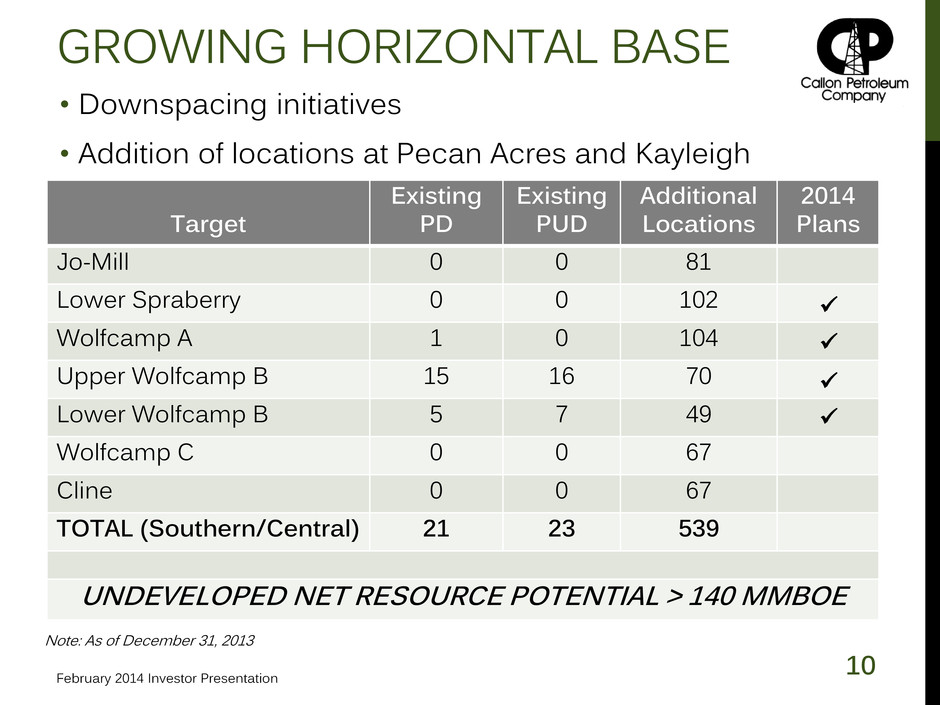
10 GROWING HORIZONTAL BASE Target Existing PD Existing PUD Additional Locations 2014 Plans Jo-Mill 0 0 81 Lower Spraberry 0 0 102 Wolfcamp A 1 0 104 Upper Wolfcamp B 15 16 70 Lower Wolfcamp B 5 7 49 Wolfcamp C 0 0 67 Cline 0 0 67 TOTAL (Southern/Central) 21 23 539 UNDEVELOPED NET RESOURCE POTENTIAL > 140 MMBOE • Downspacing initiatives • Addition of locations at Pecan Acres and Kayleigh February 2014 Investor Presentation Note: As of December 31, 2013

11 SOUTHERN MIDLAND BASIN • Most established area in basin for horizontal development • 19 horizontal wells • Pad development of two fields in 2013 with additional field in 2014 • Two-stream type curve (480 Mboe) increasing with extended production data • Three zones producing to date PRODUCTION 0 500 1,000 1,500 2,000 2,500 3,000 1Q13 2Q13 3Q13 4Q13 D ail y Produc tion ( B o e p d ) Vertical Horizontal February 2014 Investor Presentation
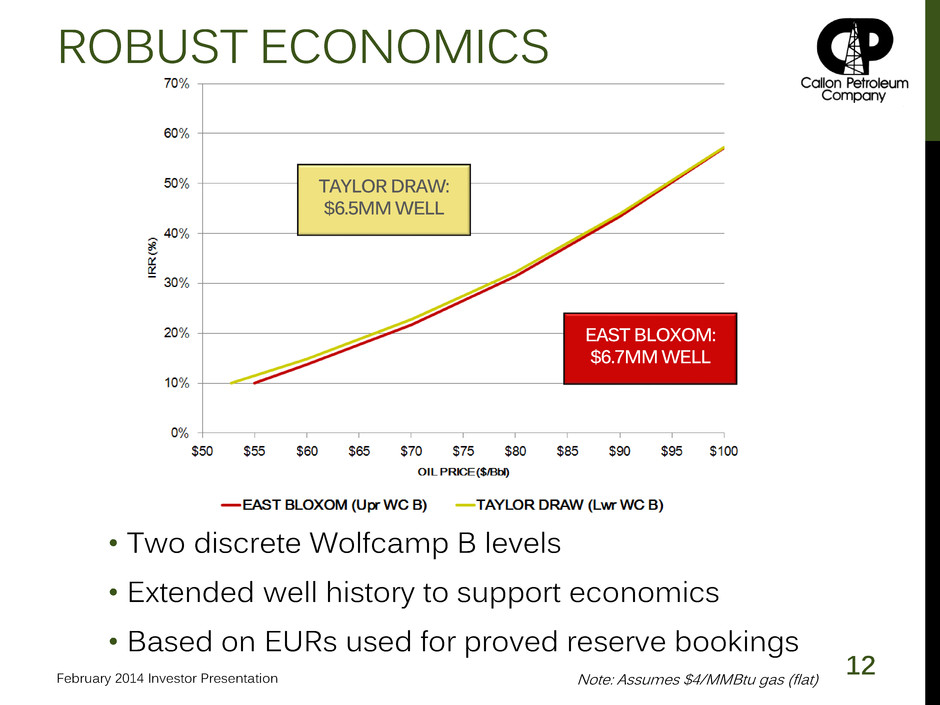
12 ROBUST ECONOMICS • Two discrete Wolfcamp B levels • Extended well history to support economics • Based on EURs used for proved reserve bookings February 2014 Investor Presentation Note: Assumes $4/MMBtu gas (flat) EAST BLOXOM: $6.7MM WELL TAYLOR DRAW: $6.5MM WELL

13 MULTIPLE ZONE DE-RISKING LOWER WC B G A R R IS O N D R A W LO W ER W C B UPPER WC B WC A EAST BLOXOM UPPER WC B TAYLOR DRAW • Three established zones supported by microseismic • “Effective horizontal acreage” of over 20,000 net acres in three fields PDNPs ONLINE February 2014 Investor Presentation Note: As of December 31, 2013
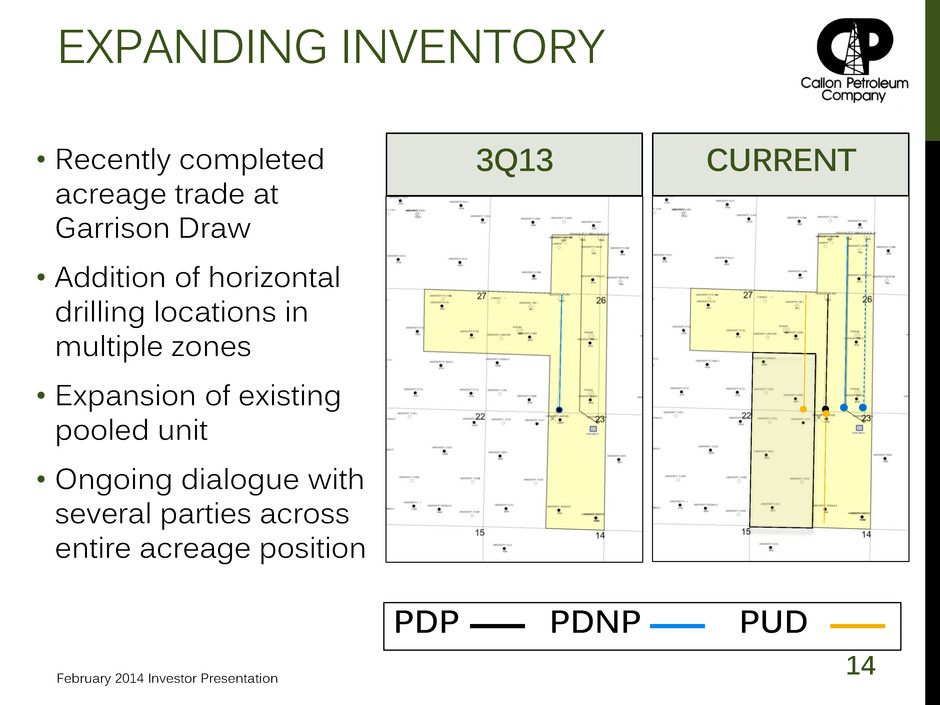
14 EXPANDING INVENTORY • Recently completed acreage trade at Garrison Draw • Addition of horizontal drilling locations in multiple zones • Expansion of existing pooled unit • Ongoing dialogue with several parties across entire acreage position PDP PDNP PUD CURRENT 3Q13 February 2014 Investor Presentation
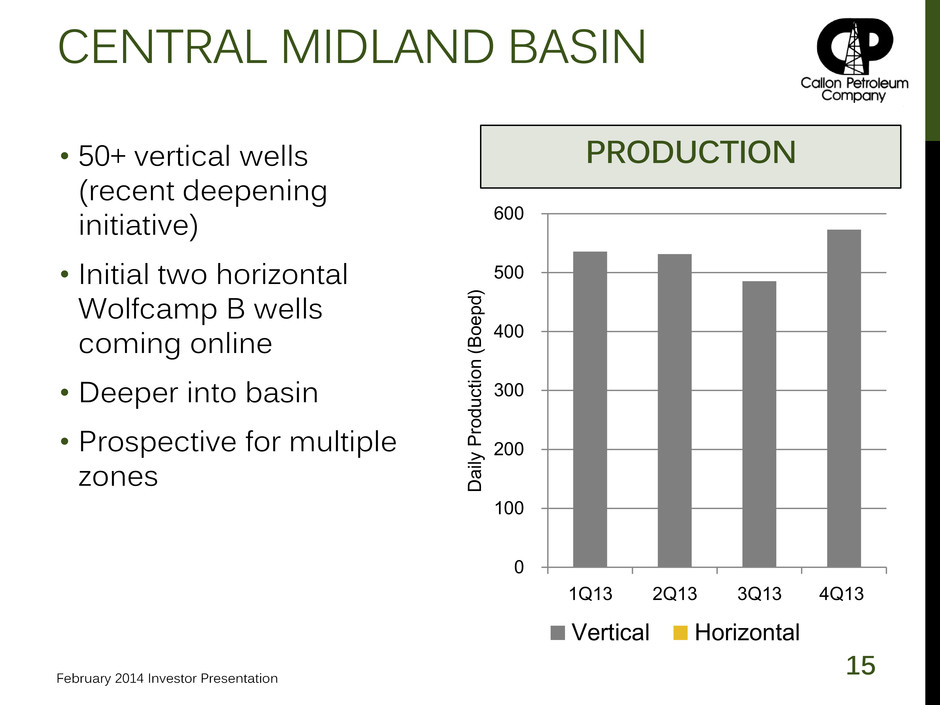
15 CENTRAL MIDLAND BASIN • 50+ vertical wells (recent deepening initiative) • Initial two horizontal Wolfcamp B wells coming online • Deeper into basin • Prospective for multiple zones PRODUCTION 0 100 200 300 400 500 600 1Q13 2Q13 3Q13 4Q13 D ail y Produc tion ( B o e p d ) Vertical Horizontal February 2014 Investor Presentation
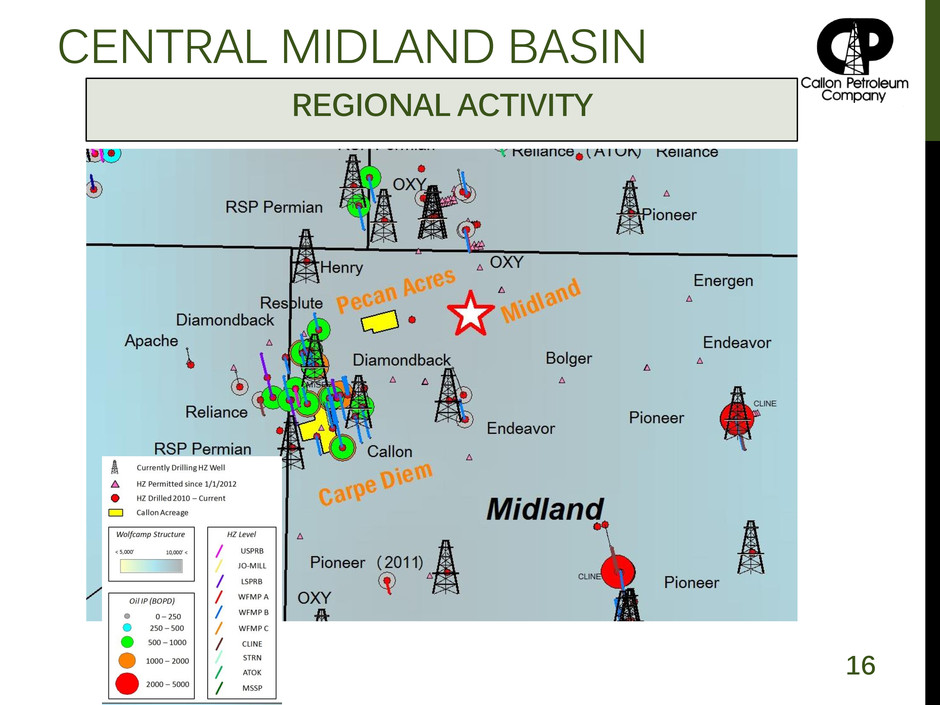
16 CENTRAL MIDLAND BASIN REGIONAL ACTIVITY
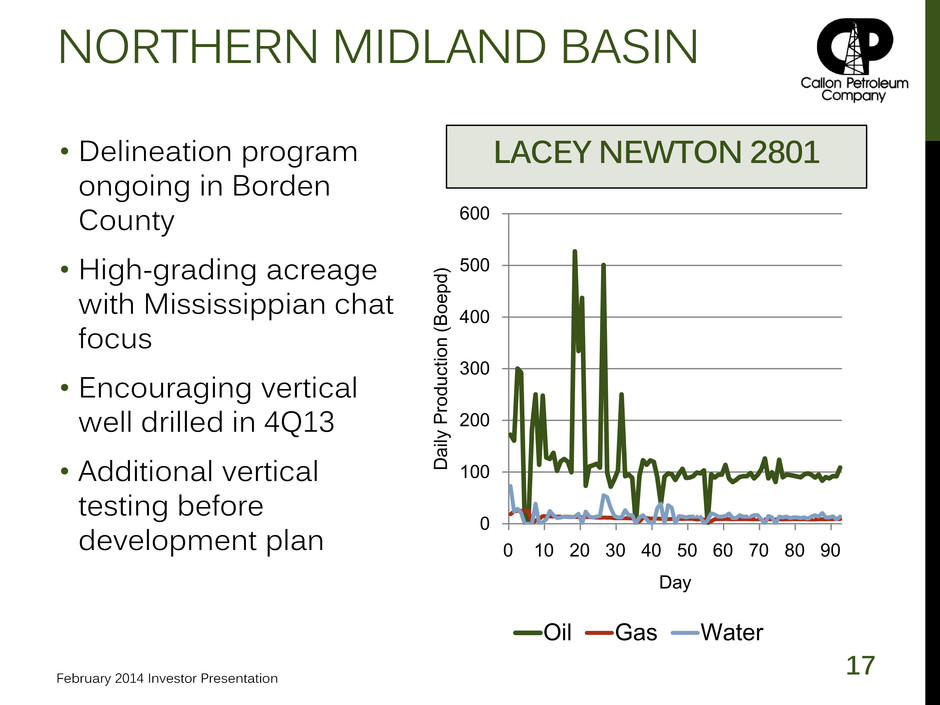
17 NORTHERN MIDLAND BASIN • Delineation program ongoing in Borden County • High-grading acreage with Mississippian chat focus • Encouraging vertical well drilled in 4Q13 • Additional vertical testing before development plan 0 100 200 300 400 500 600 0 10 20 30 40 50 60 70 80 90 D ail y Produc tion ( B o e p d ) Day Oil Gas Water LACEY NEWTON 2801 February 2014 Investor Presentation
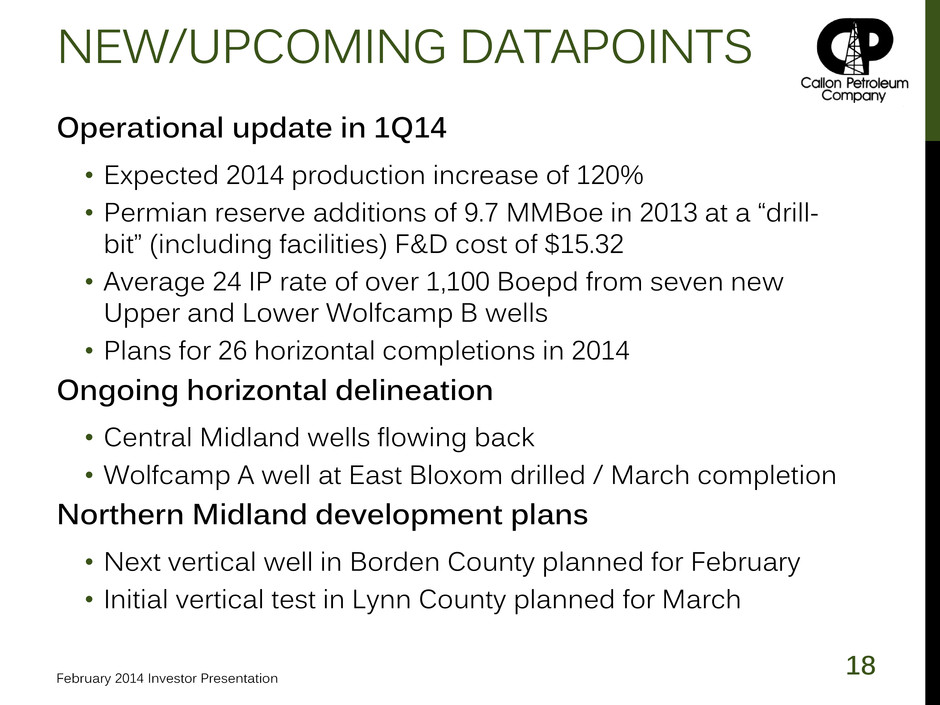
18 NEW/UPCOMING DATAPOINTS Operational update in 1Q14 • Expected 2014 production increase of 120% • Permian reserve additions of 9.7 MMBoe in 2013 at a “drill- bit” (including facilities) F&D cost of $15.32 • Average 24 IP rate of over 1,100 Boepd from seven new Upper and Lower Wolfcamp B wells • Plans for 26 horizontal completions in 2014 Ongoing horizontal delineation • Central Midland wells flowing back • Wolfcamp A well at East Bloxom drilled / March completion Northern Midland development plans • Next vertical well in Borden County planned for February • Initial vertical test in Lynn County planned for March February 2014 Investor Presentation
FINANCIAL FEBRUARY 2014
20 IMPROVING FINANCIAL PROFILE Significant progress reducing cost of capital • Redemption of 50% of Senior Notes • Expanded bank borrowing capacity and lending group • No common equity issuance since March 2011 Near-term potential for further improvement • Update bank facility pricing and terms for onshore asset base and horizontal success • Continued growth in borrowing base • Refinancing of remaining Senior Notes with improved credit profile and increasing Permian scale • Meaningful debt capacity following GoM divestiture and preferred equity issuance February 2014 Investor Presentation
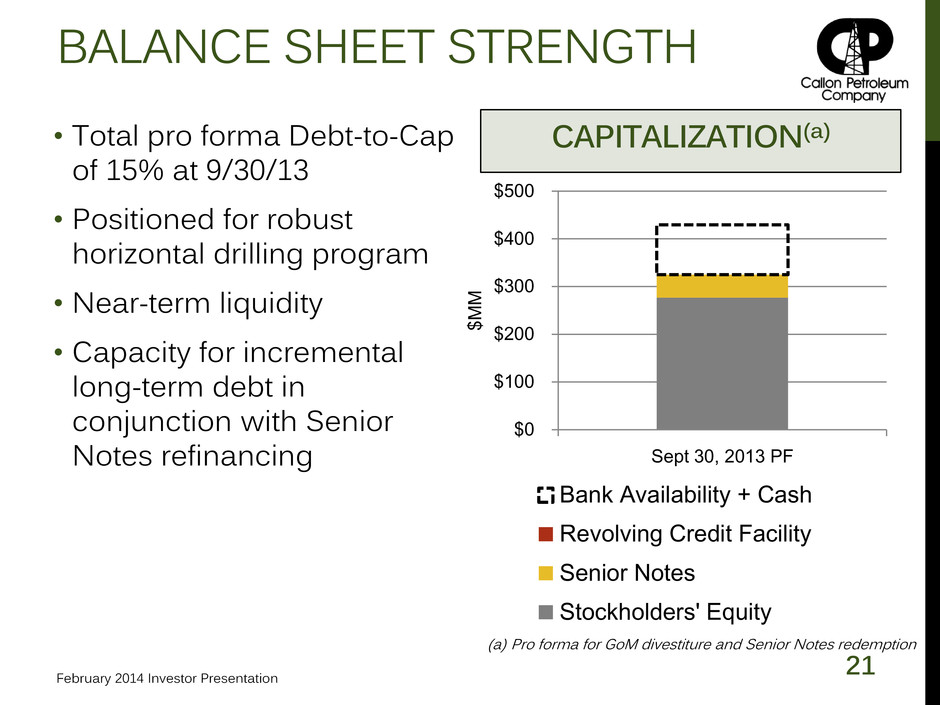
21 BALANCE SHEET STRENGTH • Total pro forma Debt-to-Cap of 15% at 9/30/13 • Positioned for robust horizontal drilling program • Near-term liquidity • Capacity for incremental long-term debt in conjunction with Senior Notes refinancing $0 $100 $200 $300 $400 $500 Sept 30, 2013 PF $ M M Bank Availability + Cash Revolving Credit Facility Senior Notes Stockholders' Equity CAPITALIZATION(a) (a) Pro forma for GoM divestiture and Senior Notes redemption February 2014 Investor Presentation
SUMMARY FEBRUARY 2014

23 KEY MESSAGES Reaping rewards of early program development efforts Established inventory of de-risked horizontal locations Northern Midland delineation in process Horizontal expertise combined with focus of a smaller company creates unique partnering opportunities to complement acquisition strategy Financial flexibility to accommodate existing and emerging growth initiatives February 2014 Investor Presentation
APPENDIX FEBRUARY 2014
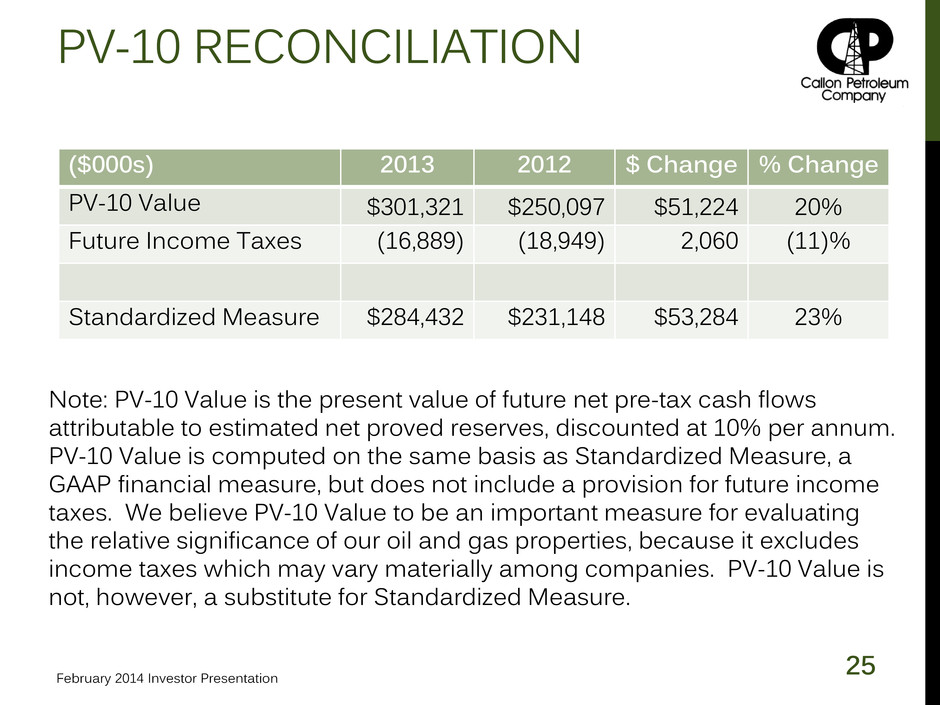
25 PV-10 RECONCILIATION ($000s) 2013 2012 $ Change % Change PV-10 Value $301,321 $250,097 $51,224 20% Future Income Taxes (16,889) (18,949) 2,060 (11)% Standardized Measure $284,432 $231,148 $53,284 23% Note: PV-10 Value is the present value of future net pre-tax cash flows attributable to estimated net proved reserves, discounted at 10% per annum. PV-10 Value is computed on the same basis as Standardized Measure, a GAAP financial measure, but does not include a provision for future income taxes. We believe PV-10 Value to be an important measure for evaluating the relative significance of our oil and gas properties, because it excludes income taxes which may vary materially among companies. PV-10 Value is not, however, a substitute for Standardized Measure. February 2014 Investor Presentation
