Attached files
| file | filename |
|---|---|
| 8-K - 8-K - MOLINA HEALTHCARE, INC. | d675322d8k.htm |
| EX-99.1 - EX-99.1 - MOLINA HEALTHCARE, INC. | d675322dex991.htm |
 Investor Day 2014A
February 13, 2014
New York, New York
Exhibit 99.2 |
 2
©
2014 Molina Healthcare, Inc.
Cautionary Statement
Safe
Harbor
Statement
under
the
Private
Securities
Litigation
Reform
Act
of
1995:
This
slide
presentation
and
our
accompanying
oral
remarks
contain
numerous
“forward-looking
statements”
regarding,
without
limitation:
our
2014
financial
guidance;
our
revenue,
revenue
mix,
and
membership
projections;
our
business
strategy;
duals
demonstration
projects
and
their
expected
implementation
start
dates;
the
ACA
annual
fee
or
excise
tax
and
its
reimbursement
by
states
on
a
grossed-up
basis;
the
2014
rate
environment;
the
hepatitis
C
drug
Sovaldi;
and
various
other
matters.
All
of
our
forward-looking
statements
are
subject
to
numerous
risks,
uncertainties,
and
other
factors
that
could
cause
our
actual
results
to
differ
materially.
Anyone
viewing
or
listening
to
this
presentation
is
urged
to
read
the
risk
factors
and
cautionary
statements
found
under
Item
1A
in
our
annual
report
on
Form
10-K,
as
well
as
the
risk
factors
and
cautionary
statements
in
our
quarterly
reports
and
in
our
other
reports
and
filings
with
the
Securities
and
Exchange
Commission
and
available
for
viewing
on
its
website
at
www.sec.gov.
Except
to
the
extent
otherwise
required
by
federal
securities
laws,
we
do
not
undertake
to
address
or
update
forward-looking
statements
in
future
filings
or
communications
regarding
our
business
or
operating
results. |
 3
©
2014 Molina Healthcare, Inc.
Approx. Time
Topic
Speaker
12:30pm-12:35pm
Opening Remarks
Juan José
Orellana, SVP Investor
Relations
12:35pm-1:10pm
Business Overview
Dr. J. Mario Molina, Chief Executive
Officer
1:10pm-1:45pm
Medical Margin: Results & Initiatives
Terry Bayer, Chief Operating Officer
1:45pm-2:00pm
Q&A
2:00pm-2:15pm
Break
2:15pm-2:45pm
Changing Medical Cost Profile
Joseph White, Chief Accounting Officer
2:45pm-3:05pm
Q&A
3:05pm-3:50pm
Guidance
John Molina, Chief Financial Officer
3:50pm-4:30pm
Q&A
4:30pm
End of Program
Today |
 Business Overview
J. Mario Molina, M.D.
President & Chief Executive Officer
February 13, 2014
New York, New York |
 5
©
2014 Molina Healthcare, Inc.
Presence in Key Medicaid Markets
1.
Reflects
preliminary
enrollment
figures.
2.
As
of
September
1,
2013,
Illinois
health
plan
began
serving
ABD
members.
3.
As
of
January
1,
2014,
South
Carolina
health
plan
began
serving
South
Carolina
Medicaid
members,
as
a
result
of
the
South
Carolina
Solutions
asset
acquisition.
2.1 million members
Health Plan Enrollment as of February 2014
Footprint includes 4 of 5 largest Medicaid Markets
Enrollment by Product
Medicare 2%
CHIP
Aged,
Blind
or
Disabled
1 |
 6
©
2014 Molina Healthcare, Inc.
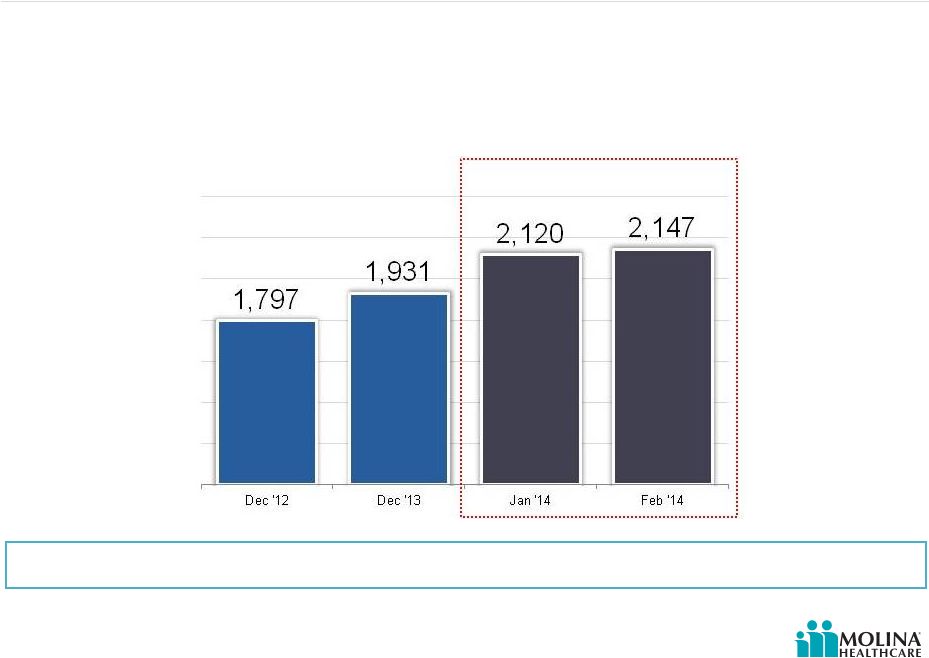
Health Plan Enrollment Growth
(in thousands)
Molina Healthcare
Health Plan Enrollment Growth
Dec 2013 -
Feb 2014
(1) (2)
Enrollment grew 11% since December 2013
1.
February 2014 enrollment based on preliminary figures.
2.
As of January 1, 2014, South Carolina health plan began serving South Carolina
Medicaid members, as a result of the South Carolina Solutions asset acquisition.
Please refer to the Company’s cautionary statements.
|
 7
©
2014 Molina Healthcare, Inc.
Long Term Revenue Growth
Estimated potential revenue run-rate by year-end 2015
Please refer to the Company’s cautionary statements.
1.
Estimated amounts are subject to change.
2.
Includes revenue estimates from: New Mexico (Lovelace), and South Carolina
(Community Health Solutions assets) acquisitions; dual eligibles in CA, MI, OH, SC, TX, IL; Medicaid expansion in CA,
IL,
MI, OH, NM, and WA; and Marketplace in CA, FL, MI, NM, TX, UT, WA, OH, and WI. Duals
in TX only applies to 2015. |
 8
©
2014 Molina Healthcare, Inc.
Revenue by Product
Revenue shift to chronic care is changing our medical cost profile
Please refer to the Company’s cautionary statements.
1.
For 2014, TANF includes Medicaid expansion and Marketplace lives.
|
 9
©
2014 Molina Healthcare, Inc.
Shift from an Acute Care Company to a Chronic Care Company
Business requirements are
changing as we take on more
complex patients
Member retention
Emphasis on quality and
ratings
Reduction of unnecessary
utilization
Risk adjustment |
 10
©
2014 Molina Healthcare, Inc.
Health Plan Footprint & Planned Growth
Fully Integrated Dual Eligible Pilots
Long Term Care Medicaid
Health Plan Markets
WA
CA
UT
NM
TX
IL
MI
WI
OH
SC
FL
Please refer to the Company’s cautionary statements.
|
   11
©
2014 Molina Healthcare, Inc.
Medicaid Expansion
Where Molina States Stand on Medicaid Expansion as of February 7,
2014
Expanding Coverage
Considering Expansion
Not Expanding Coverage at this Time
CA
WA
UT
NM
TX
WI
MI
FL
OH
SC
1.
The
Advisory
Board
Company.
Beyond
the
pledges:
Where
the
states
stand
on
Medicaid.
IL
1 |
 12
©
2014 Molina Healthcare, Inc.
Medicaid Application Activity & Woodwork Effect
Surge in Medicaid applications
reported
Plagued by processing delays &
backlogs
Difference between ‘deemed’
eligible & actually enrolled
Transition time from federal
exchange to the state programs
unknown
Trust remains an issue |
 13
©
2014 Molina Healthcare, Inc.
Molina Awarded Contract for Duals in Los Angeles County
Selected to participate as direct
contractor
Largest duals demo in the country
(State caps demo at 200K)
Leverages existing ABD and
Medicare SNP provider network
Complements other duals service
areas in the State: Riverside, San
Bernardino, San Diego
Passive enrollment to begin no
sooner than 7/2014
20K dual eligible members
anticipated
1.
Enrollment estimate does not include op-out.
1 |
 14
©
2014 Molina Healthcare, Inc.
Molina Medicare-Medicaid Plan (MMP) Implementations
State
Estimated
Lives
in Molina
Markets
Voluntary
Enrollment
Passive
Enrollment
California
(Riverside, San Bernardino &
San Diego counties)
122K
4/1/14
5/1/14
California
(Los Angeles county)
200K
TBD
7/1/14
Illinois
18K
3/1/14
6/1/14
Michigan
62K
10/1/14
1/1/15
Ohio
48K
6/1/14
1/1/15
South Carolina
54K
7/1/14
1/1/15
TX
121K
1/1/15
1/1/15
1.
Estimated lives are based on state reports.
2.
All dates are subject to change.
3.
Reflects Medicare MMP passive enrollment. Medicaid MMP Passive enrollment occurs
6/1/2014. 1
2
2
3 |
 15
©
2014 Molina Healthcare, Inc.
Cost of Care |
 16
©
2014 Molina Healthcare, Inc.
Duals –
Model of Care
Integrated
LTSS/Acute
And Rx
Care
Transition
Programs
Measuring
Improvements
Individualized
Care Plans
Medication
Reviews
and
Medication
Therapy
Mgmt
Interdisciplinary
Care Teams
Health Risk
Assessments
Care
Management
Dual Eligibles
Most Common Diagnoses
Inpatient Services:
Affective psychosis
Septicemia
Care involving use of
rehab procedures
Pneumonia
Chronic bronchitis
Outpatient Services:
Essential hypertension
Respiratory and other
chest
Diabetes mellitus
Fever and fatigue
Joint disorders
Personal
Care
Attendants/
Caregivers
Dual
Eligible |
 17
©
2014 Molina Healthcare, Inc.
Mitigating Our Risk with the Dual Eligible
Duals may have chronic
conditions and higher costs
over time
Risk adjusters
Rate corridors
Settlement agreement (CA)
Savings assumptions |
 18
©
2014 Molina Healthcare, Inc.
Mitigating our Duals Risk –
Savings Assumptions
CMS Rate Setting Process
Guidance
Sample Aggregate Savings
Targets
Under the Demonstrations
1.
CMS Joint Rate Setting Process Under the Capitated Financial Alignment
Initiative. 2.
Memorandums of Understanding (MOU) between CMS and the State of California,
Illinois, Ohio, and South Carolina.
3.
Savings targets weighted by estimated 2014 member months.
Molina Duals States
Weighted Average Aggregate
Savings Targets
Savings targets may differ among
States with low historic Medicare spending,
low utilization of institutional long-term care
services, or a high penetration of Medicaid
managed care.
Savings percentages will be applied equally to the Medicaid and Medicare A/B
components. Rate updates will take place on January 1st of each calendar
year. 1
3
2 |
 19
©
2014 Molina Healthcare, Inc.
Marketplace
Spanish language sites later start
8 out of 10 low-income Americans
still don’t understand the program
Molina pricing assumed higher
medical costs and utilization
Enrolled individuals at Molina health
plans are primarily the uninsured
and previous Medicaid recipients
that had lost their eligibility
Molina Marketplace enrollment
is
7,500
1.
Reflects February 2014 preliminary figures.
1
Enrollment ramp up has been slow
due to delays on federal and state
websites |
 20
©
2014 Molina Healthcare, Inc.
New Medications & Treatments
Coverage of the cost of new
Hepatitis C treatment drug
should be carved out until
sufficient actuarial claims data is
available
Medicaid managed care rates
must factor in claims for the new
treatment (actuarial soundness)
Pricing is extraordinarily cost
prohibitive
Incidence of Hepatitis C in the
Medicaid population is uncertain
but certainly non-negligible
Providers have delayed initiating
alternative treatment resulting in
pent up demand |
 21
©
2014 Molina Healthcare, Inc.
Manage our growth
•
Organic growth
•
Medicaid expansion
•
Dual eligible population
•
RFPs
Leverage our business portfolio
•
Health plan business
•
MMS
•
Direct delivery
Strive for operational excellence
•
Quality care
•
STAR ratings
Strategic Priorities
Our mission is to provide quality
health services to financially
vulnerable families and
individuals covered by
government programs.
Mission
Priorities |
 22
©
2014 Molina Healthcare, Inc. |
 Medical Margin: Results & Initiatives
Terry Bayer
Chief Operating Officer
February 13, 2014
New York, New York |
 24
©
2014 Molina Healthcare, Inc.
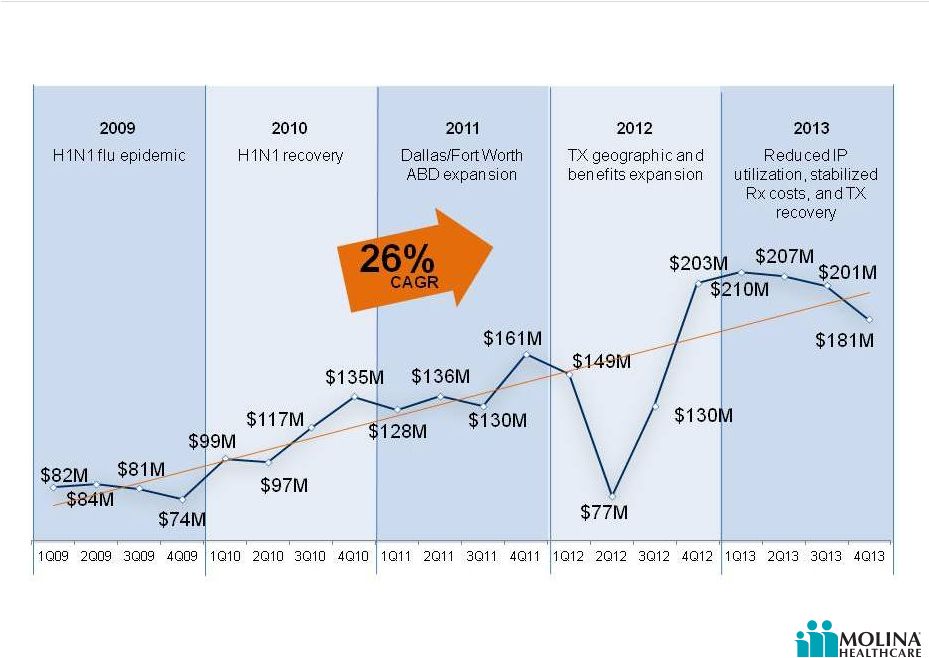
Historical Medical Margin
Molina Medical Margin
Q1 2009-Q4 2013 |
 25
©
2014 Molina Healthcare, Inc.
Key Impact Areas
Activities focused on improving
Medical Margins
Health Care Services (Model of
Care)
Focus on Quality
Member Retention |
 26
©
2014 Molina Healthcare, Inc.
Key Impact Area -
Molina Care Model
The Model of Care
confirms/reestablishes the
member’s connection to their
Medical Home. Ensures
appropriate use of services
and facilities.
High touch
Focus on care transitions
Prevention of hospital
admissions/readmissions
Appropriate ER utilization |
 27
©
2014 Molina Healthcare, Inc.
Model of Care –
Historical vs. Current
Historical Model:
Insurance driven by
acute, episodic care
Reactive
Silos
Discharge planning
Telephonic
management
Pharmacy on
formulary
Current Model:
Member centric
management & care
delivery
Proactive
Integrated team
Care transitions
Face-to-face
interactions
Medication therapy
management |
 28
©
2014 Molina Healthcare, Inc.
Community Connector Case Study –
Washington
67-year-old woman with
multiple personalities,
depression, anxiety, a history
of suicidal ideations,
hypothyroidism, asthma,
hypertension, congestive
heart failure and
osteoarthritis.
Image for illustrative purposes only. Not actual patients.
|
 29
©
2014 Molina Healthcare, Inc.
Community Connector Case Study –
South Carolina
Single father reached out for
assistance for behavior
modification for his teenage
daughter who is a Molina
member. Was not interested
in mental health services.
Image for illustrative purposes only. Not actual patients.
|
 30
©
2014 Molina Healthcare, Inc.
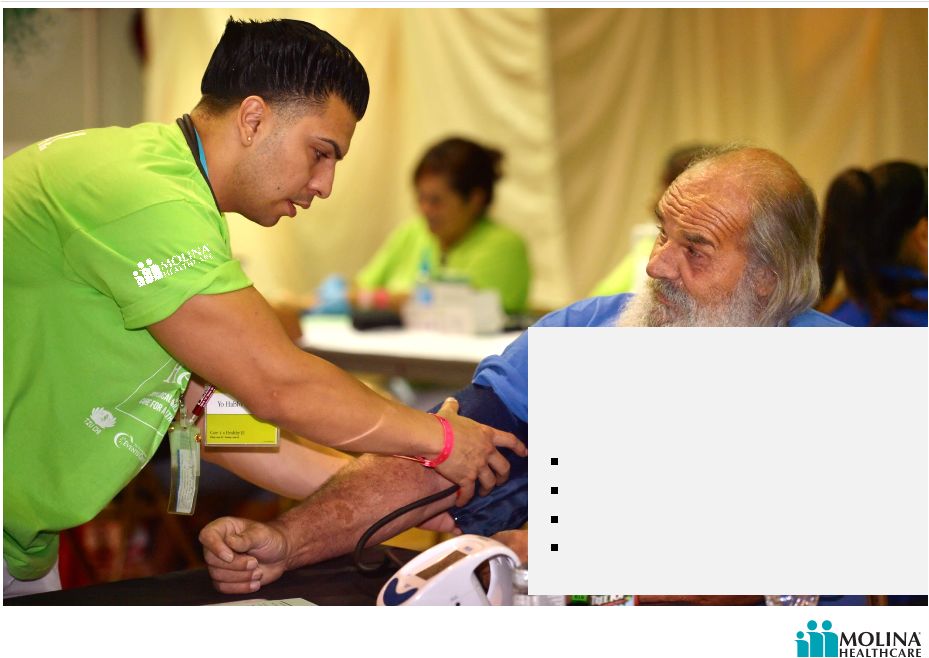
Community Connector Case Study -
Washington
74-year-old member has COPD,
hypertension, diabetes, and
muscular degeneration. He is also
an alcoholic, has poor nutritional
habits, and no family to support him.
Image for illustrative purposes only. Not actual patients.
|
 31
©
2014 Molina Healthcare, Inc.
Monitoring and Care Management: California
Reduction in manageable inpatient utilization in a previously unmanaged new
population Admits/K reduction of 7%
1.
Molina Internal Analytics.
Molina Healthcare of California
Admits/K
1 |
 32
©
2014 Molina Healthcare, Inc.
Patient Centered Medical Home (PCMH) Impact: New Mexico
PCMH Readmits/K 63% less than Non PCMH
Readmission rates lower among PCMH members vs.
Non PCMH members
1.
Journal of Community Health. “Community Health Workers and Medicaid Managed
Care in New Mexico”, June, 2012. |
 33
©
2014 Molina Healthcare, Inc.
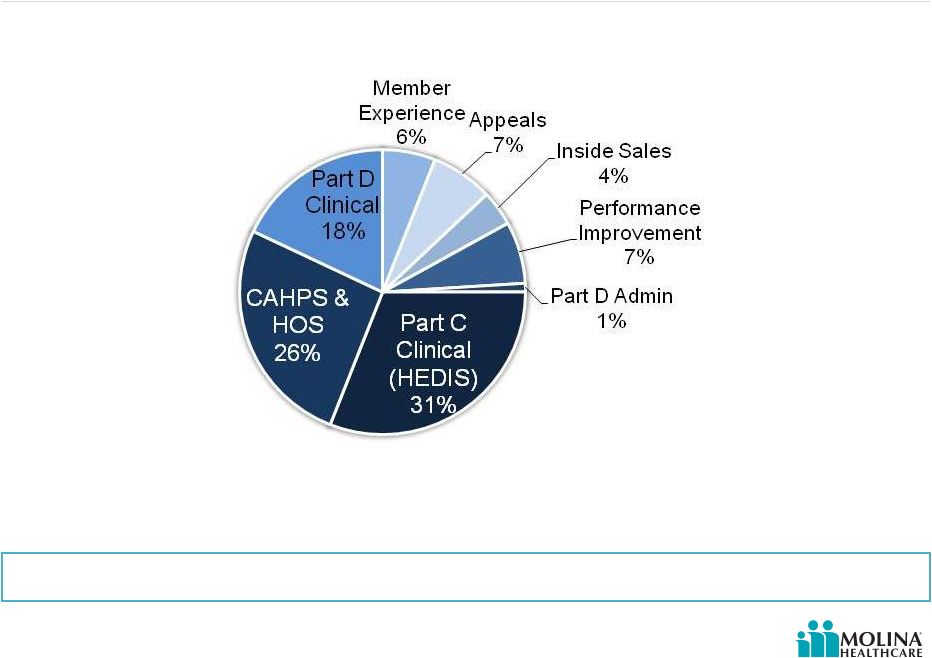
Categories & Measurements Contributing to Medicare STAR Ratings
Quality improves margin by increasing pay for performance revenue &
removing barriers to care
Data to support STAR ratings come from surveys, claims data, and
medical records
CAHPS = Consumer Assessment of Healthcare Providers and Systems
HOS = Health Outcomes Survey
HEDIS = Healthcare Effectiveness Data and Information Set
|
 34
©
2014 Molina Healthcare, Inc.
2012
2013
2014
2015
2016
Care
Delivered
Measurement
& Publication
2014 Ratings
In Use
2015 Ratings
In Use
Measurement
& Publication
Care
Delivered
2016 Ratings
In Use
Measurement
& Publication
Care
Delivered
Star Ratings Data Timeframes |
 35
©
2014 Molina Healthcare, Inc.
Key Impact Area –
Focus on Quality
Align incentives to improve
quality results
Provider incentive programs
Member HEDIS incentive
programs
Align provider payments to quality
metrics |
 36
©
2014 Molina Healthcare, Inc.
Key Impact Area -
Retention Model
Ensuring that members stay with
us as we grow, and that we are
meeting their healthcare needs
Welcome calls
30, 60, and 90 day touch point calls
Personal Care Assistant (PCA)
Escalation team |
 37
©
2014 Molina Healthcare, Inc.
Q&A |
 ©
2014 Molina Healthcare, Inc.
Changing Medical Cost Profile
Joseph White
Chief Accounting Officer
February 13, 2014
New York, New York |
 39
©
2014 Molina Healthcare, Inc.
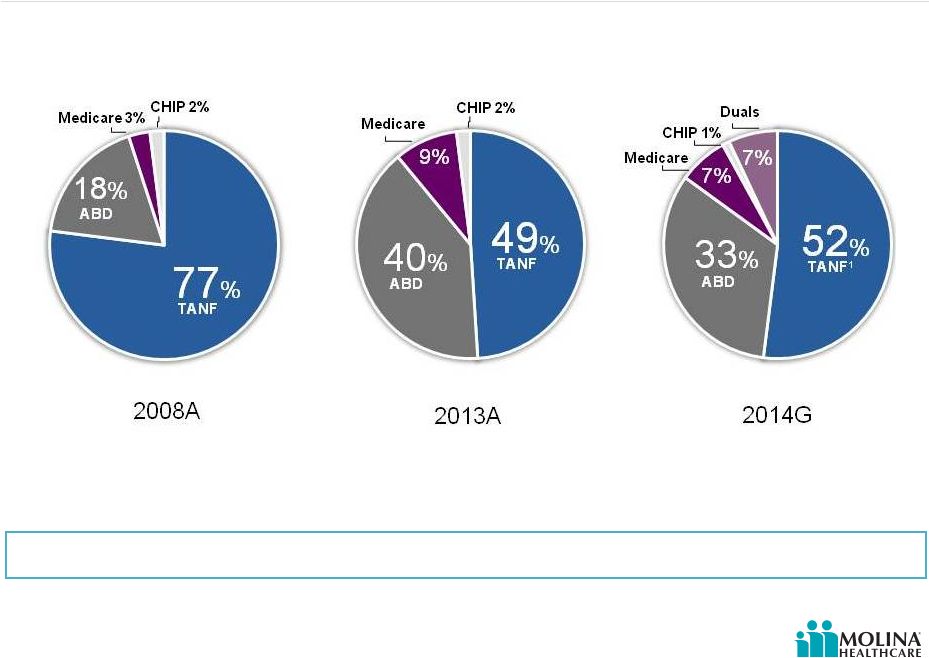
Revenue by Product
2008A
2013A
2014G
Revenue shift to chronic care is changing our medical cost profile
49%
TANF
40%
ABD
Medicare
9%
CHIP 2%
77%
TANF
18%
ABD
Medicare 3%
CHIP 2%
Please refer to the Company’s cautionary statements.
TANF¹
52%
33%
ABD
Medicare
7%
7%
Duals
CHIP 1%
1.
For 2014, TANF includes Medicaid expansion and Marketplace lives.
|
 40
©
2014 Molina Healthcare, Inc.
Revenue Shift to Chronic Care is Changing our Medical Cost Profile
PMPM
Molina Healthcare of Ohio
Medical cost PMPM by type of member
LTC = Long Term Care
BH = Behavioral Health
Rx = Pharmacy
OP = Outpatient
IP = Inpatient
Please refer to the Company’s cautionary statements. |
 41
©
2014 Molina Healthcare, Inc.
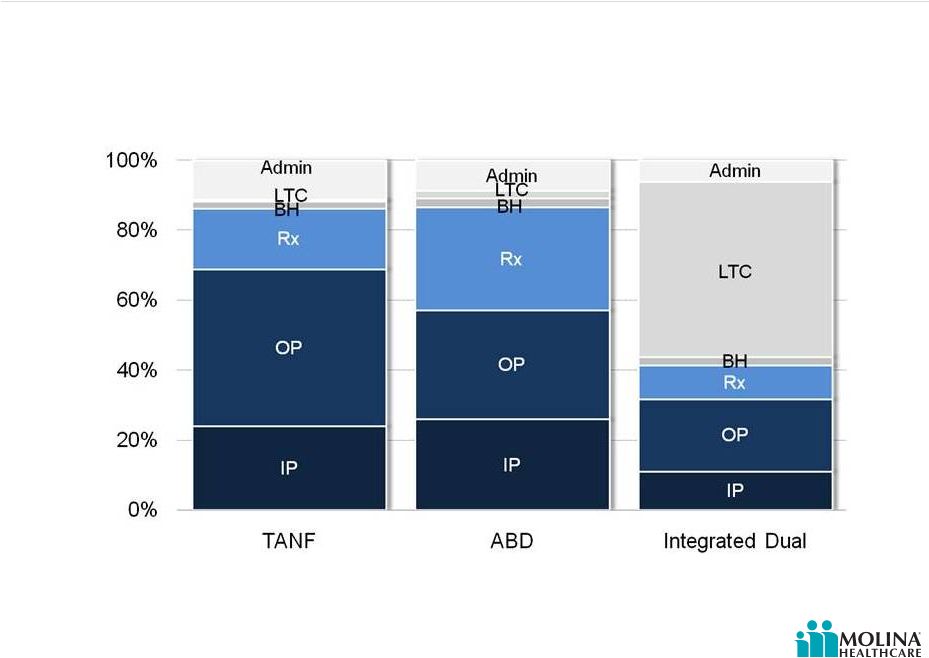
% of Revenue
Molina Healthcare of Ohio
Medical Spend % by Type of Member
LTC = Long Term Care
BH = Behavioral Health
Rx = Pharmacy
OP = Outpatient
IP = Inpatient
Please refer to the Company’s cautionary statements.
Revenue Shift to Chronic Care is Changing our Medical Cost Profile
|
 42
©
2014 Molina Healthcare, Inc.
Greater significance of risk adjustment
Payment linked to health status and demographic characteristics of the member
Document medical conditions
Process must lead to improved outcomes
Greater importance of medically related administrative cost
Care coordination
Community connectors
New contracts and new providers
Home Health providers
In home assessments
Shorter payment cycles
More claims
More frequent submission
Smaller dollars
Changing Medical Cost Profile
Chronic care needs of our members are changing our medical cost profile
|
 43
©
2014 Molina Healthcare, Inc.
Risk Adjusted Revenue is Growing
1.
MMP = Medicare-Medicaid Plan (Duals).
Please refer to the Company’s cautionary statements. |
 44
©
2014 Molina Healthcare, Inc.
Administrative Costs
TANF & ABD
Integrated Dual
% of Population
to be care
managed
1%
100%
$12
Administrative costs to support Integrated Duals members are nearly seven times
higher than a typical TANF or ABD member
Percentage of population requiring care
management
2014E Administrative Costs
Source: Molina Health of Ohio data. |
 45
©
2014 Molina Healthcare, Inc.
Q&A |
 ©
2014 Molina Healthcare, Inc.
2014 Guidance
John Molina
Chief Financial Officer
February 13, 2014
New York, New York |
 47
©
2014 Molina Healthcare, Inc.
Cautionary Statement
Safe
Harbor
Statement
under
the
Private
Securities
Litigation
Reform
Act
of
1995:
This
2014
Guidance
presentation
and
our
accompanying
oral
remarks
contain
numerous
“forward-looking
statements”
regarding:
expected
financial
results;
and
various
other
matters.
All
of
our
forward-looking
statements
are
subject
to
numerous
risks,
uncertainties,
and
other
factors
that
could
cause
our
actual
results
to
differ
materially.
Anyone
viewing
or
listening
to
this
presentation
is
urged
to
read
the
risk
factors
and
cautionary
statements
found
under
Item
1A
in
our
annual
report
on
Form
10-K,
as
well
as
the
risk
factors
and
cautionary
statements
in
our
quarterly
reports
and
in
our
other
reports
and
filings
with
the
Securities
and
Exchange
Commission
and
available
for
viewing
on
its
website
at
www.sec.gov.
Except
to
the
extent
otherwise
required
by
federal
securities
laws,
we
do
not
undertake
to
address
or
update
forward-looking
statements
in
future
filings
or
communications
regarding
our
business
or
operating
results. |
 48
©
2014 Molina Healthcare, Inc.
The Opaque Crystal Ball
Please refer to the Company’s cautionary statements.
|
 49
©
2014 Molina Healthcare, Inc.
Themes
2013
2015
2014
Build
Transition
Consolidation
Pursuing new
business
Designing &
implementing
programs and systems
Documenting
readiness
Incurring cost before
2014 revenue
Upcoming:
o
SC & IL
o
MMP Duals
o
Marketplace
o
Medicaid expansion
o
NM & FL Re-procurement
o
WI Medicare
Transitioning
members into model
of care
Mitigating pent-up
demand
Right-sizing premiums
Mitigating transition
issues
Incurring cost before
2015 revenue
Refining & enhancing
model of care
Refining & enhancing
programs and systems
Improving margins
Please refer to the Company’s cautionary statements.
|
 50
©
2014 Molina Healthcare, Inc.
Revenue
Premium Revenue
ACA Fee Reimbursement
Premium Tax Revenue
Service Revenue
Investment and Other Revenue
Total Revenue
Total Medical Care Costs
Medical Care Ratio
1
Total Service Costs
General & Administrative Expenses
G&A Ratio
2
Premium Taxes
ACA Insurer Fee
Depreciation & Amortization
Interest Expense
Income Before Taxes
EBITDA
Effective Tax Rate
Adjusted EPS
3
~$9.2B
~$140M
~$275M
~$210M
~$20M
~$9.9B
~$8.2B
~89%
~$170M
~$770M
~8%
~$275M
~$85M
~$100M
~$55M
~$210M
~$385M
55% -
59%
$4.00 -
$4.50
2014
Guidance
2014 Guidance
Note: Amounts are estimates and subject to change. Actual results may differ
materially. See our risk factors as discussed in our Form 10-K and other periodic filings.
1.
Medical
Care
Ratio
represents
medical
care
costs
as
a
%
of
premium
revenue.
2.
G&A
ratio
computed
as
a
percentage
of
premium
revenue,
plus
service
revenue.
3.
Assumes
47.7M
average
diluted
shares
outstanding.
Low
and
high
guidance
ranges
assume
full
reimbursement
of
the
ACA
fee
and
related
tax
effects.
See
Appendix
for
a
reconciliation
of
adjusted
EPS
to
GAAP
diluted
net
income
per
share.
Please refer to the Company’s cautionary statements.
|
 51
©
2014 Molina Healthcare, Inc.
New Product Membership Included in 2014 Guidance
January
2014
March
2014
State
Various
CA, NM,
& WA
NM
SC
WI
OH
IL
4
Program
Type
Marketplace
Medicaid
Expansion
LTC
Medicaid
SNP
Medicaid
Expansion
MMP Duals
4
Eligible
2M
1.4M
44K
740K
28K
275K
18K
Enrollees
15K
160K
5K
125K
1K
30K
5K
Revenue
PMPM
$300
$550
$1,600
$200
$1,100
$450
$1,800
MCR
88%
88%
93%
90%
82%
86%
95%
Opt Out
N/A
N/A
N/A
N/A
N/A
N/A
40%
4
Note:
Constitutes forward-looking guidance. Amounts are estimates and subject to
change. Actual results may differ materially. See our risk factors as discussed in our Form 10-K and other periodic filings.
1. Denotes total number of eligible members in Molina markets.
2.
Denotes
membership
assumed
in
guidance
at
year-end
2014.
MMP
Dual
denotes
enrollment
after
opt-out.
3. Revenue PMPM and MCR are net of premium tax and ACA fee. Denotes full premium for
MMP Duals. 4. IL assumes opt out however only waiver (HCBS) members can be
enrolled in MOH Medicaid. Non-waiver (HCBS) members that opt out return to Medicaid FFS. IL MMP Passive enrollment not until 6/1/2014 and 9/1/2014 for Nursing Home & LTSS.
Please refer to the Company’s cautionary statements.
1
2
3
3 |
 52
©
2014 Molina Healthcare, Inc.
New Product Membership Included in 2014 Guidance
April
2014
May
2014
June
2014
July
2014
October
2014
State
MI
CA
4
OH
5
FL
SC
IL
MI
6
Program
Type
Medicaid
Expansion
MMP Dual
4
MMP Duals
(Medicare
Voluntary)
5
Medicaid
(Re-
procurement)
MMP
Duals
Medicaid
Expansion
MMP
Duals
6
Eligible
500K
322K
48K
1.2M
54K
300K
62K
Enrollees
45K
30K
25K
140K
1K
25K
1K
Revenue
PMPM
$450
$2,000
$3,700
$280
$2,000
$550
$2,500
MCR
87%
94%
97%
88%
94%
88%
92%
Opt Out
N/A
50%
4
90%
5
N/A
50%
N/A
50%
6
Note:
Constitutes forward-looking guidance. Amounts are estimates and subject to
change. Actual results may differ materially. See our risk factors as discussed in our Form 10-K and other periodic filings.
Please refer to the Company’s cautionary statements.
3
3
2
1
1. Denotes total number of eligible members in Molina markets.
2.
Denotes
membership
assumed
in
projection
at
year-end
2014.
MMP
Dual
denotes
enrollment
before
opt
for
CA,
OH
and
SC
and
after
opt-out
for
MI.
3. Revenue PMPM and MCR are net of premium tax and ACA fee; Denotes full
premium for MMP Duals. 4.
Riverside,
San
Bernardino
&
SanDiego
assume
50%
opt
out.
RS,SB,
SDopt
-outs
participates
in
MOH
Medicaid
LTSS.
MOH
awarded
20K
members
in
Los
Angeles,
assumes
50%
opt-out.
In
LA,
HNT
provides
Medicaid
LTSS
to
opt-outs.
5.
OH
passive
enrollment
for
MMP
Medicare
is
delayed
until
1/1/2015.
Only
members
that
volunteer
and
select
will
participate
in
both
Medicaid
and
Medicare
MMP.
6.
MI
assumes
50%
opt
out
and
members
that
opt
out
are
no
longer
enrolledin
MMP
program. |
 53
©
2014 Molina Healthcare, Inc.
Status of Reimbursement –
ACA Fee in Molina States
Our
guidance
assumes
the
ACA
fee
and
related
tax
effects
will
be
fully
reimbursed
in
all
states.
Comments
ACA Fee
Gross Up
Reimbursemen
t Revenue
Reimbursement Not
Yet Achieved
Ohio
Actuarial rate memorandum (Mercer) calls for reimbursement of fee - silent on
tax impact.
$17M
$13M
$30M
$30M
Washington
Contract specifically calls for reimbursement of fee and tax impact.
$15M
$9M
$24M
$0M
Texas
Informal Support from State
$11M
$6M
$18M
$18M
Michigan
Actuarial rate memorandum (Milliman) calls for reimbursement of fee and tax
impact.
$10M
$6M
$16M
$16M
California
CA DHCS All Plan Meeting; "Mercer is working with DHCS…to develop an appropriate
reimbursement/addition….that recognizes MCO specific circumstances regarding the Fee"
2.11.14
$9M
$5M
$14M
$14M
New Mexico
State has indicated in a phone call Feb 4th with company staff they are awaiting
CMS guidance before committing
$7M
$4M
$11M
$11M
Florida
Letter from AHCA to FL Association of Health Plans 1/23/14; Our plan is to provide funds to managed
care plans once they have received federal invoices specifying the amount of liability
associated with their Florida Medicaid revenue….we also expect that it will be appropriate
to consider the income tax impact of the fee
$3M
$2M
$5M
$5M
Utah
Informal Support from State
$3M
$2M
$5M
$5M
Wisconsin
Contract specifically calls for reimbursement of fee and tax impact.
$3M
$1M
$4M
$0M
Illinois
Contract specifically calls for reimbursement of fee and tax impact.
$0M
$0M
$0M
$0M
Medicare
Included in bid pricing
$7M
$5M
$12M
$0M
TOTAL
$85M
$55M
$140M
$100M
Note:
Constitutes forward-looking guidance. Amounts are estimates and subject to
change. Actual results may differ materially. See our risk factors as discussed in our Form 10-K and other periodic filings.
Please refer to the Company’s cautionary statements.
|
 54
©
2014 Molina Healthcare, Inc.
Base Business Net Rate Changes Included in 2014 Guidance
State
FINAL
Effective Date
Rate Change
California
Oct-13
+2.5%¹
Florida
Sep-13
+1.0%²
Illinois
Jan-14
(-3.0%)¹
Michigan
Oct-13
+1.0%¹
New Mexico
Jan-14
0.0%
1,2
Ohio
Jan-14
2.0%
1,3
South Carolina
Jan-14
New Rates
Texas
Apr-14
0.0%²
Utah
Jan-14
+0.5%
Washington
Jan-14
0.0%
1, 2, 3
Wisconsin
Jan-14
+1.0%¹
Note:
1.
All rate changes exclude new product and benefit expansions effective after Dec 31,
2013. 2.
Net of fee schedule adjustments.
3.
All rate changes exclude risk adjustment.
Please refer to the Company’s cautionary statements.
|
 55
©
2014 Molina Healthcare, Inc.
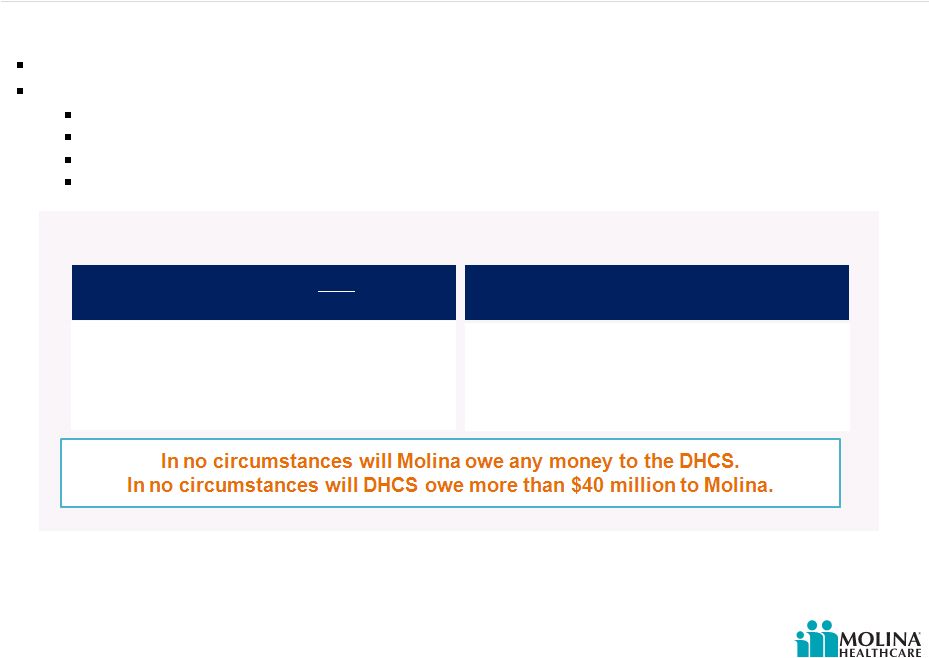
DHCS Agreement -
Settlement Account
Target
Profitability
margin
is
less
than
3.25% for any year
50% (75% for 2014 only) of difference between
actual and target profitability margins multiplied by
the applicable premium revenue is payable to
Molina
Target Profitability margin exceeds 3.25%
for any year
50% (75% for 2014 only) of difference between
actual and target profitability margins multiplied by
the applicable premium revenue reduces any
amount otherwise due to Molina under the
settlement from other years
Note -
profitability margin is calculated as follows:
Target
profitability
margin
-
Profit
÷
Premiums
earned
Premiums
earned
-
Gross
premiums:
(-)
Less
premium
taxes
and
ACA
insurer
fee
Profit -
Premiums earned: (-) Less medical cost and G&A expenses incurred
Effective January 1, 2014
Settlement account to serve as a risk corridor for all direct contracts with DHCS
Maximum of $40 million available over a 4 year period
Contracts directly with DHCS: Sacramento, San Bernardino / Riverside, & San
Diego Dual Eligible Demonstration contracts
Does NOT apply to Marketplaces, Medicare SNP & subcontract arrangements
Settlement Calculation
California settlement protects margin for California year 1 profitability
uncertainties Please refer to the Company’s cautionary statements.
|
 56
©
2014 Molina Healthcare, Inc.
Guidance Assumes G&A Leverage
Our FY 2014 mid-point guidance assumes G&A
expenses of $770M or 8%
of total revenues.
Approximately $110M or 1% of our total
revenues is required to support growth.
G&A Expense
2014
2014 Growth
Current
Business
Note(s):
1.
G&A ratio computed as a percentage of premium revenue, net of premium taxes
& ACA fee reimbursement, plus service revenue. 2.
Constitutes forward-looking guidance. Amounts are estimates and subject to
change. Actual results may differ materially. See our risk factors as discussed in our Form 10-K and other periodic filings.
Total G&A
2015 Implementation
Costs
1%
8%
2014 Guidance G&A
Ratio by Quarter
1, 2
Q114 –
8.9%
Q214 –
8.6%
Q314 –
7.9%
Q414 –
7.5%
$5M
Please refer to the Company’s cautionary statements.
7%
$770M
1
2 |
 57
©
2014 Molina Healthcare, Inc.
Headwinds into 1Q2014
Net
($0.92)
Continued administrative spend ahead of revenue
G&A expenses incurred in anticipation of related revenues will reduce first
quarter GAAP & Adjusted EPS by (~$0.38)
Possible delay in revenue recognition
Delayed
recognition
of
ACA
fee
reimbursement
may
reduce
first
quarter
GAAP & Adjusted EPS by (~$0.33)
Delays
in
recognition
of
at
risk
revenue
may
reduce
first
quarter
GAAP
&
Adjusted EPS by (~$0.21)
Programmatic delays
Substantial uncertainty around Q1 results
1.
Constitutes forward-looking guidance. Amounts are estimates and subject to
change. Actual results may differ materially. See our risk factors as discussed in our Form 10-K and other periodic filings.
2.
Delayed recognition of ACA fee and related tax effects. Assumes no 1Q-14
recognition of ACA revenue in CA, FL, MI, NM, OH, TX and UT. Please refer to
the Company’s cautionary statements. 1
2
Note(s): |
 58
©
2014 Molina Healthcare, Inc.
Appendix |
 59
©
2014 Molina Healthcare, Inc.
Reconciling Adjusted EPS Ranges
Please refer to the Company’s cautionary statements.
Note(s):
Low End
High End
Adjusted net income per diluted share, continuing operations
$4.00
$4.50
Less non-cash adjustments, net of tax:
Depreciation, and amortization of capitalized software
$1.29
$1.29
Stock based compensation
$0.48
$0.48
Amortization of convertible senior notes and lease financing
obligations
$0.31
$0.31
Amortization of intangible assets
$0.27
$0.27
Net income (loss) per diluted share, continuing operations
$1.65
$2.15
*Assumes 47.7M average weighted diluted shares outstanding
1
2
2
1.
Constitutes forward-looking guidance. Amounts are estimates and subject to change. Actual results
may differ materially. See our risk factors as discussed in our Form 10-K and other periodic filings.
2.
Adjusted net income per diluted share, continuing operations, is a non-GAAP measure. The table
above reconciles adjusted net income per diluted share, which the Company believes to be the most comparable
GAAP measure to net income (loss) per diluted shares. GAAP stands for Generally Accepted Accounting
Principles. |