Attached files
| file | filename |
|---|---|
| 8-K - 8-K - ION GEOPHYSICAL CORP | a8k-q42013earnings.htm |
| EX-99.1 - EARNINGS RELEASE - ION GEOPHYSICAL CORP | ex991earningsrelease4q-13.htm |

ION Earnings Call – Q4 2013 Earnings Call Presentation February 13, 2014

Corporate Participants and Contact Information CONTACT INFORMATION If you have technical problems during the call, please contact DENNARD–LASCAR Associates at 713 529 6600. If you would like to view a replay of today's call, it will be available via webcast in the Investor Relations section of the Company's website at www.iongeo.com for approximately 12 months. BRIAN HANSON President and Chief Executive Officer GREG HEINLEIN Senior Vice President and Chief Financial Officer 2

Forward-Looking Statements The information included herein contains forward-looking statements within the meaning of Section 27A of the Securities Act of 1933 and Section 21E of the Securities Exchange Act of 1934. Actual results may vary fundamentally from those described in these forward-looking statements. All forward-looking statements reflect numerous assumptions and involve a number of risks and uncertainties. These risks and uncertainties include risk factors that are disclosed by ION from time to time in its filings with the Securities and Exchange Commission. 3

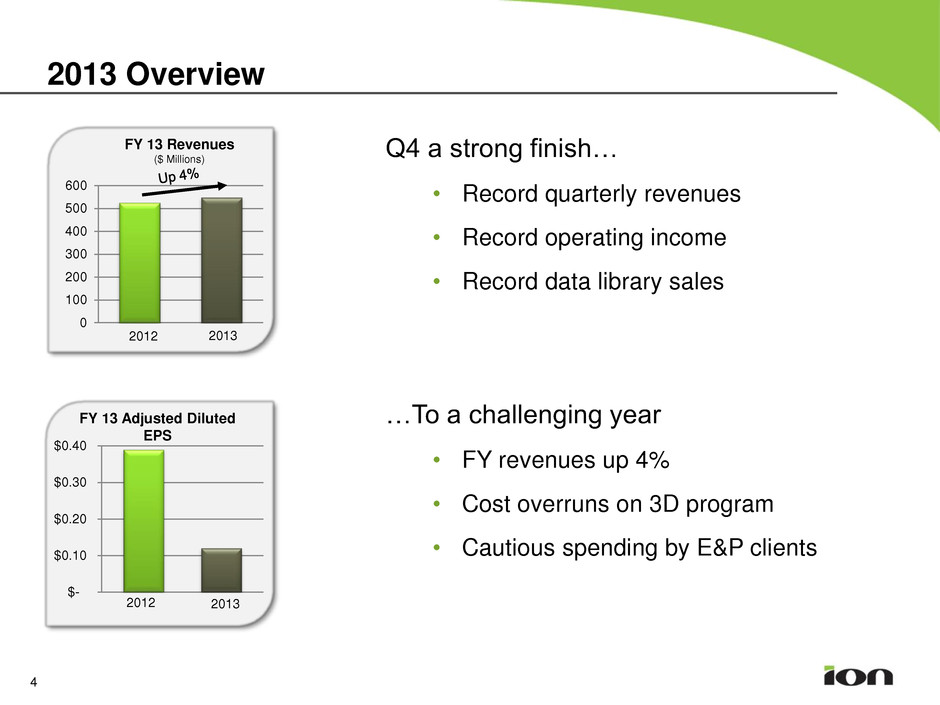
2013 Overview 4 $- $0.10 $0.20 $0.30 $0.40 2012 2013 FY 13 Adjusted Diluted EPS Q4 a strong finish… • Record quarterly revenues • Record operating income • Record data library sales …To a challenging year • FY revenues up 4% • Cost overruns on 3D program • Cautious spending by E&P clients FY 13 Revenues ($ Millions) 0 100 200 300 400 500 600 2013 2012

JV Update 5 Increased ownership to 70% OceanGeo awarded project for Petrotrin Market for seabed seismic continues to develop Ocean bottom seismic strategic to ION JV enables ION to offer an integrated, full-scope solution

6 FY revenues up 13% Y/Y Record data library sales in Q4 – East & West Africa – Gulf of Mexico – India – Brazil Total $76 million Broadened client base – added 16 customers in 2013 Softening in new venture activity and underwriting Anticipate 2014 another back- half year Solutions Segment Multi-client – 2013 Highlights

Solutions Segment Data Processing – 2013 Highlights 7 Record full-year revenues ~$14 - 16 million impact due to contract execution Continued traction for WiBandTM broadband processing – 45 projects complete or in progress Continued expansion to accommodate growing demand 50 75 100 125 FY 2008 FY 2009 FY 2010 FY 2011 FY 2012 FY 2013 ION Data Processing Revenues ($ Millions)

Software Segment 2013 Highlights Strong finish – record Software segment revenues in Q4 4-year Orca® contract renewal Record annual revenue for 4D optimization services Tripled services client base Received patent for NarwhalTM technology Increasing software R&D spend 8

Systems Segment 2013 Highlights Restructured for long-term profitability Introduced refurbishment programs and reduced cost structure within legacy towed streamer product line Shifted focus to seabed market Reduced annual operating costs by ~ $12 million Improved Systems margins Opened state-of-the-art manufacturing facility 9

$- $0.05 $0.10 $0.15 $0.20 $0.25 $0.30 $0.35 Diluted EPS Q4 12 Q4 13 GAAP Q4 13 Adjusted 10 Q4 13 Highlights 22% 30% 0% 10% 20% 30% 40% Adjusted Op. Margin % Q4 12 Q4 13 - 50 100 150 200 250 Q4 12 Q4 13 Software Systems Solutions Revenue $M 0 20 40 60 80 100 120 Q4 13 Q4 12 Adjusted EBITDA $M Record quarter for Revenue and Operating Income: • Revenue $219M • Operating Income $64M Total revenues up 26% vs Q4 2012: • Solutions up 37% • Software up 13% • Systems down 2% Operating Margin increase due to record data library sales

Financial Overview of Special Items Q4 13 11 1. $0.7M Systems restructuring charges 2. $1.6M accrued interest on WesternGeco legal contingency 3. $18.8M INOVA restructuring charges, and $12.4M losses incurred as a result of larger ownership position in OceanGeo = Total $33.5M INOVA’s restructuring reduced their operating costs by ~$12M per year. Reported results exclude $6M revenues in Q4 and $16M YTD from contract. Q4-13 Special Q4-13 As Reported Items As Adjusted Net revenues 218,677$ -$ 218,677$ Cost of sales 115,835 (608) 115,227 Gross profit 102,842 608 103,450 Operating Expenses: Operating expenses 38,611 (146) 38,465 Operating income 64,231 754 1 64,985 Interest expense (net) (4,241) - (4,241) Other income (expense) (2,138) 1,551 2 (587) Equity earnings (losses) (31,906) 31,238 3 (668) Income before income taxes 25,946 33,543 59,489 Income tax expense 6,270 - 6,270 Net income 19,676 33,543 53,219 Income attributable to oncontrolling interests 143 - 143 Net income to common shares 19,819$ 33,543$ 53,362$ Diluted EPS 0.12$ 0.21$ 0.33$

Solutions Segment Financial Overview – Q4 13 12 - 40 80 120 160 200 Q4 12 Q4 13 Revenue by Type $M Data Processing Data Libraries New Ventures Multi-client Investment Year-to-Date $M 80 100 120 140 160 2012 2013 Record quarter driven by broad portfolio of data library sales Solutions segment revenues up 37% Y/Y Record $76M data library sales – Across broad portfolio of library – Significant sales to new customers – ~75% from fully amortized programs New ventures revenue up 9% Y/Y. Continued overall softening in underwriting of new programs. FY 2013 investment of $115M compared to $146M in 2012. Data processing revenues down 9%. Impacted due to contract delay, which will benefit 2014 results by $14-$16M. . 32% 37% 0% 10% 20% 30% 40% 50% Q4 12 Q4 13 Op. Margin %

Software Segment Financial Overview – Q4 13 - 2 4 6 8 10 12 14 Q4 12 Q4 13 Services Software Systems 13 Revenue by Type $M 62% 60% 0% 20% 40% 60% 80% Q4 12 Q4 13 Op. Margin % Software segment revenues up 13% Y/Y Record Q4 and 2nd best quarter ever for revenues Increased Orca software and hardware sales Increased investment in development of new oil company software solutions such as Narwhal

Systems Segment Financial Overview – Q4 13 - 10 20 30 40 50 Q4 12 Q4 13 Towed Streamer Equipment OBC Other 14 Revenue by Type $M 17% 30% 0% 5% 10% 15% 20% 25% 30% 35% Q4 12 Q4 13 Adjusted Op. Margin % Systems segment revenues down 2% Y/Y Declines in new streamer system sales, mostly offset by increased positioning and repair revenues, as well as land geophone sales Increased operating margins as a result of Q3 13 restructurings Down 2%

INOVA Geophysical Financial Overview – Q4 13 (0.3%) (9%) -10% -5% 0% 5% 10% Q4 12 Q4 13 Q4 Op. Margin % 15 - 10 20 30 40 50 60 70 Q4 12 Q4 13 Q4 Revenues $M Q4 2013 – In ION Q1 14 Results • Estimated revenues of $39 to $41M with operating loss of $(3) to $(4M) • BGP purchases of ~70% of revenues, including 32K additional channels of G3i • Decrease in vehicle sales, partially offset by increase G3i rentals in Russia and Hawk in US ION to share in 49% of INOVA’s results. Q3 2013 – In ION Q4 13 Results • Revenues of $41M, break-even operating income, as adjusted - Vehicle sales of 20 Vibrator trucks and 9 UNIVIBs - 32K channels of G3i delivered to BGP - Hawk rental program started with 2 partners • Approx. $12M annual savings resulting from restructuring efforts 0 10 20 30 40 50 Q3 12 Q3 13 Q3 Revenues $M (32%) 0% -40% -30% -20% -10% 0% 10% Q3 12 Q3 13* Q3 Adjusted Op. Margin % *Excludes one-time restructuring charges.

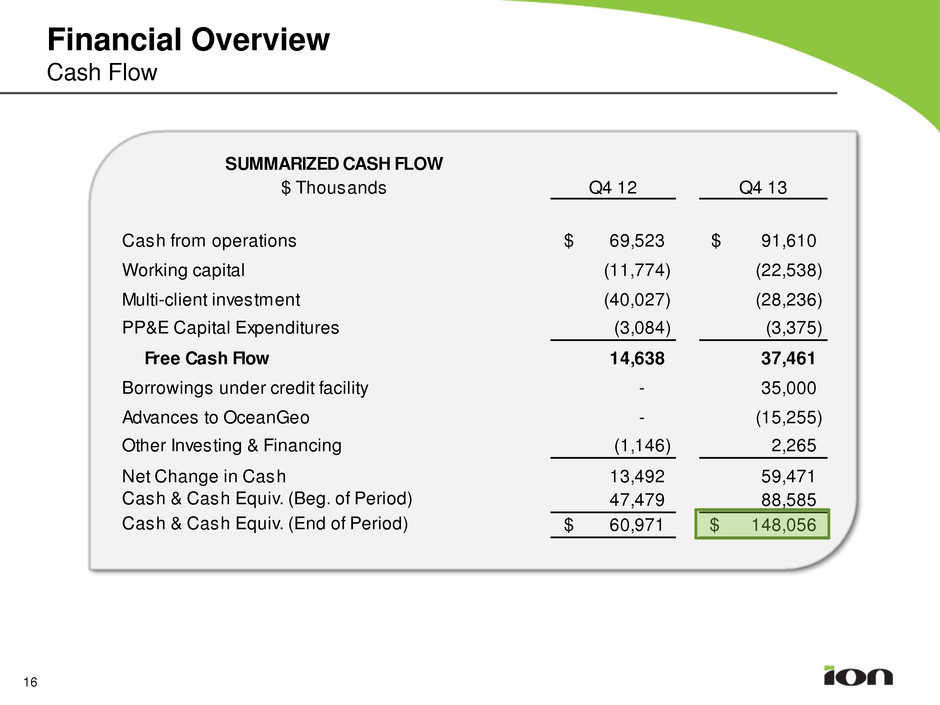
SUMMARIZED CASH FLOW $ Thousands Q4 12 Q4 13 Cash from operations 69,523$ 91,610$ Working capital (11,774) (22,538) Multi-client investment (40,027) (28,236) PP&E Capital Expenditures (3,084) (3,375) Free Cash Flow 14,638 37,461 Borrowings under credit facility - 35,000 Advances to OceanGeo - (15,255) Other Investing & Financing (1,146) 2,265 Net Change in Cash 13,492 59,471 Cash & Cash Equiv. (Beg. of Period) 47,479 88,585 Cash & Cash Equiv. (End of Period) 60,971$ 148,056$ Financial Overview Cash Flow 16

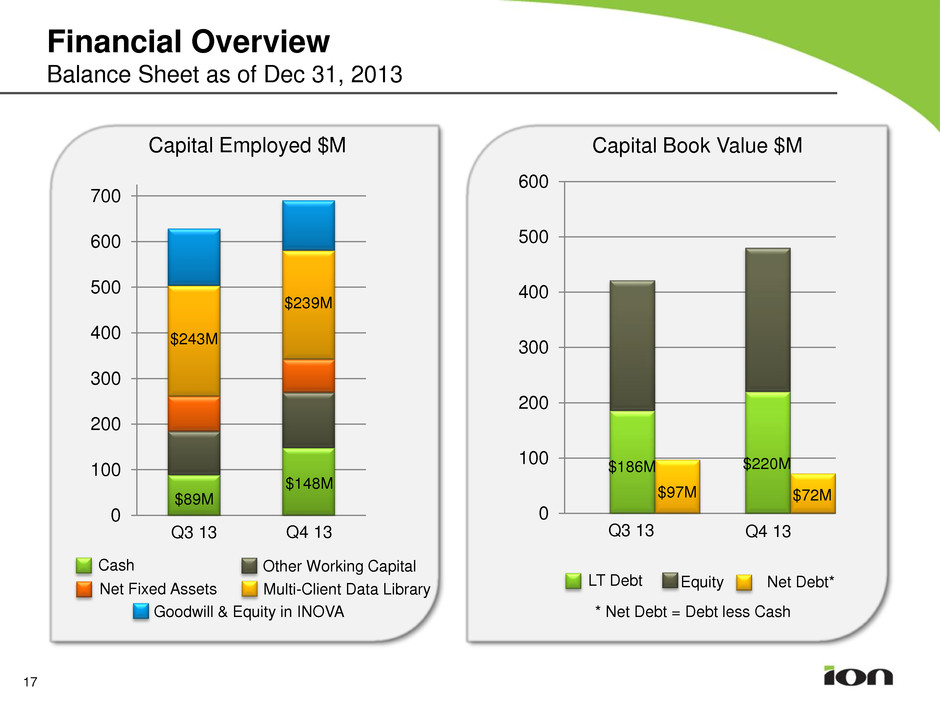
0 100 200 300 400 500 600 0 100 200 300 400 500 600 700 Financial Overview Balance Sheet as of Dec 31, 2013 Capital Employed $M Capital Book Value $M Cash Net Fixed Assets Multi-Client Data Library Goodwill & Equity in INOVA * Net Debt = Debt less Cash $243M $89M Other Working Capital 17 Q4 13 Q3 13 Q3 13 Q4 13 $97M $72M $220M Equity LT Debt Net Debt* $239M $148M $186M

2014 Outlook 18 Expect continued patience in E&P spending Robust data library, well positioned for upcoming licensing rounds Taking measured approach – Buckled down our spending – Completed restructuring – Pragmatic Multi-client investments – Focus on generating positive free cash flow

19 Q&A

20
