Attached files
| file | filename |
|---|---|
| EX-23.1 - EX-23.1 - IMS Health Holdings, Inc. | d628679dex231.htm |
| EX-10.4 - EX-10.4 - IMS Health Holdings, Inc. | d628679dex104.htm |
| EX-10.9 - EX-10.9 - IMS Health Holdings, Inc. | d628679dex109.htm |
| EX-10.23 - EX-10.23 - IMS Health Holdings, Inc. | d628679dex1023.htm |
| EX-10.16 - EX-10.16 - IMS Health Holdings, Inc. | d628679dex1016.htm |
| EX-10.24 - EX-10.24 - IMS Health Holdings, Inc. | d628679dex1024.htm |
Table of Contents
As filed with the Securities and Exchange Commission on February 13, 2014
Registration No. 333-193159
UNITED STATES
SECURITIES AND EXCHANGE COMMISSION
Washington, D.C. 20549
Amendment No. 1
to
FORM S-1
REGISTRATION STATEMENT
UNDER
THE SECURITIES ACT OF 1933
IMS HEALTH HOLDINGS, INC.
(Exact name of registrant as specified in its charter)
| Delaware | 7374 | 27-1335689 | ||
| (State or other jurisdiction of incorporation or organization) |
(Primary Standard Industrial Classification Code Number) |
(I.R.S. Employer Identification Number) |
83 Wooster Heights Road
Danbury, CT 06810
(203) 448-4600
(Address, including zip code, and telephone number, including area code, of registrant’s principal executive offices)
Ari Bousbib
Chairman, Chief Executive Officer & President
83 Wooster Heights Road
Danbury, CT 06810
(203) 448-4600
(Name, address, including zip code, and telephone number, including area code, of agent for service)
Copies to:
| Patrick O’Brien Louis T. Somma Ropes & Gray LLP Prudential Tower 800 Boylston Street Boston, MA 02199 (617) 951-7000 |
Harvey A. Ashman Senior Vice President, General Counsel, External Affairs and Corporate Secretary 83 Wooster Heights Road Danbury, CT 06810 (203) 448-4600 |
David Lopez Cleary Gottlieb Steen & Hamilton LLP One Liberty Plaza New York, New York 10006 (212) 225-2000 |
Approximate date of commencement of proposed sale to public: As soon as practicable after this Registration Statement is declared effective.
If any of the securities being registered on this Form are to be offered on a delayed or continuous basis pursuant to Rule 415 under the Securities Act of 1933, check the following box. ¨
If this Form is filed to register additional securities for an offering pursuant to Rule 462(b) under the Securities Act, check the following box and list the Securities Act registration statement number of the earlier effective registration statement for the same offering. ¨
If this Form is a post-effective amendment filed pursuant to Rule 462(c) under the Securities Act, check the following box and list the Securities Act registration statement number of the earlier effective registration statement for the same offering. ¨
If this Form is a post-effective amendment filed pursuant to Rule 462(d) under the Securities Act, check the following box and list the Securities Act registration statement number of the earlier effective registration statement for the same offering. ¨
Indicate by check mark whether the registrant is a large accelerated filer, an accelerated filer, a non-accelerated filer, or a smaller reporting company. See the definitions of “large accelerated filer,” “accelerated filer” and “smaller reporting company” in Rule 12b-2 of the Exchange Act.
| Large accelerated filer ¨ | Accelerated filer ¨ | Non-accelerated filer x (Do not check if a |
Smaller reporting company ¨ |
The Registrant hereby amends this Registration Statement on such date or dates as may be necessary to delay its effective date until the Registrant shall file a further amendment which specifically states that this Registration Statement shall thereafter become effective in accordance with Section 8(a) of the Securities Act of 1933 or until the Registration Statement shall become effective on such date as the Securities and Exchange Commission, acting pursuant to said Section 8(a), may determine.
Table of Contents
The information in this prospectus is not complete and may be changed. We may not sell these securities until the registration statement filed with the Securities and Exchange Commission is effective. This prospectus is not an offer to sell these securities and it is not soliciting an offer to buy these securities in any jurisdiction where the offer or sale is not permitted.
Subject to completion, dated February 13, 2014
Preliminary prospectus
shares

IMS Health Holdings, Inc.
Common stock
$ per share
This is the initial public offering of our common stock. We are selling shares of our common stock. The selling stockholders identified in this prospectus are offering an additional shares. We will not receive any of the proceeds from the sale of the shares being sold by the selling stockholders. We currently expect the initial public offering price to be between $ and $ per share of common stock.
We have granted the underwriters an option to purchase up to additional shares of common stock to cover over-allotments.
After the completion of this offering, certain of our existing stockholders will continue to own a majority of the voting power of our outstanding shares of common stock. As a result, we expect to be a “controlled company” within the meaning of the corporate governance standards of the New York Stock Exchange. See “Principal and selling stockholders.”
We have applied to list our common stock on the New York Stock Exchange under the symbol “IMS.”
| Per share | Total | |||||||
| Initial public offering price |
$ | $ | ||||||
| Underwriting discounts and commissions |
$ | $ | ||||||
| Proceeds to us before expenses |
$ | $ | ||||||
| Proceeds to selling stockholders before expenses |
$ | $ | ||||||
Investing in our common stock involves risk. See “Risk factors” beginning on page 21.
Neither the Securities and Exchange Commission nor any state securities commission has approved or disapproved of these securities or passed on the adequacy or accuracy of this prospectus. Any representation to the contrary is a criminal offense.
The underwriters expect to deliver the shares of common stock to investors on or about , 2014.
| J.P. Morgan | Goldman, Sachs & Co. | Morgan Stanley | ||||
| BofA Merrill Lynch | Barclays | Deutsche Bank Securities | Wells Fargo Securities |
| TPG Capital BD, LLC | HSBC | SunTrust Robinson Humphrey | Mizuho Securities | RBC Capital Markets | ||||||
| Piper Jaffray | William Blair | Drexel Hamilton | Leerink Partners | Stifel | ||||||
Prospectus dated , 2014
Table of Contents
| Page | ||||
| 1 | ||||
| 14 | ||||
| 17 | ||||
| 21 | ||||
| 43 | ||||
| 45 | ||||
| 46 | ||||
| 48 | ||||
| 50 | ||||
| Management’s discussion and analysis of financial condition and results of operations |
53 | |||
| 81 | ||||
| 99 | ||||
| 109 | ||||
| 144 | ||||
| 147 | ||||
| 150 | ||||
| 159 | ||||
| 163 | ||||
| Material United States federal income tax considerations for Non-U.S. Holders |
165 | |||
| 170 | ||||
| 177 | ||||
| 179 | ||||
| 179 | ||||
| 179 | ||||
| F-1 | ||||
We are responsible for the information contained in this prospectus and in any free writing prospectus we prepare or authorize. Neither we nor the underwriters have authorized anyone to provide you with different information, and neither we nor the underwriters take responsibility for any other information others may give you. We are not, and the underwriters are not, making an offer to sell these securities in any jurisdiction where the offer or sale is not permitted. You should not assume that the information contained in this prospectus is accurate as of any date other than its date.
Through and including , 2014 (25 days after the commencement of this offering), all dealers that effect transactions in shares of our common stock, whether or not participating in this offering, may be required to deliver a prospectus. This delivery is in addition to a dealer’s obligation to deliver a prospectus when acting as an underwriter and with respect to their unsold allotments or subscriptions.
i
Table of Contents
Industry and market data
This prospectus includes market data and forecasts with respect to the healthcare industry. Although we are responsible for all of the disclosure contained in this prospectus, in some cases we rely on and refer to market data and certain industry forecasts that were obtained from third party surveys, market research, consultant surveys, publicly available information and industry publications and surveys that we believe to be reliable. Other industry and market data included in this prospectus are from IMS analyses and have been identified accordingly. We are a leading global information provider for the healthcare industry and we maintain databases, produce market analyses and deliver information to clients in the ordinary course of our business. Our information is widely referenced in the industry and used by governments, payers, academia, the life sciences industry, the financial community and others. Most of this information is available on a subscription basis. Other reports and information are available publicly through our IMS Institute for Healthcare Informatics (the “IMS Institute”). In some cases, the information has been developed by us for purposes of this offering based on our existing data and is believed by us to have been prepared in a reasonable manner. All such information is based upon our own market research, internal databases and published reports and has not been verified by any independent sources.
We established the IMS Institute in 2011 to leverage collaborative relationships in the public and private sectors to strengthen the role of information in advancing healthcare globally. Its objective and mission is to provide policy setters and decision makers in the global health sector with unique insights into healthcare dynamics derived from granular analysis of information. The IMS Institute publishes reports to accelerate understanding and innovation critical to sound decision-making and improved patient care. These reports are available publicly, free of charge. With access to our extensive global data sets and analytics, the IMS Institute works in tandem with a broad set of healthcare stakeholders, including government agencies, academic institutions, the life sciences industry and payers, to drive research to address today’s healthcare challenges.
Trademarks and service marks
We own or have rights to trademarks and service marks that we use in connection with the operation of our business, including IMS Health, IMS, the IMS logo, IMS One, MIDAS, Xponent, DDD, AppScript, AppNucleus, MD360 Provider Performance Management and Evidence360. All other trademarks or service marks appearing in this prospectus that are not identified as marks owned by us are the property of their respective owners.
Solely for convenience, the trademarks, service marks and trade names referred to in this prospectus are listed without the ®, (sm) and (TM) symbols, but we will assert, to the fullest extent under applicable law, our rights or the rights of the applicable licensors to these trademarks, service marks and trade names.
ii
Table of Contents
This summary highlights information contained in other parts of this prospectus. Because it is only a summary, it does not contain all of the information that you should consider before investing in shares of our common stock and it is qualified in its entirety by, and should be read in conjunction with, the more detailed information appearing elsewhere in this prospectus. Unless the context requires otherwise, references in this prospectus to the “Company,” “Issuer,” “IMS,” “we,” “us” and “our” refer to IMS Health Holdings, Inc. and its consolidated subsidiaries. “IMS Health” refers to IMS Health Incorporated, our wholly owned indirect subsidiary. You should read the entire prospectus carefully, especially “Risk factors” and our financial statements and the related notes, before deciding to buy shares of our common stock.
Our Company
We are a leading global information and technology services company providing clients in the healthcare industry with comprehensive solutions to measure and improve their performance. We have one of the largest and most comprehensive collections of healthcare information in the world, spanning sales, prescription and promotional data, medical claims, electronic medical records and social media. Our scaled and growing data set contains over 10 petabytes of unique data and over 500 million comprehensive, longitudinal, anonymous patient records (i.e., records that are linked over time for each anonymous individual across healthcare settings). Based on this data, we deliver information and insights on approximately 90% of the world’s pharmaceuticals, as measured by sales revenue. We standardize, organize, structure and integrate this data by applying our sophisticated analytics and leveraging our global technology infrastructure to help our clients run their organizations more efficiently and make better decisions to improve their operational and financial performance. We have a presence in over 100 countries, including high growth emerging markets, and we generated 63% of our $2.54 billion of 2013 revenue from outside the United States.
We serve key healthcare organizations and decision makers around the world, spanning the breadth of life science companies, including pharmaceutical, biotechnology, consumer health and medical device manufacturers, as well as distributors, providers, payers, government agencies, policymakers, researchers and the financial community. The breadth of the intelligent, actionable information we provide is not comprehensively available from any other source and would be difficult and costly for another party to replicate. Our information and technology services offerings, which we have developed with significant investment over our 60-year history, are deeply integrated into our clients’ workflow. We maintain long-standing relationships and high renewal rates with our clients due to the value of the services and solutions we provide. The average length of our relationships with our top 25 clients, as measured by 2013 revenue, is over 25 years and our retention rate for our top 1,000 clients from 2012 to 2013 was approximately 99%. We have significant visibility into our financial performance, as historically about 70% of our revenue has recurred annually, principally because our information and technology services offerings are critical to our clients’ daily decision-making and are sold primarily through subscription and service contracts.
1
Table of Contents
We leverage our proprietary information assets to develop technology and services capabilities with a talented healthcare-focused workforce that enables us to grow our relationships with healthcare stakeholders. This set of capabilities includes:
| • | A leading healthcare-specific global information technology (“IT”) infrastructure, which we use to process data from over 45 billion healthcare transactions annually and to collect data from over 780,000 fragmented feeds globally, which we organize in a consistent and highly structured fashion using proprietary methodologies; |
| • | A staff of approximately 9,500 professionals across the globe, including over 1,200 experts in areas such as biostatistics, data science, bioinformatics, healthcare economics, outcomes research, epidemiology, pharmacology and key therapeutic areas; |
| • | Our intelligent cloud, IMS One, which opens our sophisticated global IT infrastructure to our clients and provides the ability to perform business analytics in the cloud with large amounts of complex data. Our cloud is unique in the healthcare industry because it pre-integrates applications with IMS data, eliminating the cost traditionally associated with integrating information, and provides interoperability across both IMS and third party applications, reducing the complexity traditionally associated with siloed data; and |
| • | A growing set of proprietary applications, which include: commercial applications supporting sales operations, sales management, multi-channel marketing and performance management; real-world evidence solutions helping manufacturers and payers evaluate the value of treatments in terms of cost, quality and outcomes; payer-provider solutions helping these constituents optimize contracting and performance management; and clinical solutions helping manufacturers and Clinical Research Organizations (“CROs”) better design, plan, execute and track clinical trials. |
At a time when the healthcare industry is experiencing transformational change driven by global expansion and the growth of new categories of medicines, intense cost pressures, a changing regulatory environment, and new payment and delivery models, we enable our clients to gain and apply insights designed to substantially improve operating performance. Our solutions, which are designed to provide our clients access to our deep healthcare-specific subject matter expertise, take various forms, including information, tailored analytics, subscription software and expert services.
2
Table of Contents
We believe our mission-critical relationships with our life science clients are reflected in the role we play within four important areas of decision-making related to their product portfolios: Research and Development, Pre-Launch, Launch and In-Market. Over the last three years, we have introduced software and services applications that have further deepened our level of client integration by enabling our clients to enhance and automate many of these key decision-making processes.

| • Market opportunity assessment
• Clinical trial feasibility/planning
• Site selection
• Patient recruitment
• Trial monitoring
• Performance management |
• Drug pricing optimization
• Launch readiness
• Commercial planning
• Brand positioning
• Message testing
• Influence networks
• Territory design |
• Market access
• Health technology assessment
• Commercial readiness
• Forecasting
• Resource allocation
• Call planning
• Stakeholder engagement |
• Commercial operations
• Sales force effectiveness
• Sales force alignment
• Multi-channel marketing
• Client relationship management
• Lifecycle management |
We believe that a powerful component of our value proposition is the breadth and depth of intelligence we provide to help our clients address fundamental operational questions.
| User | Illustrative Questions | |||||
| Sales | Which providers generate highest return on rep visit? | Does my sales rep drive appropriate prescribing? | How much should I pay my sales rep next month? | |||
| Marketing | What share of patients is appropriately treated? | Which underserved patient populations will benefit most from my new drug? | Is my brand gaining market share quickly enough to hit revenue forecasts? | |||
| Research & Development | Are there enough patients for my clinical trial? | Which study centers have the target patients? | How long will trial enrollment take to hit target patient volumes? | |||
| Real World Evidence (“RWE”)/Pharmacovigilance | What is the likely impact of new therapies on costs and outcomes? | Are new therapies performing better against existing standards of care in real world settings? | Does real world data indicate adverse events not detected in clinical trials? | |||
We generate revenue through local sales teams that manage client relationships in each region and go to market locally with our full suite of information and technology services offerings.
3
Table of Contents
Total global revenue from our information offerings, including national and sub-national information services, represented 60% of our 2013 revenue. Total global revenue from our technology services offerings, which include hosted and cloud-based applications, implementation services, subscription software, analytic services and consulting, represented 40% of our 2013 revenue. We believe the data from our information offerings, when combined with our technology services offerings, can provide valuable insights to our clients and can increase the speed and effectiveness of decision making while also simplifying processes and reducing complexity and costs. Increasing demand from our clients for broader and more integrated offerings has been an important driver of our growth in technology services revenue, which grew at a compound annual growth rate (“CAGR”) of 13% between 2010 and 2013.
Ari Bousbib was appointed as our Chief Executive Officer on August 16, 2010 following the purchase of our Company by our Sponsors in February 2010, which we refer to as the Merger. Over the past three years, Mr. Bousbib and the management team have made substantial investments in human capital, technology and services infrastructure to expand the breadth of our platform and the number of constituents we serve within the healthcare value chain. Examples of our strategic investments and operational changes include:
| • | improving our operating efficiency by streamlining our organization, deploying lean methodologies throughout our global operations, and standardizing and automating processes; |
| • | in-sourcing development activities and capabilities, with approximately 70% of our development resources in-house as of 2013 year end, compared to approximately 30% in 2010; |
| • | increasing our offshore delivery resources to over 2,000 people as of 2013 year end, compared to 250 in 2010, which has driven substantial productivity improvement; |
| • | shifting our employee mix, with over 50% now client-facing as of 2013 year end, compared to approximately 33% in 2010; and |
| • | expanding our offerings and capabilities by investing over $900 million in 22 complementary acquisitions, internal development projects and capital expenditures since the beginning of 2011 through 2013 year end. |
These strategic investments and operational changes have transformed our organization into a more customer-centric, service oriented, high-performance culture. Since the Merger through the end of 2013, we added approximately 7,600 employees to the organization and oversaw the departure of approximately 5,200 employees from the organization, reflecting the various strategic and operational changes described above. We estimate that about 60% of our approximately 9,500 employees have joined us since the Merger through the end of 2013.
We believe our investments in people, technology and services have enabled us to significantly expand our addressable market and capture an additional portion of our clients’ spend by providing more powerful technology solutions and new insight-driven services. The following financial performance metrics have improved significantly between 2010 and 2013:
| • | revenue increased to $2.54 billion, generating a CAGR of 5.6% on an as reported basis and 5.9% on a constant dollar basis; |
4
Table of Contents
| • | Adjusted EBITDA increased to $829 million, generating a CAGR of 10.2% on an as reported basis and 10.6% on a constant dollar basis; and |
| • | Adjusted EBITDA as a percentage of revenue increased to 32.6% from 28.7%. |
We incurred a net loss of $199 million for the combined 2010 year-end period. Amounts expressed in constant dollar terms exclude the effect of changes in foreign currency exchange rates on the translation of foreign currency results into U.S. dollars. For additional information regarding these financial measures, including a reconciliation of our non-GAAP measures to the most directly comparable measure presented in accordance with United States generally accepted accounting principles (“GAAP”), see “Summary and pro forma consolidated financial data” included elsewhere in this prospectus. For additional information regarding foreign currency translation, see “Management’s discussion and analysis of financial condition and results of operations—Results excluding the effect of foreign currency translation and certain charges” included elsewhere in this prospectus.
Our market opportunity
We compete in the global information, technology and services market for the life sciences and the broader healthcare industry. Historically, we concentrated our efforts in the market for information and consulting services primarily supporting the commercial functions of life sciences organizations, which we estimate to be a $5 billion market. In response to the needs of a broader set of life sciences clients for more specialized information, such as longitudinal anonymous patient data and clinical trial analytics, we have expanded our offerings to serve the market for information and services, which we estimate to be a $22 billion market. In addition, in response to our life sciences clients’ need to streamline operations, we offer an expanded range of technology services that include data warehousing, IT outsourcing, software applications and other services in the broader market for IT services, which, together, represent an additional $28 billion market among our life sciences clients. As a result, we now operate across a life sciences marketplace for information and technology services that we estimate to be $50 billion. We also have newer offerings in the $25 billion market for information and technology services for payers and providers and view this rapidly expanding market as an opportunity for further growth.
We believe there are five key trends affecting our end markets that will create increasing demand for our information and technology services solutions:
Growth and innovation in the life sciences industry. The life sciences industry is a large and critical part of the global healthcare system, generating approximately $1 trillion in annual revenue. According to our research, revenue growth in the life sciences industry globally is expected to accelerate from 2.5% in 2013 to approximately 6% in 2017. The IMS Institute estimates that an average of 35 new molecular entities (“NMEs”) are expected to be approved each year from 2013 to 2017, up from 25 NMEs in 2010 and a return to mid-2000s levels. The reacceleration of industry growth is also the result of dramatically lower expected patent expirations on prescription medications versus the recent past.
Growth in access to healthcare in emerging markets. We believe there will be significant growth in healthcare spending in emerging markets, driven predominantly by a rapidly growing middle class in countries such as China and India. According to the IMS Institute, it is estimated that spending on pharmaceuticals in emerging markets will expand at a 10 to 13% CAGR
5
Table of Contents
through 2017. The rapid growth of emerging markets is making these geographies strategically important to life sciences organizations and we expect these organizations to apply a high degree of sophistication to their commercial operations in these countries. This requires highly localized information assets and analytics for both multinational and local market companies.
Financial pressures driving the need for increased efficiency. Despite the expected accelerating growth in the global life sciences market, we believe our clients will face operating margin pressure due to their changing product mix, pricing and reimbursement challenges, and rising costs of compliance. Based on our research, we believe large pharmaceutical companies must collectively reduce costs by approximately $35 billion from 2012 to 2017 to maintain historic operating margins. As a result, our clients are looking for new ways to simplify processes and drive operational efficiencies, including by using automation, consolidating vendors and adopting new technology options such as hosted and cloud-based applications.
Evolving need to integrate and structure expanding sources of data. Over the past decade, many health systems around the world have focused on digitizing medical records. While such records theoretically enhance access to data, relevant information is often unintegrated, unstructured, siloed in disparate software systems or entered inconsistently.
In order to derive valuable insights from existing and expanding sources of information, clients need access to statistically significant data sets organized into databases that can be queried and analyzed. For example, longitudinal studies require analysis of anonymous patient diagnoses, treatments, procedures and laboratory test results to identify types of patients that will likely best respond to particular therapies. We believe the opportunity to more broadly apply healthcare data can only be realized through structuring, organizing and integrating new and existing forms of data in conjunction with sophisticated analytics.
Need for demonstrated value in healthcare. Participants in the healthcare industry are focused on improving quality and reducing costs, both of which require assessment of quality and value of therapies and providers. As a result, there is increasing pressure on life sciences companies to support and justify the value of their therapies. Many new drugs that are being approved are more expensive than existing therapies, and will likely receive heightened scrutiny by payers to determine whether the existing treatment options would be sufficient. Additionally, many new specialty drugs are molecular-based therapies and require a more detailed understanding of clinical factors and influencers that demonstrate therapeutic value. As a result, leading life sciences companies are utilizing more sophisticated analytics for insight driven decisions.
We believe we are well positioned to take advantage of these global trends in healthcare. Beyond our proprietary information assets, we have developed key capabilities to assess opportunities to develop and commercialize therapies, support and defend the value of medicines and help our clients operate more efficiently through the application of insight-driven decision-making and cost-efficient technology solutions.
Our strengths
Comprehensive information assets and collection network. The scale of our information assets, breadth and depth of our data supplier network, and our global reach are distinct advantages as clients value quality, consistency and continuity across geographies to accurately measure trends
6
Table of Contents
and their performance. With over 10 petabytes of proprietary data sourced from over 100,000 data suppliers covering over 780,000 data feeds globally, we have one of the largest and most comprehensive collections of healthcare information in the world, which includes over 500 million comprehensive, longitudinal anonymous patient records. Based on this data, we deliver information and insights on approximately 90% of the world’s pharmaceuticals, as measured by sales revenue. We have proprietary healthcare data management and projection methodologies developed over a long history, which enable us to extrapolate more precise insights from large-scale databases to provide greater granularity and segmentation for our clients. We continue to invest in new technology to source data that is valued by our clients, including social media analytics and mobile health solutions, to continuously add records to our data sets, and refine our information and analytic methods. Use of our proprietary encryption technologies allows anonymous information to be linked across different care settings and across data sets, resulting in more complete healthcare information about anonymous patients and a deeper understanding of real world treatment, cost and outcomes.
Scaled healthcare specific technology infrastructure. To manage our proprietary, global information base, we have built what we believe is one of the largest and most sophisticated information technology infrastructures in healthcare. By processing data from over 45 billion healthcare transactions annually, our infrastructure connects complex healthcare data while applying a wide range of privacy, security, operational, legal and contractual protections for data in response to local law, supplier requirements and industry leading practices. We have four Centers of Excellence and five operation hubs around the world, and approximately 9,500 associates, including over 1,200 experts in areas such as biostatistics, data science, bioinformatics, healthcare economics, outcomes research, epidemiology, pharmacology and key therapeutic areas. We believe the scale, global footprint and connectivity our infrastructure provides is unique within the healthcare vertical and will be of increasing value to our clients in a period where cost pressures will grow.
Highly differentiated technology services fully integrated with IMS information. Our ability to integrate technology services with our data creates mission-critical, actionable intelligence that improves our overall value proposition to our clients. Our expanding set of sophisticated human capital resources and technology services offerings combined with our deep understanding of our scaled information assets provides what we believe to be a competitive advantage in an environment where clients require better performance. For example, in 2012, we introduced our healthcare-specific intelligent cloud, IMS One, which helps our clients fully recognize the benefits of our infrastructure. Our cloud is unique in the healthcare industry because it pre-integrates applications with IMS data and provides interoperability across both IMS and third party applications. We envision that over time IMS One will become an industry standard around which applications are hosted and information shared on an interoperable basis.
Long standing client relationships that are expanding. The breadth of the intelligent, actionable information we provide is not comprehensively available from any other source and would be difficult and costly for another party to replicate. We believe our information and technology services are deeply integrated into our clients’ workflow. We maintain long-standing relationships and high renewal rates with clients due to the value of the services and solutions we provide, as well as support the need for globally consistent information to enable comprehensive trend analysis at the local, regional, national and multi-country levels. The
7
Table of Contents
average length of our relationships with our top 25 clients, as measured by 2013 revenue, is over 25 years and our retention rate for our top 1,000 clients from 2012 to 2013 was approximately 99%. Serving over 5,000 clients creates significant opportunity to expand the breadth of services we provide to our clients.
Unique and scalable operating model. We believe we have an attractive operating model due to the scalability of our solutions, the recurring nature of our revenue and the low capital intensity/high free cash flow conversion of our business. Given our global infrastructure and the fixed-cost nature of our data, we are able to scale our healthcare information, technology and service solutions rapidly and efficiently to generate high margins on incremental revenue. Our flexible technology platform has been built to accommodate highly complex analytics and significant data volumes. We believe our recurring revenue provides significant visibility to our financial performance, and when combined with our leading offerings, will contribute to our long-term growth, strong operating margins and flexibility in allocating capital.
Our growth strategy
We believe we are well positioned for continued growth across the markets we serve. Our strategy for achieving growth includes:
Build upon our extensive client relationships. We have a diversified base of over 5,000 clients in over 100 countries, and have expanded our client value proposition since the Merger to now address a broader market for information and technology services which we estimate to be $50 billion. We are in the early stages of penetrating this expanding market within our global life sciences client base. Key elements of this strategy include:
| • | further integrating our existing services to provide clients with interoperable solutions; |
| • | increasing the number of clients that leverage our technology services offerings, including IMS One; |
| • | using our global presence and efficient operating model to scale new applications and solutions rapidly and efficiently across clients, markets and geographies; and |
| • | expanding the number of clients that choose to drive efficiencies by consolidating their vendor needs with us. |
Capitalize on our presence in emerging markets. We believe China, India, Brazil and Russia, together with many of the 50-plus other emerging markets in which we operate, will accelerate their healthcare spending over the next five years. We have an established presence in these markets, generating $440 million of revenue for 2013 (approximately 17% of our revenue) and growing at an 11% constant dollar CAGR since 2010. We serve both multinational companies and local clients. Key elements of this strategy include:
| • | partnering with existing life sciences clients as they expand their businesses into emerging markets; |
| • | continuing to grow our existing services in emerging markets while simultaneously introducing new services drawn from our global portfolio; and |
| • | building relationships with local companies that are expanding beyond their home markets by capitalizing on the global credibility and consistency of our platform. |
8
Table of Contents
Continue to innovate. We believe a significant opportunity exists to continue to enhance our information and analytics offerings and expand our technology services offerings to capitalize on the evolving healthcare environment. Our recent investments in human capital, technology and services capabilities position us to continue to pursue rapid innovation within the life sciences sector and the broader healthcare marketplace. Examples of recent innovations include:
| • | development of applications in the mobile health space including AppScript, an enterprise solution for providers and payers to establish a curated formulary of mobile applications that can be prescribed securely and reconciled by prescribers just like drug prescriptions, and AppNucleus, which allows developers to build mobile applications with secure containers for patient information on devices and secure communication channels to physicians and other applications; and |
| • | development of Evidence360, a collection of specialized technologies for RWE, including tailor-made data warehouses integrating our data sets with patient registries and a cohort builder tool facilitating efficient definitions and tracking of narrow cohorts to determine outcomes in small patient populations. |
Expand portfolio through strategic acquisitions. We have and expect to continue to acquire assets and businesses that strengthen our value proposition to clients. We have developed an internal capability to source, evaluate and integrate acquisitions that have created value for stockholders. Since the beginning of 2011, we have invested approximately $586 million of capital in 22 acquisitions. As the global healthcare landscape evolves, we expect that there will be a growing number of acquisition opportunities across the life sciences, payer and provider sectors.
Expand the penetration of our offerings to the broader healthcare marketplace. We believe that substantial opportunities exist to expand penetration of our addressable market and further integrate our offerings in a broader cross-section of the healthcare marketplace. Key elements of this strategy include:
| • | continuing to sell innovative solutions to life sciences clients in areas we have recently entered, such as clinical trial analytics; |
| • | leveraging our comprehensive collection of healthcare information to provide critical insights to payers and providers, enabling advanced patient analytics and population health management; and |
| • | utilizing our proprietary information and analytics to address the evolving needs of the broader healthcare marketplace. |
Our offerings
We offer hundreds of distinct services, applications and solutions to help our clients make critical decisions and perform better. While historically our offerings focused mainly in information and analytics, we now routinely integrate information with technology services to ensure our clients receive the most value from our information to enable them to incorporate insights into their workflow. These offerings complement each other and can provide enhanced value to our clients when delivered together in an integrated fashion, with each driving demand for the other.
9
Table of Contents
Our principal offerings include:
| • | National information offerings. Our national offerings comprise unique services in more than 70 countries that provide consistent country level performance metrics related to sales of pharmaceutical products, prescribing trends, medical treatment and promotional activity across multiple channels including retail, hospital and mail order. |
| • | Sub-national information offerings. Our sub-national offerings comprise unique services in more than 50 countries that provide a consistent measurement of sales or prescribing activity at the regional, zip code and individual prescriber level (depending on regulation in country). |
| • | Commercial services. We provide a broad set of strategic, workflow analytics and support services to help the commercial operations of life sciences companies successfully transform their commercial models, engage more effectively with the marketplace and reduce their operating costs. |
| • | Real-World Evidence (RWE) solutions. We integrate information from medical claims, prescriptions, electronic medical records, biomarkers and government statistics into anonymous, longitudinal patient journeys that provide detailed views of treatment patterns, disease progression, therapeutic switching and concomitant diseases and treatments. |
| • | Commercial technology solutions. We provide an extensive range of hosted and cloud-based applications and associated implementation services. The applications, hosted on IMS One, support a wide range of commercial processes including multi-channel marketing, customer relationship management (“CRM”), performance management, incentive compensation, territory alignment, roster management and call planning. |
| • | Clinical solutions. By bringing together our information with advanced predictive modeling technology, we help life sciences companies and CROs better design and execute clinical trials; and for payers and providers, we enable risk-sharing, pay-for-performance and population health management. |
Risk related to our business
An investment in our common stock involves a high degree of risk. Among these important risks are the following:
| • | our data suppliers might restrict our use of or refuse to license data, which could lead to our inability to provide certain products or services; |
| • | failure to meet productivity objectives under our internal business transformation initiatives could adversely impact our competitiveness and our ability to meet our growth objectives; |
| • | we may be unsuccessful at investing in growth opportunities; |
| • | data protection and privacy laws may restrict our current and future activities; |
| • | breaches or misuse of our or our outsourcing partners’ security or communication systems could expose us, our clients, our data suppliers or others to risk of loss; |
| • | hardware and software failures, delays in the operation of our computer and communications systems or the failure to implement system enhancements may adversely impact us; |
10
Table of Contents
| • | consolidation in the industries in which our clients operate may reduce the volume of products and services purchased by consolidated clients following an acquisition or merger; and |
| • | our ability to protect our intellectual property rights and our susceptibility to claims by others that we are infringing their intellectual property rights. |
For additional information about the risks we face, please see the section of this prospectus captioned “Risk factors.”
Our Sponsors
On February 26, 2010, IMS was acquired by affiliates of TPG Global, LLC (together with its affiliates, “TPG”), CPP Investment Board Private Holdings, Inc. (“CPPIB-PHI”), a wholly owned subsidiary of the Canada Pension Plan Investment Board (together with its affiliates, “CPPIB”) and Leonard Green & Partners, L.P. (“LGP” and collectively with TPG and CPPIB, the “Sponsors”) in an all-cash transaction. The acquisition was accomplished through the merger (the “Merger”) of the parent of IMS Health with and into Healthcare Technology Acquisition, Inc., an indirect wholly owned subsidiary of IMS Health Holdings, Inc., the Issuer, which is owned by investment entities controlled by the Sponsors and management.
TPG. TPG is a leading global private investment firm founded in 1992 with $55.7 billion of assets under management as of September 30, 2013 and offices in San Francisco, Fort Worth, Austin, Beijing, Chongqing, Hong Kong, London, Luxembourg, Melbourne, Moscow, Mumbai, New York, Paris, São Paulo, Shanghai, Singapore and Tokyo. TPG has extensive experience with global public and private investments executed through leveraged buyouts, recapitalizations, spinouts, growth investments, joint ventures and restructurings. The firm’s investments span a variety of industries, including healthcare, financial services, travel and entertainment, technology, energy, industrials, retail, consumer, real estate and media and communications.
CPPIB. CPPIB is one of the largest and fastest growing institutional investors in the world. It invests the funds not needed by the Canada Pension Plan to pay current benefits on behalf of 18 million Canadian contributors and beneficiaries. Headquartered in Toronto, with offices in London and Hong Kong, CPPIB is governed and managed independently of the Canada Pension Plan and at arm’s length from governments. At September 30, 2013, the Fund’s assets totaled C$193 billion, of which approximately C$48 billion is invested through the Private Investments group. A team of 135 dedicated Private Investment professionals manages investment activities in Direct Private Equity, Private Debt, Infrastructure, and Funds, Secondaries & Co-Investments. Direct Private Equity manages an approximately C$10 billion portfolio of investments and focuses on majority or shared control investments, typically alongside an existing fund partner, across multiple industry sectors worldwide. Current and previous healthcare and technology investments include Kinetic Concepts, Alliance Boots, Diaverum, LHP Hospital Group, United Surgical Partners, Skype, NEWAsurion and Aricent, among others.
LGP. LGP is a leading private equity firm with over $15 billion of private equity capital raised since inception. Founded in 1989, LGP has invested in 70 companies with aggregate value of $74 billion. Located in Los Angeles, California, LGP invests in established companies that are leaders in their markets. Significant investments include The Container Store, J. Crew Group, CHG Healthcare, CCC Information Services and Topshop/Topman.
11
Table of Contents
Following the completion of this offering, the Sponsors will own approximately % of our common stock, or % if the underwriters’ option to purchase additional shares of our common stock is fully exercised. As a result, we expect to be a “controlled company” within the meaning of the corporate governance standards of the New York Stock Exchange (the “NYSE”) on which we have applied for our shares to be listed. See “Risk factors—Risks relating to our common stock and this offering.”
12
Table of Contents
Corporate information and structure
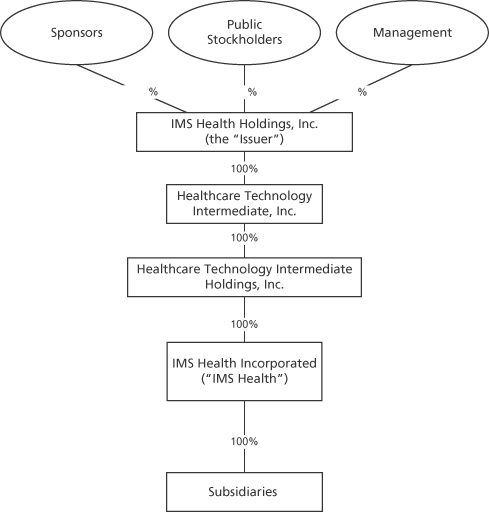
IMS Health Holdings, Inc. is a Delaware corporation that was formed in 2009 under the name Healthcare Technology Holdings, Inc. On December 20, 2013, the Company changed its name to IMS Health Holdings, Inc. Its only material assets are the shares of the equity of Healthcare Technology Intermediate, Inc., which is the holder of 100% of the equity of Healthcare Technology Intermediate Holdings, Inc., which is the holder of 100% of the shares of the equity of IMS Health Incorporated, which we refer to in this prospectus as IMS Health. IMS Health Holdings, Inc. does not conduct any operations other than with respect to its direct and indirect ownership of its subsidiaries and conducts all of its business through IMS Health and its subsidiaries. Our principal executive offices are located at 83 Wooster Heights Road, Danbury, Connecticut 06810. Our telephone number at that address is (203) 448-4600. Our website address is www.imshealth.com. Our website and the information contained on our website do not constitute a part of this prospectus.
The following chart shows our simplified organizational structure immediately following the consummation of this offering:
13
Table of Contents
| Common stock offered by us |
shares |
| Common stock offered by the selling stockholders |
shares |
| Common stock to be outstanding after this offering |
shares (or shares if the underwriters exercise their overallotment option in full) |
| Option to purchase additional shares |
The underwriters have an option for a period of 30 days to purchase up to additional shares of our common stock to cover overallotments. |
| Use of proceeds |
We estimate that the net proceeds from this offering will be approximately $ million, or approximately $ million if the underwriters exercise their option to purchase additional shares in full, at an assumed initial public offering price of $ per share, the midpoint of the price range set forth on the cover of this prospectus, after deducting the estimated underwriting discounts and commissions and estimated offering expenses payable by us. We intend to refinance a portion of our existing long-term debt in connection with the closing of this offering (the “Refinancing”), comprised of (i) the entry into an amendment and restatement of our Senior Secured Credit Facilities to provide for, among other things, additional term loans (the “New Term Loans”) of $ and € and to increase our existing revolving credit facility to $ and (ii) the redemption of (x) all amounts outstanding under our $750.0 million 7.374%/8.125% Senior Payment-in-Kind Toggle Notes due 2018 (the “Senior PIK Notes”) and (y) all amounts outstanding under our $999.6 million 12.5% unsecured Senior Exchange Notes due 2018 (the “New 12.5% Senior Notes”) and the $0.4 million of 12.5% Senior Notes due 2018 (the “Old 12.5% Senior Notes,” and, together with the New 12.5% Senior Notes, the “12.5% Senior Notes”), in each case including related fees and expenses. We intend to use the net proceeds of this offering, along with borrowings under our New Term Loans and cash on our balance sheet, to (i) fund the redemption of all of our Senior PIK Notes and 12.5% Notes, (ii) pay an estimated amount of $ million in the aggregate to holders of outstanding cash-settled stock appreciation rights granted under our 2010 Equity Incentive Plan (“Phantom SARs”), and (iii) pay a one-time fee to terminate our management services agreement with the Sponsors of $ million. We intend to use the remainder of the net proceeds, if any, for |
14
Table of Contents
| general corporate purposes. We will not receive any of the proceeds from the sale of shares by the selling stockholders. See “Use of proceeds.” |
| Dividend policy |
Our board of directors does not currently intend to pay dividends on our common stock. However, we expect to reevaluate our dividend policy on a regular basis following the offering and may, subject to compliance with the covenants contained in our credit facilities and other considerations, determine to pay dividends in the future. The declaration, amount and payment of any future dividends on shares of our common stock will be at the sole discretion of our board of directors, which may take into account general and economic conditions, our financial condition and results of operations, our available cash and current and anticipated cash needs, capital requirements, contractual, legal, tax and regulatory restrictions, the implications of the payment of dividends by us to our stockholders or by our subsidiaries to us, and any other factors that our board of directors may deem relevant. See “Management’s discussion and analysis of financial condition and results of operations—Liquidity and capital resources,” “Description of indebtedness” and Note 11 to our audited consolidated financial statements included elsewhere in this prospectus for restrictions on our ability to pay dividends. |
| Risk factors |
You should read the “Risk factors” section of this prospectus for a discussion of factors to consider carefully before deciding to invest in shares of our common stock. |
| Proposed NYSE symbol |
“IMS” |
| Conflicts of interest |
Because certain affiliates of Goldman, Sachs & Co., an underwriter of this offering, hold a portion of our 12.5% Senior Notes and are therefore expected to receive more than 5% of the net proceeds of this offering and because affiliates of TPG Capital BD, LLC, an underwriter of this offering, own in excess of 10% of our issued and outstanding common stock, a “conflict of interest” under Rule 5121 of the Financial Industry Regulatory Authority, Inc. (“FINRA”) is deemed to exist. As required by FINRA Rule 5121, J.P. Morgan Securities LLC has agreed to act as “qualified independent underwriter” for this offering and has participated in the preparation of, and has exercised the usual standards of “due diligence” in respect of this prospectus. See “Use of proceeds” and “Underwriting—Conflicts of interest.” |
The number of shares of common stock to be outstanding after this offering is based on shares of common stock outstanding as of , 2014 and excludes the following:
| • | shares of common stock issuable upon exercise of stock options outstanding as of , 2014 at a weighted average exercise price of $ per share; and |
| • | shares of common stock reserved for future issuance under our equity incentive plans as of , 2014. |
15
Table of Contents
Unless otherwise indicated, this prospectus reflects and assumes the following:
| • | the adoption of our amended and restated certificate of incorporation and our amended and restated bylaws, to be effective upon the closing of this offering; and |
| • | no exercise by the underwriters of their option to purchase up to additional shares of our common stock in this offering. |
16
Table of Contents
Summary and pro forma consolidated financial data
The following table sets forth summary historical and pro forma consolidated financial data for the years presented and at the dates indicated below. We have derived the balance sheet data as of December 31, 2013 and December 31, 2012 and the statement of comprehensive income (loss) and cash flow data for each of the three years in the period ended December 31, 2013 from our audited consolidated financial statements included elsewhere in this prospectus.
Historical results are not necessarily indicative of the results to be expected for future periods. The following information should be read in conjunction with the section entitled “Management’s discussion and analysis of financial condition and results of operations” and our consolidated financial statements and the notes thereto contained elsewhere in this prospectus.
| Years ended December 31, |
||||||||||||
| (dollars in millions) | 2013 | 2012 | 2011 | |||||||||
| Financial Data: |
||||||||||||
| Revenue |
$ | 2,544 | $ | 2,443 | $ | 2,364 | ||||||
| Information |
1,525 | 1,521 | 1,532 | |||||||||
| Technology Services |
1,019 | 922 | 832 | |||||||||
| Operating costs of information |
648 | 675 | 698 | |||||||||
| Direct and incremental costs of technology services |
520 | 476 | 396 | |||||||||
| Selling and administrative expenses |
596 | 579 | 604 | |||||||||
| Depreciation and amortization(1) |
410 | 424 | 393 | |||||||||
| Severance, impairment and other charges |
16 | 48 | 31 | |||||||||
| Merger costs |
— | 2 | 23 | |||||||||
|
|
|
|||||||||||
| Operating income |
354 | 239 | 219 | |||||||||
|
|
|
|||||||||||
| Interest income |
4 | 4 | 3 | |||||||||
| Interest expense |
(332 | ) | (275 | ) | (277 | ) | ||||||
| Other loss, net |
(74 | ) | (29 | ) | (7 | ) | ||||||
|
|
|
|||||||||||
| Non-operating loss, net |
(402 | ) | (300 | ) | (281 | ) | ||||||
|
|
|
|||||||||||
| Loss before benefit from income taxes |
(48 | ) | (61 | ) | (62 | ) | ||||||
| Benefit from income taxes |
130 | 19 | 173 | |||||||||
|
|
|
|||||||||||
| Net income (loss) |
$ | 82 | $ | (42 | ) | $ | 111 | |||||
17
Table of Contents
| Years ended December 31, |
||||||||||||
| (dollars in millions) | 2013 | 2012 | 2011 | |||||||||
| Earnings (loss) per common share attributable to common stockholders: |
||||||||||||
| Basic earnings (loss) per share |
$ | 0.03 | $ | (0.02 | ) | $ | 0.04 | |||||
| Diluted earnings (loss) per share |
0.03 | (0.02 | ) | 0.04 | ||||||||
| Weighted average common shares outstanding: |
||||||||||||
| Basic |
2,800 | 2,795 | 2,788 | |||||||||
| Diluted |
2,870 | 2,795 | 2,793 | |||||||||
| Unaudited pro forma data(2): |
||||||||||||
| Basic income per common share |
||||||||||||
| Diluted income per common share |
||||||||||||
| Weighted average common shares outstanding: |
||||||||||||
| Basic |
||||||||||||
| Diluted |
||||||||||||
| Balance sheet data (at end of period): |
||||||||||||
| Cash and cash equivalents |
$ | 725 | $ | 580 | ||||||||
| Short-term investments |
4 | 61 | ||||||||||
| Accounts receivables, net of allowances |
313 | 308 | ||||||||||
| Total current assets |
1,327 | 1,237 | ||||||||||
| Total assets |
7,999 | 8,215 | ||||||||||
| Total current liabilities |
932 | 843 | ||||||||||
| Total debt |
4,960 | 4,177 | ||||||||||
| Total liabilities |
7,116 | 6,532 | ||||||||||
| Total shareholders’ equity |
883 | 1,683 | ||||||||||
| Statement of cash flow data: |
||||||||||||
| Net cash provided by (used in) |
||||||||||||
| Operating Activities |
$ | 400 | $ | 399 | $ | 334 | ||||||
|
|
|
|||||||||||
| Investing Activities |
(180 | ) | (209 | ) | (485 | ) | ||||||
|
|
|
|||||||||||
| Financing Activities |
(52 | ) | (63 | ) | 106 | |||||||
|
|
|
|||||||||||
| Other financial data: |
||||||||||||
| Capital expenditures |
$ | 41 | $ | 44 | $ | 30 | ||||||
| Additions to computer software |
81 | 64 | 74 | |||||||||
| Adjusted EBITDA(3) |
829 | 764 | 721 | |||||||||
| (1) | Includes charges related to acquired intangible assets. |
| (2) | Pro forma earnings per share |
| We declared and paid dividends to our stockholders of $753 million during 2013. Dividends declared in the year preceding an initial public offering are deemed to be in contemplation of the offering with the intention of repayment out of offering proceeds to the extent that the dividends exceeded earnings during such period. Unaudited pro forma earnings per share for 2013 gives effect to the sale of the number of shares the proceeds of which would be necessary to (i) pay the dividend amount that is in excess of 2013 earnings, (ii) fund the repayment of the debt and related fees and expenses described in “Use of proceeds” and (iii) pay holders of Phantom SARs as described in “Use of proceeds,” up to the number of shares assumed to be issued in this offering. |
| Additionally, unaudited pro forma earnings per share for 2013 gives effect to the reversal of interest expense relating to such debt, including the reversal of amortization related to debt issuance costs and discount. |
| For purposes of calculating unaudited pro forma earnings per share for 2013 we assumed shares are sold in this offering at a price of $ per share, the midpoint of the price range set forth on the cover page of this prospectus. |
18
Table of Contents
The following presents the computation of pro forma basic and diluted earnings per share:
| Year ended December 31, 2013 |
||||
|
|
||||
| Numerator: |
||||
| Net income as reported |
$ | |||
| Pro forma adjustments: |
||||
| Interest expense, net of tax(a) |
||||
|
|
|
|||
| Pro forma net income |
$ | |||
|
|
|
|||
| Denominator: |
||||
| Weighted average common shares used in computing basic income per common share outstanding |
||||
| Adjustment for common stock issued whose proceeds will be used to pay dividends in excess of earnings(b) |
||||
| Adjustment for common shares used to repay outstanding indebtedness(c) |
||||
| Adjustment for common stock to pay holders of Phantom SARs(d) |
||||
| Pro forma weighted average common shares used in computing basic income per common share outstanding |
||||
|
|
|
|||
| Pro forma basic earnings per share |
$ | |||
|
|
|
|||
| Weighted average common shares used in computing diluted income per common share outstanding |
||||
| Diluted effect of securities |
||||
| Pro forma weighted average common shares used in computing diluted income per common share outstanding |
||||
|
|
|
|||
| Pro forma diluted earnings per share |
$ | |||
|
|
|
|||
|
|
||||
| (a) These adjustments reflect the elimination of the historical interest expense and amortization of debt issuance costs and discount after reflecting the pro forma effect of the Refinancing. |
||||
| (b) Dividends declared in the past twelve months |
$ | |||
| Net income attributable to IMS Health Holdings, Inc. in the past 12 months |
||||
|
|
|
|||
| Dividends paid in excess of earnings |
$ | |||
|
|
|
|||
| Offering price per common share |
$ | |||
|
|
|
|||
| Common shares assumed issued in this offering necessary to pay dividends in excess of earnings |
||||
| (c) Indebtedness to be repaid with proceeds from this offering |
$ | |||
|
|
|
|||
| Offering price per common share |
$ | |||
|
|
|
|||
| Common shares assumed issued in this offering to repay indebtedness |
||||
| (d) Number of Phantom SARs |
||||
| Excess of fair market value over exercise price |
||||
| Common shares assumed issued in this offering necessary to pay holders of Phantom SARs |
||||
|
| ||
| (3) | Adjusted EBITDA is a financial measure that is not defined under U.S. GAAP and is presented in this prospectus because our management considers it an important supplemental measure of our performance and our ability to service our debt and believes that it provides greater transparency into our results of operation and is frequently used by investors in the evaluation of companies in the industry. In addition, our management believes that Adjusted EBITDA is a useful financial metric to assess our operating performance from period to period by excluding certain material non-cash items, unusual or non-recurring items that we do not expect to continue in the future and certain other adjustments we believe are not reflective of our ongoing operations and our performance. Adjusted EBITDA is not a measure of net income, operating income or any other performance measure derived in accordance with U.S. GAAP, and is subject to important limitations. |
| Adjusted EBITDA, as we use it, is net income before interest, income taxes, depreciation, amortization, non-cash compensation expenses, expenses related to the early extinguishment of debt, transaction fees and the other items described below. |
| We understand that although Adjusted EBITDA is frequently used by securities analysts, investors and others in their evaluation of companies, it has limitations as an analytical tool, and you should not consider it in isolation, or as a substitute for analysis of our results as reported under U.S. GAAP. Some of these limitations are: |
| • | it does not reflect every cash expenditure, future requirements for capital expenditures or contractual commitments; |
| • | it does not reflect the significant interest expense or the cash requirements necessary to service interest or principal payments on our debt; |
19
Table of Contents
| • | although depreciation and amortization are non-cash charges, the assets being depreciated and amortized will often have to be replaced or require improvements in the future, and Adjusted EBITDA does not reflect any cash requirements for such replacements or improvements; |
| • | it is not adjusted for all non-cash income or expense items that are reflected in our statements of cash flows; |
| • | it does not reflect the impact of earnings or charges resulting from matters we consider not to be indicative of our ongoing operations; |
| • | it does not reflect limitations on our costs related to transferring earnings from our subsidiaries to us; and |
| • | other companies in our industry may calculate this measure differently than we do, limiting its usefulness as a comparative measure. |
| Because of these limitations, Adjusted EBITDA should not be considered as a measure of discretionary cash available to us to invest in the growth of our business or as measures of cash that will be available to us to meet our obligations. We compensate for these limitations by using Adjusted EBITDA along with other comparative tools, together with U.S. GAAP measurements, to assist in the evaluation of operating performance. These U.S. GAAP measurements include operating income (loss), net income (loss), cash flows from operations and cash flow data. We have significant uses of cash flows, including capital expenditures, interest payments, debt principal repayments, taxes and other non-recurring charges, which are not reflected in Adjusted EBITDA. Adjusted EBITDA is not intended as alternatives to net income (loss) as indicators of our operating performance, as alternatives to any other measure of performance in conformity with U.S. GAAP or as alternatives to cash flow provided by operating activities as measures of liquidity. You should therefore not place undue reliance on Adjusted EBITDA or ratios calculated using those measures. Our U.S. GAAP-based measures can be found in our consolidated financial statements and related notes included elsewhere in this prospectus. |
| Years
ended December 31, |
||||||||||||
| (dollars in millions) | 2013 | 2012 | 2011 | |||||||||
|
|
||||||||||||
| Net income (loss) |
$ | 82 | $ | (42 | ) | $ | 111 | |||||
| Deferred revenue purchase accounting adjustments |
2 | 7 | 7 | |||||||||
| Non-cash stock-based compensation charges |
22 | 19 | 18 | |||||||||
| Restructuring and related charges(a) |
23 | 54 | 39 | |||||||||
| Acquisition-related charges |
10 | 11 | 13 | |||||||||
| Sponsor monitoring fee |
8 | 8 | 9 | |||||||||
| Depreciation and amortization |
410 | 424 | 393 | |||||||||
| Merger costs |
— | 2 | 23 | |||||||||
| Interest income |
(4 | ) | (4 | ) | (3 | ) | ||||||
| Interest expense |
332 | 275 | 277 | |||||||||
| Other loss, net |
74 | 29 | 7 | |||||||||
| Benefit from income taxes |
(130 | ) | (19 | ) | (173 | ) | ||||||
|
|
|
|||||||||||
| Adjusted EBITDA |
$ | 829 | $ | 764 | $ | 721 | ||||||
|
|
||||||||||||
| (a) | Restructuring and related charges includes severance and impairment charges and the cost of employee and third-party charges related to dual running costs for knowledge transfer activities. |
20
Table of Contents
This offering and investing in our common stock involves a high degree of risk. You should carefully consider the risks and uncertainties described below together with all of the other information contained in this prospectus, including our consolidated financial statements and the related notes appearing at the end of this prospectus, before deciding to invest in our common stock. If any of the following risks actually occurs, our business, prospects, operating results and financial condition could suffer materially, the trading price of our common stock could decline and you could lose all or part of your investment. The risks and uncertainties described below are not the only ones we face.
Risks related to our business
We rely on third parties to provide certain data. Our data suppliers might restrict our use of or refuse to license data, which could lead to our inability to provide certain services and, as a result, materially and adversely affect our operating results and financial condition.
Each of our information services is derived from data we collect from third parties. These data suppliers are numerous and diverse, reflecting the broad scope of information that we collect and use in our business.
Although we typically enter into long-term contractual arrangements with many of these suppliers of data, at the time of entry into a new contract or renewal of an existing contract, suppliers may increase restrictions on our use of such data, increase the price they charge us for data or refuse altogether to license the data to us. In addition, during the term of any data supply contract, suppliers may fail to adhere to our data quality control standards or fail to deliver data. Further, although no single individual data supplier is material to our business, if a number of suppliers collectively representing a significant amount of data that we use for one or more of our services were to impose additional contractual restrictions on our use of or access to data, fail to adhere to our quality-control standards, repeatedly fail to deliver data or refuse to provide data, now or in the future, our ability to provide those services to our clients could be materially adversely impacted, which may harm our operating results and financial condition.
Failure to meet productivity objectives under our internal business transformation initiatives could adversely impact our competitiveness and harm our operating results.
We are pursuing business transformation initiatives to update technology, increase innovation and obtain operating efficiencies. As part of these initiatives, we seek to improve our productivity, flexibility, quality, functionality and cost savings by investing in the development and implementation of global platforms and integration of our business processes and functions to achieve economies of scale. For example, we hired and trained more than 500 people to form a COE in Manila, The Philippines for standardizing and cleaning data received from data suppliers, developed updated tools for standardizing and cleaning data, are moving local standardizing and cleaning from countries around the world to the Manila COE, and retired local standardizing and cleaning systems. These various initiatives may not yield their intended gains, which may impact our competitiveness and our ability to meet our growth objectives and, as a result, materially and adversely affect our business, results of operation and financial condition.
21
Table of Contents
If we are unsuccessful at investing in growth opportunities, our business could be materially and adversely affected.
We continue to invest significantly in growth opportunities, including the development and acquisition of new data, technologies and services to meet our clients’ needs. For example, we are expanding our services and technology offerings, such as the development of a cloud-based platform with a growing number of applications to support commercial operations for life sciences companies (e.g., multi-channel marketing, marketing campaign management, CRM, incentive compensation management, targeting and segmentation, performance management and other applications). We also continue to invest significantly in growth opportunities in emerging markets, such as the development, launch and enhancement of services in China, India, Russia, Turkey and other countries. We believe healthcare spending in these emerging markets will continue to grow over the next five years, and we consider our presence in these markets to be an important focus of our growth strategy.
There is no assurance that our investment plans or growth strategy will be successful or will produce a sufficient or any return on our investments. Further, if we are unable to develop new technologies and services, clients do not purchase our new technologies and services, our new technologies and services do not work as intended or there are delays in the availability or adoption of our new technologies and services, then we may not be able to grow our business or growth may occur slower than anticipated. Additionally, although we expect continued growth in healthcare spending in emerging markets, such spending may occur more slowly or not at all, and we may not benefit from our investments in these markets.
We plan to fund growth opportunities with cash from operations or from future financings, and not with the proceeds from this offering, which will primarily be used to repay existing indebtedness. See “Use of proceeds.” There can be no assurance that those sources will be available in sufficient amounts to fund future growth opportunities when needed.
Any of the foregoing could have a material and adverse effect on our operating results and financial condition.
Data protection, privacy and similar laws restrict access, use and disclosure of information, and failure to comply with or adapt to changes in these laws could materially and adversely harm our business.
Patient health information is among the most sensitive of personal information and it is critical that information about an individual’s healthcare is properly protected from inappropriate access, use and disclosure. Laws restricting access, use and disclosure of such information include the Health Insurance Portability and Accountability Act of 1996 (“HIPAA”), the European Union’s Data Protection Directive, Canada’s Personal Information Protection and Electronic Documents Act and other data protection, privacy and similar national, state/provincial and local laws. We have established frameworks, models, processes and technologies to manage privacy for many data types, from a variety of sources, and under myriad privacy and data protection laws worldwide. In addition, we rely on our data suppliers to deliver information to us in a form and in a manner that complies with applicable privacy and data protection laws. These laws are complex and there is no assurance that the safeguards and controls employed by us or our data suppliers will be sufficient to prevent a breach of these laws. Failure to comply with such laws may result in, among other things, civil and criminal liability, negative publicity, damage to our reputation, data being blocked from use and liability under contractual provisions.
22
Table of Contents
Laws and expectations relating to privacy continue to evolve, and we continue to adapt to changing needs. Nevertheless, changes in these laws (including newly released interpretations of these laws by courts and regulatory bodies) may limit our data access, use and disclosure, and may require increased expenditures by us or may dictate that we not offer certain types of services. Any of the foregoing may have a material adverse impact on our ability to provide services to our clients or maintain our profitability.
There is ongoing concern from privacy advocates, regulators and others regarding data protection and privacy issues, and the number of jurisdictions with data protection and privacy laws has been increasing. Also, there are ongoing public policy discussions regarding whether the standards for de-identified, anonymous or pseudonomized health information are sufficient, and the risk of re-identification sufficiently small, to adequately protect patient privacy. These discussions may lead to further restrictions on the use of such information. There can be no assurance that these initiatives or future initiatives will not adversely affect our ability to access and use data or to develop or market current or future services.
Data protection, privacy and similar laws protect more than patient information, and although they vary by jurisdiction, these laws can extend to employee information, business contact information, provider information and other information relating to identifiable individuals. Failure to comply with these laws may result in, among other things, civil and criminal liability, negative publicity, damage to our reputation and liability under contractual provisions. In addition, compliance with such laws may require increased costs to us or may dictate that we not offer certain types of services.
The occurrence of any of the foregoing could impact our ability to provide the same level of service to our clients, force us to modify our offerings or increase our costs, which could materially and adversely affect our operating results and financial condition.
Security breaches and unauthorized use of our IT systems and information, or the IT systems or information in the possession of our vendors, could expose us, our clients, our data suppliers or others to risk of loss.
We rely upon the security of our computer and communications systems infrastructure to protect us from cyber attacks and unauthorized access. Cyber attacks can include malware, computer viruses, hacking or other significant disruption of our computer, communications and related systems. Although we take steps to manage and avoid these risks and to prevent their recurrence, our preventive and remedial actions may not be successful. Such attacks, whether successful or unsuccessful, could result in our incurring costs related to, for example, rebuilding internal systems, defending against litigation, responding to regulatory inquiries or actions, paying damages or fines, or taking other remedial steps with respect to third parties. Publicity about vulnerabilities and attempted or successful incursions could damage our reputation with clients and data suppliers and reduce demand for our services.
We also store proprietary and sensitive information in connection with our business, which could be compromised by a cyber attack. To the extent that any disruption or security breach results in a loss or damage to our data, an inappropriate disclosure of proprietary or sensitive information, an inability to access data sources, or an inability to process data or provide our offerings to our clients, it could cause significant damage to our reputation, affect our relationships with our data suppliers and clients (including loss of suppliers and clients), lead to claims against us and ultimately harm our business. We may be required to incur significant costs to alleviate, remedy
23
Table of Contents
or protect against damage caused by these disruptions or security breaches in the future. We may also face inquiry or increased scrutiny from government agencies as a result of any such disruption or breach. While we have insurance coverage for certain instances of a cyber security breach, our coverage may not be sufficient if we suffer a significant attack or multiple attacks. Any such breach or disruption could have a material adverse effect on our operating results and our reputation as a provider of mission-critical services.
Some of our vendors have significant responsibility for the security of our global data center and certain computer-based platforms. Also, our data suppliers have responsibility for security of their own computer and communications environments. These third parties face risks relating to cyber security similar to ours, which could disrupt their businesses and therefore materially impact ours. Accordingly, we are subject to any flaw in or breaches to their computer and communications systems or those that they operate for us, which could result in a material adverse effect on our business, operations and financial results.
Hardware and software failures, delays in the operation of our computer and communications systems or the failure to implement system enhancements may adversely impact us.
Our success depends on the efficient and uninterrupted operation of our computer and communications systems. A failure of our network or data-gathering procedures could impede the processing of data, delivery of databases and services, client orders and day-to-day management of our business and could result in the corruption or loss of data.
While many of our operations have disaster recovery plans in place, we currently do not have excess or standby computer processing or network capacity everywhere in the world to avoid disruption in the receipt, processing and delivery of data in the event of a system failure. Despite any precautions we may take, damage from fire, floods, hurricanes, power loss, telecommunications failures, computer viruses, break-ins, sabotage, breaches of security, epidemics and similar events at our various computer facilities could result in interruptions in the flow of data to our servers and from our servers to our clients. In addition, any failure by our computer environment to provide sufficient processing or network capacity to transfer data could result in interruptions in our service. In the event of a delay in the delivery of data, we could be required to transfer our data collection operations to an alternative provider of server hosting services. Such a transfer could result in significant delays in our ability to deliver services to our clients, and increase our costs. Additionally, significant delays in the planned delivery of system enhancements, improvements and inadequate performance of the systems once they are completed could damage our reputation and harm our business. Finally, long-term disruptions in the infrastructure caused by events such as natural disasters, the outbreak of war, the escalation of hostilities, epidemics and acts of terrorism (particularly involving cities in which we have offices) could result in a material adverse affect.
Although we carry property and business interruption insurance, our coverage may not be adequate to compensate us for all losses that may occur. Any such failure, disruption or delay could have a material adverse effect on our operating results and our reputation.
Consolidation in the industries in which our clients operate may reduce the volume of services purchased by consolidated clients following an acquisition or merger, which could harm our operating results and financial condition.
Mergers or consolidations among our clients have in the past and could in the future reduce the number of our clients and potential clients. When companies consolidate, overlapping services
24
Table of Contents
previously purchased separately are usually purchased only once by the combined entity, leading to loss of revenue. Other services that were previously purchased by one of the merged or consolidated entities may be deemed unnecessary or cancelled. If our clients merge with or are acquired by other entities that are not our clients, or that use fewer of our services, they may discontinue or reduce their use of our services. There can be no assurance as to the degree to which we may be able to address the revenue impact of such consolidation. Any of these developments could harm our operating results and financial condition.
Laws restricting pharmaceutical sales and marketing practices may adversely impact demand for our services.
There have been a significant number of laws, legislative initiatives and regulatory actions over the years that seek to limit pharmaceutical sales and marketing practices. For example, three states in 2006 and 2007 passed laws restricting the use of prescriber identifiable information for the purpose of promoting branded prescription medicines. Although these laws were subsequently declared to be unconstitutional based on a decision of the U.S. Supreme Court in Sorrell v. IMS Health in 2011, we are unable to predict whether, and in what form, other initiatives may be introduced or actions taken at the state or Federal levels to limit pharmaceutical sales and marketing practices. In addition, while we will continue to seek to adapt our services to comply with the requirements of these laws (to the extent applicable to our services), if enacted, there can be no assurance that our efforts to adapt our offerings will be successful and provide the same financial contribution to us. There can also be no assurance that future legislative initiatives will not adversely affect our ability to develop or market current or future offerings, or that any future laws will not diminish the demand for our services, all of which could, over time, result in a material adverse impact on our operating results and financial condition.
Our business is subject to increasing competition.
Our future growth and success will depend on our ability to successfully compete with other companies that provide similar services in the same markets, some of which may have financial, marketing, technical and other advantages. We also expect that competition will continue to increase as a result of consolidation in both the information technology and healthcare industries. If one or more of our competitors or potential competitors were to merge or partner with another of our competitors, the change in the competitive landscape could adversely affect our ability to compete effectively. We compete on the basis of various factors, including breadth and depth of services, reputation, reliability, quality, innovation, security, price and industry expertise and experience. In addition, our ability to compete successfully may be impacted by the growing availability of health information from social media, government health information systems and other free or low-cost sources. For example, the United Kingdom’s National Health Service started releasing large volumes of data beginning in December 2011 at little or no charge, reducing the demand for our information services derived from similar data. In addition, consolidation or integration of wholesalers, retail pharmacies, health networks, payers or other healthcare stakeholders may lead any of them to provide information services directly to clients or indirectly through a designated service provider, resulting in increased competition from firms that may have lower costs to market (e.g., no data supply costs). Any of the above may result in lower demand for our services, which could result in a material adverse impact on our operating results and financial condition.
25
Table of Contents
Tax matters could adversely affect our operating results and financial condition.
We operate in more than 100 countries worldwide and our earnings are subject to taxation in many differing jurisdictions and at differing rates. We seek to organize our affairs in a tax-efficient manner, taking account of the jurisdictions in which we operate. Our provision for income taxes and cash tax liability in the future could be adversely affected by numerous factors, including income before taxes being lower than anticipated in countries with lower statutory tax rates and higher than anticipated in countries with higher statutory tax rates, changes in the valuation of deferred tax assets and liabilities, and changes in tax laws, regulations, accounting principles or interpretations thereof, which could harm our financial results in future periods. In addition, we are subject to continuous examination of our income tax returns by the U.S. Internal Revenue Service and other tax authorities. We regularly assess the likelihood of adverse outcomes resulting from these examinations to determine the adequacy of our provision for income taxes. There can be no assurance that the outcomes from these continuous examinations will not have an adverse effect on our provision for income taxes and tax liability.
Litigation or regulatory proceedings could have a material adverse effect on our operating results and financial condition.
In the normal course of our business, we are involved in lawsuits, claims, audits and investigations, such as those described in “Business—Legal proceedings.” The outcome of these matters could have a material adverse effect on our business, operating results or financial condition. In addition, we may become subject to future lawsuits, claims, audits and investigations that could result in substantial costs and divert our attention and resources. Litigation is inherently uncertain, and adverse rulings could occur, including monetary damages, or an injunction stopping us from producing, publishing or selling services, engaging in business practices or requiring other remedies such as divestitures.
Our business may be adversely impacted by factors affecting the pharmaceutical and healthcare industries.
The vast majority of our revenue is generated from sales to the pharmaceutical and healthcare industries. The clients we serve in these industries are commonly subject to financial pressures, including, but not limited to, increased costs, reduced demand for their products, reductions in pricing and reimbursement for products and services, formulary approval and placement, government approval to market their products and limits on the manner by which they market their products, loss of patent exclusivity (whether due to patent expiration or as a result of a successful legal challenge) and the proliferation of or changes to regulations applicable to these industries. To the extent our clients face such pressures, the demand for our services, or the prices our clients are willing to pay for those services, may decline. Any such decline could have a material adverse effect on our business.
Our success depends on our ability to protect our intellectual property rights.
Our ability to obtain, protect and enforce our intellectual property rights is subject to general litigation or third-party opposition risks, as well as the uncertainty as to the scope of protection, registrability, patentability, validity and enforceability of our intellectual property rights in each applicable country. Governments may adopt regulations, and government agencies or courts may render decisions, requiring compulsory licensing of intellectual property rights. When we seek to enforce our intellectual property rights we may be subject to claims that the intellectual property rights are invalid or unenforceable. Litigation may be necessary in the future to enforce our
26
Table of Contents
intellectual property rights and to protect our trade secrets. Litigation brought to protect and enforce our intellectual property rights could be costly, time consuming and distracting to management and could result in the impairment or loss of portions of our intellectual property rights. Furthermore, our efforts to enforce our intellectual property rights may be met with defenses, counterclaims and countersuits attacking the validity and enforceability of our intellectual property rights. Our inability to protect our proprietary technology against unauthorized copying or use, as well as any costly litigation or diversion of our management’s attention and resources, could delay further sales or the implementation of our solutions, impair the functionality of our solutions, delay introductions of new solutions, result in our substituting inferior or more costly technologies into our solutions, or injure our reputation and harm our operating results and financial condition.
The theft or unauthorized use or publication of our trade secrets and other confidential business information could reduce the differentiation of our services and harm our business; the value of our investment in development or business acquisitions could be reduced; and third parties might make claims against us related to losses of their confidential or proprietary information. These incidents and claims could harm our business, reduce revenue, increase expenses and harm our reputation.
We may be subject to claims by others that we are infringing on their intellectual property rights, which could harm our business and negatively impact our results of operations.
Third parties may assert claims that we or our clients infringe their intellectual property rights and these claims, with or without merit, could be expensive to litigate, cause us to incur substantial costs and divert management resources and attention in defending the claim. In some jurisdictions, plaintiffs can also seek injunctive relief that may limit the operation of our business or prevent the marketing and selling of our products or services that infringe on the plaintiff’s intellectual property rights. To resolve these claims, we may enter into licensing agreements with restrictive terms or significant fees, stop selling or redesign affected products or services, or pay damages to satisfy contractual obligations to others. If we do not resolve these claims in advance of a trial, there is no guarantee that we will be successful in court. These outcomes may have a material adverse impact on our operating results and financial condition.
In addition, certain contracts with our suppliers or clients contain provisions whereby we indemnify, subject to certain limitations, the counterparty for damages suffered as a result of claims related to intellectual property infringement and the use of our data. Claims made under these provisions could be expensive to litigate and could result in significant payments.
We rely on licenses from third parties to certain technology and intellectual property rights for some of our products and the licenses we currently have could terminate or expire.
Some of our products or services rely on technology or intellectual property rights owned and controlled by others. Our licenses to this technology or these intellectual property rights could be terminated or could expire. We may be unable to replace these licenses in a timely manner. Failure to renew these licenses, or renewals of these licenses on less advantageous terms, could harm our operating results and financial condition.
We may not be able to attract, retain and motivate talented personnel.
Our business is based on successfully attracting and retaining talented employees. The market for highly skilled workers and leaders in our industry and in the locations in which we operate is very
27
Table of Contents
competitive. If we are not successful in our recruiting efforts, or if we are unable to retain key employees, our ability to develop and deliver successful services may be adversely affected. Effective succession planning is also important to our long-term success. Failure to ensure effective transfer of knowledge and smooth transitions involving key employees could hinder our strategic planning and execution.
We regularly seek to grow our business through acquisitions of or investments in new or complementary businesses, services or technologies, or through strategic alliances, and the failure to manage such acquisitions, investments or alliances could have a material adverse effect on us.
In executing our business strategy, we routinely conduct discussions, evaluate opportunities and enter into agreements for possible investments, acquisitions and other transactions such as strategic alliances, and we actively pursue these types of transactions in the regular course of business. Pursuing growth by way of these types of transactions involves significant challenges and risks, including the inability to successfully identify acquisition candidates on terms acceptable to us, advance our business strategy, realize a satisfactory return on investment, successfully integrate business activities or resources, or retain key personnel. If we are unable to manage acquisitions or investments, or integrate any acquired businesses, services or technologies effectively, we may not realize the expected benefits from the transaction relative to the consideration paid, and our business, results of operations and financial condition may be materially and adversely affected.
Further, we may be unsuccessful in identifying and evaluating business, legal or financial risks as part of the due diligence process associated with a particular transaction. In addition, some investments may result in the incurrence of debt or may have contingent consideration components that may require us to pay additional amounts in the future in relation to future performance results of the subject business. If we do enter into agreements with respect to these transactions, we may fail to complete them due to factors such as failure to obtain regulatory or other approvals. We may be unable to realize the full benefits from these transactions, such as increased revenue or enhanced efficiencies, within the timeframes that we expect or at all. These events could divert attention from our other businesses and harm our business, financial condition and operating results.
We may experience challenges with the acquisition, development, enhancement or deployment of technology necessary for our business.
We operate in businesses that require sophisticated computer systems and software for data collection, data processing, cloud-based platforms, analytics, cryptography, statistical projections and forecasting, mobile computing, social media analytics and other applications and technologies. We seek to address our technology risks by increasing our reliance on the use of innovations by cross-industry technology leaders and adapt these for our pharmaceutical and healthcare industry clients. Some of these technologies supporting the industries we serve are changing rapidly and we must continue to adapt to these changes in a timely and effective manner at an acceptable cost. We also must continue to deliver data to our clients in forms that are easy to use while simultaneously providing clear answers to complex questions. There can be no guarantee that we will be able to develop, acquire or integrate new technologies, that these new technologies will meet our clients’ needs or achieve expected investment goals, or that we will be able to do so as quickly or cost-effectively as our competitors. Significant technological change could render our services obsolete. Moreover, the introduction of new services
28
Table of Contents
embodying new technologies could render existing services obsolete. Our continued success will depend on our ability to adapt to changing technologies, manage and process ever-increasing amounts of data and information and improve the performance, features and reliability of our services in response to changing client and industry demands. We may experience difficulties that could delay or prevent the successful design, development, testing, introduction or marketing of our services. New services, or enhancements to existing services, may not adequately meet the requirements of current and prospective clients or achieve any degree of significant market acceptance. Any of these failures could have a material adverse effect on our operating results and financial condition.
Our business is subject to international economic, political and other risks that could negatively affect our results of operations and financial condition.
We have business activities in over 100 countries, and for the year ended December 31, 2013, we generated 63% of our $2.54 billion of revenue from outside the United States. Further, some of our business activities are concentrated into global or regional hubs in one or more geographic areas. For example, to support our businesses in many other countries, we handle standardizing and cleaning of data in Manila, The Philippines, advanced statistics in Beijing, China, analytical support for delivery in Bangalore, India, and reference data management in Santiago, Chile. We are therefore subject to heightened risks inherent in conducting business internationally, in particular in the emerging markets in which we conduct and into which we are expanding our business. These risks include, for example:
| • | required compliance with a variety of local laws and regulations which may be materially different than those to which we are subject in the United States or which may change unexpectedly; |
| • | local, economic, political and social conditions, including potential hyperinflationary conditions, political instability, and potential nationalization, repatriation, expropriation, price controls or other restrictive government actions; |
| • | hiring, retaining and overseeing qualified management personnel for managing operations in multiple countries; |
| • | differing employment practices and labor issues; |
| • | tax-related risks, including the imposition of taxes and the lack of beneficial treaties, that result in a higher effective tax rate for us; |
| • | difficulties in enforcing agreements through certain foreign local systems; |
| • | limitations on ownership and on repatriation of earnings; |
| • | possible liabilities under applicable anti-corruption laws, export controls, anti-boycott and economic sanctions laws; |
| • | longer sales and payment cycles; |
| • | reduced protection for intellectual property rights in some countries; and |
| • | security concerns, including crime, political instability and international response thereto. |
To the extent we are unable to effectively manage our international operations and these risks, our data acquisition activities and sales for certain countries may be adversely affected, we may
29
Table of Contents
be subject to additional and unanticipated costs, and we may be subject to litigation or regulatory action. As a consequence, our business, financial condition and results of operations could be seriously harmed.
Further, we have substantial assets, liabilities, revenue and expenses denominated in currencies other than the U.S. dollar, and although we hedge a portion of our international currency exposure, we are subject to currency translation exposure on the profits and financial position of our operations, in addition to economic exposure, as a result of devaluations and fluctuations in currency exchange rates or the imposition of limitations on conversion of foreign currencies into dollars.
We may be exposed to liabilities under applicable anti-corruption laws and any determination that we violated these laws could have a material adverse effect on our business.
We are subject to various anti-corruption laws that prohibit improper payments or offers of payments to foreign governments their officials and others for the purpose of obtaining or retaining business. We have business in countries and regions which are less developed and are generally recognized as potentially more corrupt business environments. Our activities in these countries create the risk of unauthorized payments or offers of payments by one of our employees or agents that could be in violation of various anti-corruption laws including the Foreign Corrupt Practices Act (“FCPA”) the U.K. Bribery Act and other local laws. We have implemented safeguards and policies to discourage these practices by our employees and agents. However, our existing safeguards and any future improvements may prove to be less than effective and our employees or agents may engage in conduct for which we might be held responsible. In addition, our significant recent growth globally over the last few years and our anticipated future growth, both organically and through acquisitions, may exacerbate these risks and strain our ability to effectively manage the increased breadth and scope of our activities to avoid these risks. If employees violate our policies or we fail to maintain adequate record-keeping and internal accounting practices to accurately record our transactions, we may be subject to regulatory sanctions. Violations of the FCPA or other anti-corruption laws may result in severe criminal or civil sanctions and penalties, including disgorgement of profits, injunctions and debarment from government contracts, and we may be subject to other liabilities which could have a material adverse effect on our business, results of operations and financial condition.
Catastrophic events or geo-political conditions may disrupt our business.
A disruption or failure of our systems or operations because of a major earthquake, weather event, cyber-attack, terrorist attack, pandemic or other catastrophic event could cause delays in completing sales, providing services, collecting data or performing other mission-critical functions in affected areas. A catastrophic event that results in the destruction or disruption of any of our critical business or information technology systems could harm our ability to conduct normal business operations. Our move toward providing our clients with more services and solutions in the cloud puts a premium on the resilience of our systems and strength of our business continuity management plans, and magnifies the potential impact of prolonged service outages on our operating results. Abrupt political change, terrorist activity and armed conflict pose a risk of general economic disruption in affected countries, which may increase our operating costs or reduce our revenue.
30
Table of Contents
We face risks related to sales to government entities.
We derive a portion of our revenue from sales to government entities in the United States, which represented less than 1% of our revenues in each of the last three fiscal years. In general, our contracts with U.S. government entities are terminable at will by the government entity at any time. Government demand and payment for our services may be affected by public-sector budgetary cycles and funding authorizations. Government contracts are subject to oversight, including special rules on accounting, expenses, reviews and security. Failure to comply with these rules could result in civil and criminal penalties and sanctions, including termination of contracts, fines and suspensions, or debarment from future business with the U.S. government. As a result, failure to comply with these rules could have a material adverse effect on our operating results and financial condition.
Our use of accounting estimates involves judgment and could adversely impact our financial results, and ineffective internal controls could adversely impact our business and operating results.
The methods, estimates and judgments that we use in applying accounting policies have a significant impact on our results of operations. For more information, see Note 2 to our consolidated financial statements included elsewhere in this prospectus. These methods, estimates and judgments are subject to significant risks, uncertainties and assumptions, and changes could affect our results of operations. In addition, our internal control over financial reporting may not prevent or detect misstatements because of the inherent limitations, including the possibility of human error, the circumvention or overriding of controls, or fraud. Even effective internal controls can provide only reasonable assurance with respect to the preparation and fair presentation of financial statements. If we fail to maintain the adequacy of our internal controls, including any failure to implement required new or improved controls, or if we experience difficulties in their implementation, our business and operating results could be harmed and we could fail to meet our reporting obligations.
Risks relating to our common stock and this offering
Our Sponsors will continue to have significant influence over us after this offering, including control over decisions that require the approval of stockholders, which could limit your ability to influence the outcome of matters submitted to stockholders for a vote.
We are currently controlled, and after this offering is completed will continue to be controlled, by the Sponsors. Upon completion of this offering, investment funds affiliated with the Sponsors will beneficially own % of our outstanding common stock (or % if the underwriters exercise in full their option to purchase additional shares from us and the selling stockholders). As long as the Sponsors own or control at least a majority of our outstanding voting power, they will have the ability to exercise substantial control over all corporate actions requiring stockholder approval, irrespective of how our other stockholders may vote, including the election and removal of directors and the size of our board of directors, any amendment of our certificate of incorporation or bylaws, or the approval of any merger or other significant corporate transaction, including a sale of substantially all of our assets. Even if their ownership falls below 50%, the Sponsors will continue to be able to strongly influence or effectively control our decisions.
Additionally, the Sponsors interests may not align with the interests of our other stockholders. The Sponsors are in the business of making investments in companies and may acquire and hold
31
Table of Contents
interests in businesses that compete directly or indirectly with us. The Sponsors may also pursue acquisition opportunities that may be complementary to our business, and, as a result, those acquisition opportunities may not be available to us. In addition, our certificate of incorporation provides that we renounce any interest or expectancy in the business opportunities of the Sponsors and of their officers, directors, agents, stockholders, members, partners, affiliates and subsidiaries and each such party shall not have any obligation to offer us those opportunities unless presented to one of our directors or officers in his or her capacity as a director or officer.
Upon the listing of our shares, we will be a “controlled company” within the meaning of the rules of the NYSE and, as a result, will qualify for, and intend to rely on, exemptions from certain corporate governance requirements; you will not have the same protections afforded to stockholders of companies that are subject to such requirements.
Because the Sponsors will continue to control a majority of the voting power of our outstanding common stock after completion of this offering, we will be a “controlled company” within the meaning of the corporate governance standards of the NYSE. Under these rules, a company of which more than 50% of the voting power for the election of directors is held by an individual, group or another company is a “controlled company” and may elect not to comply with certain corporate governance requirements, including the requirements that, within one year of the date of the listing of our common stock:
| • | we have a board of directors that is composed of a majority of “independent directors,” as defined under the rules of the NYSE; |
| • | we have a compensation committee that is composed entirely of independent directors; and |
| • | we have a nominating and corporate governance committee that is composed entirely of independent directors. |
Following this offering, we intend to avail ourselves of all of these exemptions. Accordingly, in the event the interests of our Sponsors differ from those of other stockholders, and, for so long as we are a “controlled company,” you will not have the same protections afforded to stockholders of companies that are subject to all of the corporate governance requirements of the NYSE. Our status as a controlled company could make our common stock less attractive to some investors or otherwise harm our stock price.
Provisions of our corporate governance documents could make an acquisition of our company more difficult and may prevent attempts by our stockholders to replace or remove our current management, even if beneficial to our stockholders.
In addition to the Sponsors’ beneficial ownership of a controlling percentage of our common stock, our certificate of incorporation and bylaws and the Delaware General Corporation Law (the “DGCL”) contain provisions that could make it more difficult for a third party to acquire us, even if doing so might be beneficial to our stockholders.
These provisions, some of which (as noted below) only become effective when the Sponsors no longer beneficially own a majority of our common stock (the “Trigger Date”), include:
| • | the division of our board of directors into three classes and the election of each class for three-year terms; |
| • | the sole ability of the board of directors to fill a vacancy created by the expansion of the board of directors; |
32
Table of Contents
| • | advance notice requirements for stockholder proposals and director nominations; |
| • | after the Trigger Date, limitations on the ability of stockholders to call special meetings and to take action by written consent; |
| • | after the Trigger Date, in certain cases, the required approval of holders of at least 75% of the shares entitled to vote generally on the amendment or repeal of our certificate of incorporation or bylaws to adopt, amend or repeal our bylaws, or amend or repeal certain provisions of our certificate of incorporation; |
| • | after the Trigger Date, the required approval of holders of at least 75% of the shares entitled to vote in an election of directors to remove directors, which removal may only be for cause; and |
| • | the ability of our board of directors to issue new series of, and designate the terms of, preferred stock, without stockholder approval, which could be used to, among other things, institute a rights plan that would have the effect of significantly diluting the stock ownership of a potential hostile acquirer, likely preventing acquisitions that have not been approved by our board of directors. |
In addition, Section 203 of the DGCL may affect the ability of an “interested stockholder” to engage in certain business combinations, for a period of three years following the time that the stockholder becomes an “interested stockholder.” We have elected in our certificate of incorporation not to be subject to Section 203 of the DGCL. Nevertheless, our certificate of incorporation will contain provisions that have the same effect as Section 203 of the DGCL, except that they provide that the Sponsors and their transferees will not be deemed to be “interested stockholders,” and accordingly will not be subject to such restrictions.
These provisions may frustrate or prevent any attempts by our stockholders to replace or remove our current management by making it more difficult for stockholders to replace members of our board of directors. Because our board is responsible for appointing the members of our management team, these provisions could in turn affect any attempt to replace current members of our management team. As a result, you may lose your ability to sell your stock for a price in excess of the prevailing market price due to these protective measures, and efforts by stockholders to change the direction or management of the Company may be unsuccessful. See “Description of capital stock.”
If you purchase shares of common stock in this offering, you will suffer immediate and substantial dilution of your investment.
The initial public offering price of our common stock is substantially higher than the net tangible book deficit per share of our common stock. Therefore, if you purchase shares of our common stock in this offering, you will pay a price per share that substantially exceeds our net tangible book deficit per share after this offering. Based on the initial public offering price of $ per share, you will experience immediate dilution of $ per share, representing the difference between our pro forma net tangible book deficit per share after giving effect to this offering and the initial public offering price. In addition, purchasers of common stock in this offering will have contributed % of the aggregate price paid by all purchasers of our stock but will own only approximately % of our common stock outstanding after this offering. We also have a
33
Table of Contents
large number of outstanding stock options to purchase common stock with exercise prices that are below the estimated initial public offering price of our common stock. To the extent that these options are exercised, you will experience further dilution. See “Dilution” for more detail.
An active, liquid trading market for our common stock may not develop, which may limit your ability to sell your shares.
Prior to this offering, there was no public market for our common stock. Although we have applied to list our common stock on the NYSE under the symbol “IMS,” an active trading market for our shares may never develop or be sustained following this offering. The initial public offering price will be determined by negotiations between us and the underwriters and may not be indicative of market prices of our common stock that will prevail in the open market after the offering. A public trading market having the desirable characteristics of depth, liquidity and orderliness depends upon the existence of willing buyers and sellers at any given time, such existence being dependent upon the individual decisions of buyers and sellers over which neither we nor any market maker has control. The failure of an active and liquid trading market to develop and continue would likely have a material adverse effect on the value of our common stock. The market price of our common stock may decline below the initial public offering price, and you may not be able to sell your shares of our common stock at or above the price you paid in this offering, or at all. An inactive market may also impair our ability to raise capital to continue to fund operations by selling shares and may impair our ability to acquire other companies or technologies by using our shares as consideration.
As a public company, we will become subject to additional laws, regulations and stock exchange listing standards, which will impose additional costs on us and may strain our resources and divert our management’s attention.
We have operated our business as a private company since February 2010, following the Merger. After this offering, we will be subject to the reporting requirements of the Securities Exchange Act of 1934, as amended (the “Exchange Act”), the Sarbanes-Oxley Act of 2002, as amended, the Dodd-Frank Wall Street Reform and Consumer Protection Act of 2010 (“Dodd-Frank Act”), the listing requirements of the NYSE, and other applicable securities laws and regulations. Compliance with these laws and regulations will increase our legal and financial compliance costs and make some activities more difficult, time-consuming or costly. For example, the Exchange Act will require us, among other things, to file annual, quarterly and current reports with respect to our business and operating results. We also expect that being a public company and being subject to new rules and regulations will make it more expensive for us to obtain director and officer liability insurance, and we may be required to accept reduced coverage or incur substantially higher costs to obtain coverage. We estimate that we will incur between $ million and $ million annually in expenses related to incremental insurance costs and other expenses associated with being a public company, including listing, printer and XBRL fees and investor relations costs. However, the incremental costs that we incur as a result of becoming a public company could exceed our estimate. These factors may therefore strain our resources, divert management’s attention and affect our ability to attract and retain qualified board members.
Our operating results and share price may be volatile, and the market price of our common stock after this offering may drop below the price you pay.
Our quarterly operating results are likely to fluctuate in the future as a publicly traded company. In addition, securities markets worldwide have experienced, and are likely to continue to
34
Table of Contents
experience, significant price and volume fluctuations. This market volatility, as well as general economic, market or political conditions, could subject the market price of our shares to wide price fluctuations regardless of our operating performance. We and the underwriters will negotiate to determine the initial public offering price. You may not be able to resell your shares at or above the initial public offering price or at all. Our operating results and the trading price of our shares may fluctuate in response to various factors, including:
| • | market conditions in the broader stock market; |
| • | actual or anticipated fluctuations in our quarterly financial and operating results; |
| • | introduction of new products or services by us or our competitors; |
| • | issuance of new or changed securities analysts’ reports or recommendations; |
| • | results of operations that vary from expectations of securities analysis and investors; |
| • | guidance, if any, that we provide to the public, any changes in this guidance or our failure to meet this guidance; |
| • | strategic actions by us or our competitors; |
| • | announcement by us, our competitors or our vendors of significant contracts or acquisitions; |
| • | charges to our earnings resulting from impairments of goodwill or other intangible assets; |
| • | restructuring-related charges; |
| • | sales, or anticipated sales, of large blocks of our stock; |
| • | additions or departures of key personnel; |
| • | regulatory, legal or political developments; |
| • | public response to press releases or other public announcements by us or third parties, including our filings with the SEC; |
| • | litigation and governmental investigations; |
| • | changing economic conditions; |
| • | changes in accounting principles; |
| • | default under agreements governing our indebtedness; |
| • | exchange rate fluctuations; and |
| • | other events or factors, including those from natural disasters, war, actors of terrorism or responses to these events. |
These and other factors, many of which are beyond our control, may cause our operating results and the market price and demand for our shares to fluctuate substantially. While we believe that operating results for any particular quarter are not necessarily a meaningful indication of future results, fluctuations in our quarterly operating results could limit or prevent investors from readily selling their shares and may otherwise negatively affect the market price and liquidity of our shares. In addition, in the past, when the market price of a stock has been volatile, holders of that stock have sometimes instituted securities class action litigation against the company that
35
Table of Contents
issued the stock. If any of our stockholders brought a lawsuit against us, we could incur substantial costs defending the lawsuit. Such a lawsuit could also divert the time and attention of our management from our business, which could significantly harm our profitability and reputation.
A significant portion of our total outstanding shares are restricted from immediate resale but may be sold into the market in the near future. This could cause the market price of our common stock to drop significantly, even if our business is doing well.
Sales of a substantial number of shares of our common stock in the public market could occur at any time. These sales, or the perception in the market that the holders of a large number of shares intend to sell shares, could reduce the market price of our common stock. After this offering, we will have outstanding shares of common stock based on the number of shares outstanding as of , 2014. This includes shares that we are selling in this offering, as well as the shares that the selling stockholders are selling, which may be resold in the public market immediately, and assumes no exercises of outstanding options. Substantially all of the shares that are not being sold in this offering will be subject to a 180-day lock-up period provided under agreements executed in connection with this offering. These shares will, however, be able to be resold after the expiration of the lock-up agreement as described in the “Shares eligible for future sale” section of this prospectus. We also intend to file a Form S-8 under the Securities Act of 1933, as amended (“Securities Act”) to register all shares of common stock that we may issue under our equity compensation plans and, in connection with this offering, we will enter into an amended and restated stockholders’ agreement with the Sponsors that provides them with registration rights. Once we register these shares, they can be freely sold in the public market upon issuance, subject to the lock-up agreements described in the “Underwriting” section of this prospectus. As restrictions on resale end, the market price of our stock could decline if the holders of currently restricted shares sell them or are perceived by the market as intending to sell them. See the information under the heading “Shares eligible for future sale” and “Certain relationships and related party transactions—Stockholders’ agreement” for a more detailed description of the shares of common stock that will be available for future sale upon completion of this offering.
Since we have no current plans to pay regular cash dividends on our common stock following this offering, you may not receive any return on investment unless you sell your common stock for a price greater than that which you paid for it.
Although we have previously declared dividends to our stockholders, we do not anticipate paying any regular cash dividends on our common stock following this offering. Any decision to declare and pay dividends in the future will be made at the discretion of our board of directors and will depend on, among other things, our results of operations, financial condition, liquidity requirements, contractual restrictions and other factors that our board of directors may deem relevant. In addition, our ability to pay dividends is, and may be, limited by covenants of existing and any future outstanding indebtedness we or our subsidiaries incur, including under IMS Health’s second amended and restated credit agreement and related security and other documents for a senior secured term loan facility and a senior secured revolving facility with a syndicate of institutional lenders and financial institutions (collectively, the “Senior Secured Credit Facilities”) and the 6% Senior Notes (as defined herein). The Senior Secured Credit Facilities and the 6% Senior Notes restrict IMS Health’s ability to pay dividends and make certain other distributions by imposing caps on the aggregate amount thereof as well as certain other conditions including, in some cases, financial incurrence tests, to declare and pay such dividends and distributions.
36
Table of Contents
Therefore, any return on investment in our common stock is solely dependent upon the appreciation of the price of our common stock on the open market, which may not occur. See “Dividend policy” for more detail.
We are a holding company with nominal net worth and will depend on dividends and distributions from our subsidiaries to pay any dividends.
IMS Health Holdings, Inc. is a holding company with nominal net worth. We do not have any material assets or conduct any business operations other than our investments in our subsidiaries. Our business operations are conducted primarily out of our indirect operating subsidiary, IMS Health and its subsidiaries. As a result, notwithstanding any restrictions on payment of dividends under our existing indebtedness, our ability to pay dividends, if any, will be dependent upon cash dividends and distributions or other transfers from our subsidiaries, including from IMS Health. Payments to us by our subsidiaries will be contingent upon their respective earnings and subject to any limitations on the ability of such entities to make payments or other distributions to us.
If securities or industry analysts do not publish research or reports about our business, if they adversely change their recommendations regarding our shares or if our results of operations do not meet their expectations, our share price and trading volume could decline.
The trading market for our shares will be influenced by the research and reports that industry or securities analysts publish about us or our business. We do not have any control over these analysts. If one or more of these analysts cease coverage of our company or fail to publish reports on us regularly, we could lose visibility in the financial markets, which in turn could cause our share price or trading volume to decline. Moreover, if one or more of the analysts who cover us downgrade our stock, or if our results of operations do not meet their expectations, our share price could decline.
Risks related to our indebtedness
Our substantial level of indebtedness could adversely affect our ability to raise additional capital to fund our operations, limit our ability to react to changes in the economy or our industry, expose us to interest rate risk to the extent of our variable rate debt and prevent us from meeting obligations on our indebtedness.
We have a substantial amount of indebtedness. As of December 31, 2013, before giving effect to the Refinancing and the application of the proceeds from this offering, our total indebtedness was $5,027 million (excluding capital lease obligations). Certain of our subsidiaries have an additional $375 million of borrowing capacity (less outstanding letters of credit, if any) available under the Senior Secured Credit Facilities, and the right to request additional commitments for new term loans and to increase the size of the existing revolving credit facility in an aggregate principal amount up to the greater of (i) $300.0 million and (ii) the amount of new term loans and increased revolving credit commitments such that the senior secured net leverage ratio shall be no greater than 3.50 to 1.00 after giving pro forma effect to such increases (assuming such revolving credit commitments are fully borrowed). Our level of indebtedness as of December 31, 2013 consisted of $2,777 billion outstanding under our Senior Secured Credit Facilities, $375 million of unused commitments outstanding under the revolving portion of the Senior Secured Credit Facilities (excluding outstanding letters of credit, if any), $750.0 million of the Senior PIK Notes, $999.6 million of the New 12.5% Senior Notes, $0.4 million of the Old 12.5% Senior Notes and $500.0 million of 6% Senior Notes due 2020 (the “6% Senior Notes”). See “Description of indebtedness.”
37
Table of Contents
Our substantial level of indebtedness could adversely affect our financial condition and increase the possibility that we may be unable to generate cash sufficient to pay, when due, the principal of, interest on or other amounts due in respect of our indebtedness. Our substantial indebtedness, combined with our other existing and any future financial obligations and contractual commitments, could have important consequences. For example, it could:
| • | make it more difficult for us to satisfy our obligations with respect to our indebtedness, and any failure to comply with the obligations under any of our debt instruments, including restrictive covenants, could result in an event of default under the agreements governing such indebtedness; |
| • | require us to dedicate a substantial portion of our cash flow from operations to payments on our indebtedness, thereby reducing funds available for working capital, capital expenditures, acquisitions, selling and marketing efforts, research and development and other purposes; |
| • | increase our vulnerability to adverse economic and industry conditions, which could place us at a competitive disadvantage compared to our competitors that have relatively less indebtedness; |
| • | cause us to incur substantial fees from time to time in connection with debt amendments or refinancings; |
| • | increase our exposure to rising interest rates because a portion of our borrowings is at variable interest rates; |
| • | place us at a disadvantage compared to our competitors that have less debt; |
| • | limit our flexibility in planning for, or reacting to, changes in our business and the industries in which we operate; and |
| • | limit our ability to borrow additional funds, or to dispose of assets to raise funds, if needed, for working capital, capital expenditures, acquisitions, selling and marketing efforts, research and development and other corporate purposes. |
Despite our level of indebtedness, we are able to incur more debt and undertake additional obligations. Incurring such debt or undertaking such additional obligations could further exacerbate the risks our indebtedness poses to our financial condition.
We, including our subsidiaries, may be able to incur significant additional indebtedness in the future. Although the credit agreement governing the Senior Secured Credit Facilities and the indentures governing our outstanding notes contain restrictions on the incurrence of additional indebtedness, these restrictions are subject to a number of significant qualifications and exceptions, and any indebtedness incurred in compliance with these restrictions could be substantial. These restrictions also will not prevent us from incurring obligations that do not constitute indebtedness, may be waived by certain votes of debt holders and, if we refinance existing indebtedness, such refinancing indebtedness may contain fewer restrictions on our activities. To the extent new indebtedness is added to our and our subsidiaries’ currently anticipated indebtedness levels, the related risks that we and our subsidiaries face could intensify.
While the credit agreement governing the Senior Secured Credit Facilities and the indentures governing our outstanding notes also contain restrictions on making certain loans and investments, these restrictions are subject to a number of qualifications and exceptions, and the investments incurred in compliance with these restrictions could be substantial.
38
Table of Contents
Restrictions imposed in the Senior Secured Credit Facilities and our other outstanding indebtedness, including the indentures governing our outstanding notes, may limit our ability to operate our business and to finance our future operations or capital needs or to engage in other business activities.
The terms of the Senior Secured Credit Facilities restrict us from engaging in specified types of transactions. These covenants restrict our ability, among other things, to:
| • | incur liens and engage in sale-leaseback transactions; |
| • | make investments and loans; |
| • | make capital expenditures; |
| • | incur indebtedness or guarantees; |
| • | engage in mergers, acquisitions and asset sales; |
| • | declare dividends, make payments or redeem or repurchase equity interests; |
| • | alter the business IMS Health and its restricted subsidiaries conduct; |
| • | enter into agreements limiting restricted subsidiary distributions; |
| • | prepay, redeem or purchase certain indebtedness; and |
| • | engage in certain transactions with affiliates. |
In addition, the credit agreement governing the Senior Secured Credit Facility requires us to comply with a quarterly maximum leverage ratio test, which financial covenant becomes more restrictive over time, and limits our ability to make capital expenditures. Our ability to comply with this financial covenant can be affected by events beyond our control, and we may not be able to satisfy it. Additionally, the restrictions contained in the indentures governing our outstanding notes could also limit our ability to plan for or react to market conditions, meet capital needs or make acquisitions or otherwise restrict our activities or business plans. See “Description of indebtedness.”
A breach of any of these covenants could result in a default under the Senior Secured Credit Facilities or the indentures governing our outstanding notes, which could trigger acceleration of our indebtedness and may result in the acceleration of or default under any other debt to which a cross-acceleration or cross-default provision applies, which could have a material adverse effect on our business, operations and financial results. In the event of any default under the Senior Secured Credit Facilities, the applicable lenders could elect to terminate borrowing commitments and declare all borrowings and loans outstanding, together with accrued and unpaid interest and any fees and other obligations, to be due and payable. In addition, or in the alternative, the applicable lenders could exercise their rights under the security documents entered into in connection with the Senior Secured Credit Facilities. We have pledged substantially all of our tangible and intangible assets (subject to customary exceptions) as collateral under the Senior Secured Credit Facilities, including the stock and the assets of certain of our current and future wholly owned U.S. subsidiaries and a portion of the stock of certain of our non-U.S. subsidiaries.
If we were unable to repay or otherwise refinance these borrowings and loans when due, the applicable lenders could proceed against the collateral granted to them to secure that indebtedness, which could force us into bankruptcy or liquidation. In the event the applicable
39
Table of Contents
lenders accelerate the repayment of our borrowings, we and our subsidiaries may not have sufficient assets to repay that indebtedness. Any acceleration of amounts due under the credit agreement governing the Senior Secured Credit Facilities or the exercise by the applicable lenders of their rights under the security documents would likely have a material adverse effect on us.
We may not be able to generate sufficient cash to service all of our indebtedness and may be forced to take other actions to satisfy our obligations under our indebtedness, which may not be successful.
Our ability to make scheduled payments on or to refinance our debt obligations and to fund our planned capital expenditures, acquisitions and other ongoing liquidity needs depends on our financial condition and operating performance, which is subject to prevailing economic and competitive conditions and to certain financial, business and other factors beyond our control. There can be no assurance that we will maintain a level of cash flows from operating activities or that future borrowings will be available to us under the Senior Secured Credit Facilities or otherwise in an amount sufficient to permit us to pay the principal, premium, if any, and interest on our indebtedness and fund our planned capital expenditures, acquisitions and other ongoing liquidity needs.
If our cash flows and capital resources are insufficient to fund our debt service obligations, we may be forced to reduce or delay investments and capital expenditures, or to sell assets, seek additional capital or restructure or refinance our indebtedness. Our ability to restructure or refinance our debt will depend on the condition of the capital markets and our financial condition at such time. Any refinancing of our debt could be at higher interest rates and may require us to comply with more onerous covenants, which could further restrict our business operations. The terms of existing or future debt instruments may restrict us from adopting some of these alternatives. In addition, any failure to make payments of interest and principal on our outstanding indebtedness on a timely basis would likely result in a reduction of our credit rating, which could harm our ability to incur additional indebtedness. In the absence of such operating results and resources, we could face substantial liquidity problems and might be required to dispose of material assets or operations to meet our debt service and other obligations. The Senior Secured Credit Facilities and the indentures governing our outstanding notes restrict our ability to dispose of assets and use the proceeds from any such disposition. We may not be able to consummate those dispositions or to obtain the proceeds that we could realize from them and these proceeds may not be adequate to meet any debt service obligations then due. These alternative measures may not be successful and may not permit us to meet our debt service obligations.
A ratings downgrade or other negative action by a ratings organization could adversely affect the trading price of the shares of our common stock.
Credit rating agencies continually revise their ratings for companies they follow. The condition of the financial and credit markets and prevailing interest rates have fluctuated in the past and are likely to fluctuate in the future. In addition, developments in our business and operations could lead to a ratings downgrade for us or our subsidiaries. Any such fluctuation in the rating of us or our subsidiaries may impact our ability to access debt markets in the future or increase our cost of future debt which could have a material adverse effect on our operations and financial condition, which in return may adversely affect the trading price of shares of our common stock.
40
Table of Contents
Cautionary note regarding forward-looking statements
This prospectus contains forward-looking statements. Forward-looking statements are neither historical facts nor assurances of future performance. Instead, they are based on our current beliefs, expectations and assumptions regarding the future of our business, future plans and strategies, and other future conditions. Forward-looking statements can be identified by words such as “anticipate,” “believe,” “envision,” “estimate,” “expect,” “intend,” “may,” “plan,” “predict,” “project,” “target,” “potential,” “will,” “would,” “could,” “should,” “continue,” “contemplate” and other similar expressions, although not all forward-looking statements contain these identifying words. Examples of forward-looking statements include, among others, statements we make regarding:
| • | plans for future growth and other business development activities; |
| • | plans for capital expenditures; |
| • | expectations for market and industry growth; |
| • | financing sources; |
| • | dividends; |
| • | the effects of regulation and competition; |
| • | foreign currency conversion; and |
| • | all other statements regarding our intent, plans, beliefs or expectations or those of our directors or officers. |
We may not actually achieve the plans, intentions or expectations disclosed in our forward-looking statements, and you should not place significant reliance on our forward-looking statements. Actual results or events could differ materially from the plans, intentions and expectations disclosed in the forward-looking statements we make. Important factors that could cause actual results and events to differ materially from those indicated in the forward-looking statements include, among others, the following:
| • | our data suppliers might restrict our use of or refuse to license data, which could lead to our inability to provide certain products or services; |
| • | failure to meet productivity objectives under our internal business transformation initiatives could adversely impact our competitiveness and our ability to meet our growth objectives; |
| • | we may be unsuccessful at investing in growth opportunities; |
| • | data protection and privacy laws may restrict our current and future activities; |
| • | breaches or misuse of our or our outsourcing partners’ security or communication systems could expose us, our clients, our data suppliers or others to risk of loss; |
| • | hardware and software failures, delays in the operation of our computer and communications systems or the failure to implement system enhancements may adversely impact us; |
41
Table of Contents
| • | consolidation in the industries in which our clients operate may reduce the volume of products and services purchased by consolidated clients following an acquisition or merger; and |
| • | our ability to protect our intellectual property rights and our susceptibility to claims by others that we are infringing on their intellectual property rights. |
The forward-looking statements in this prospectus represent our views as of the date of this prospectus. We undertake no obligation to publicly update any forward-looking statements whether as a result of new information, future developments or otherwise.
42
Table of Contents
We estimate that the net proceeds to us from our issuance and sale of shares of common stock in this offering will be approximately $ million, after deducting underwriting discounts and commissions and estimated offering expenses payable by us (or approximately $ million if the underwriters exercise their option to purchase additional shares of common stock in full). This estimate assumes an initial public offering price of $ per share, the midpoint of the price range set forth on the cover page of this prospectus.
We intend to use the net proceeds of this offering, along with borrowings under our New Term Loans and cash on our balance sheet, (i) to fund the redemption of all of our Senior PIK Notes and 12.5% Senior Notes; (ii) to pay an estimated amount of $ million in the aggregate to holders of outstanding Phantom SARs and (iii) to pay a one-time fee to terminate our management services agreement with the Sponsors of $ million. We intend to use the remainder of the net proceeds, if any, for general corporate purposes.
We are required to pay interest entirely in cash at a rate of 7.375% per annum on the Senior PIK Notes, unless certain conditions are satisfied, in which case we are entitled to pay interest on the Senior PIK Notes by increasing the principal amount of such notes or by issuing new notes (the issuance or interest, referred to herein as the “PIK Interest”). PIK Interest on the Senior PIK Notes accrues at a rate of 8.125% per annum (which is equal to the cash interest rate plus 75 basis points). The Senior PIK Notes mature on September 1, 2018. The Senior PIK Notes were issued on August 1, 2013, and the proceeds of the Senior PIK Notes were used to pay a cash dividend of $753 million on the outstanding shares of our common stock and to pay related fees and expenses.
The 12.5% Senior Notes accrue cash interest at the rate of 12.5% per year and we are required to pay interest entirely in cash. The 12.5% Senior Notes mature on March 1, 2018.
We will not receive any proceeds from the sale of shares by the selling stockholders, including if the underwriters exercise their option to purchase additional shares. After deducting the underwriting discounts, the selling stockholders will receive approximately $ million of proceeds from this offering.
A $1.00 increase (decrease) in the assumed public offering price of $ , based upon the midpoint of the estimated price range set forth on the cover of this prospectus, would increase (decrease) the net proceeds to us from this offering by $ million (or approximately $ million if the underwriters exercise their option to purchase additional shares of common stock in full), assuming the number of shares we offer, as set forth on the cover page of this prospectus, remains the same and after deducting underwriting discounts and commissions and estimated offering expenses payable by us. A share increase (decrease) in the number of shares offered by us would increase (decrease) the net proceeds to us from this offering by $ million (or approximately $ million if the underwriters exercise their option to purchase additional shares of common stock in full), assuming the aggregate offering price set forth on the cover page of this prospectus remains the same, and after deducting underwriting discounts and commissions and estimated offering expenses payable by us.
Dividends declared in the year preceding an initial public offering are deemed to be in contemplation of the offering with the intention of repayment out of the offering proceeds to
43
Table of Contents
the extent that dividends exceeded earnings during such period. We have provided pro forma earnings per share information for 2013 that gives pro forma effect to the assumed issuance of a number of shares whose proceeds are deemed to be necessary to pay previous year’s dividends in excess of 2013 earnings ($ million), as well as adjustments to give pro forma effect to the Refinancing and settlement of Phantom SARs. See “Selected and pro forma consolidated financial data” found elsewhere in this prospectus for pro forma earnings per share information.
For additional information regarding our liquidity and outstanding indebtedness, see “Management’s discussion and analysis of financial condition and results of operations—Liquidity and capital resources.”
Certain affiliates of Goldman, Sachs & Co., an underwriter of this offering, hold a portion of our 12.5% Senior Notes, and it is expected that as a result of the Refinancing, they will receive more than 5% of the net proceeds of the offering. In addition, affiliates of TPG Capital BD, LLC, an underwriter of this offering, own in excess of 10% of our issued and outstanding common stock. As a result of the foregoing relationships, each of Goldman, Sachs & Co. and TPG Capital BD, LLC is deemed to have a “conflict of interest” within the meaning of FINRA Rule 5121, and this offering will be conducted in accordance with such rule. FINRA Rule 5121 requires that neither Goldman, Sachs & Co. nor TPG Capital BD, LLC make sales to discretionary accounts without the prior written approval of the account holder and that a qualified independent underwriter (“QIU”), as defined in FINRA Rule 5121, participate in the preparation of the registration statement of which this prospectus forms a part and exercise its usual standards of due diligence with respect thereto. J.P. Morgan Securities LLC has agreed to act as QIU for this offering. J.P. Morgan Securities LLC will not receive any additional fees for serving as QIU in connection with this offering. We have agreed to indemnify J.P. Morgan Securities LLC against certain liabilities incurred in connection with acting as QIU, including liabilities under the Securities Act or contribute to payments that the underwriters may be required to make in that respect.
44
Table of Contents
Following completion of the offering, our board of directors does not currently intend to pay dividends on our common stock. However, we expect to reevaluate our dividend policy on a regular basis following the offering and may, subject to compliance with the covenants contained in our credit facilities and other considerations, determine to pay dividends in the future. The declaration, amount and payment of any future dividends on shares of our common stock will be at the sole discretion of our board of directors, which may take into account general and economic conditions, our financial condition and results of operations, our available cash and current and anticipated cash needs, capital requirements, contractual, legal, tax and regulatory restrictions, the implications of the payment of dividends by us to our stockholders or by our subsidiaries to us, and any other factors that our board of directors may deem relevant. See “Management’s discussion and analysis of financial condition and results of operations—Liquidity and capital resources,” “Description of indebtedness” and Note 11 to our audited consolidated financial statements included elsewhere in this prospectus for restrictions on our ability to pay dividends.
In August 2013, our board of directors declared a cash dividend of $0.26 per share (or $753 million in the aggregate) to stockholders of record as of August 6, 2013.
45
Table of Contents
The following table sets forth our cash and cash equivalents and capitalization at December 31, 2013:
| • | on an actual basis; |
| • | on an as adjusted basis to give effect to (1) the issuance of shares of common stock by us in this offering and the receipt of approximately $ million in net proceeds from the sale of such shares, assuming an initial public offering price of $ per share, the midpoint of the price range set forth on the cover page of this prospectus, after deducting underwriting discounts and commissions and estimated offering expenses, (2) the Refinancing and (3) the application of the estimated net proceeds from the offering as described in “Use of proceeds.” |
You should read this table in conjunction with the information contained in “Use of proceeds,” “Selected pro forma and consolidated financial data” and “Management’s discussion and analysis of financial condition and results of operations,” as well as our consolidated financial statements and the related notes included elsewhere in this prospectus.
| As of December 31, 2013 |
||||||||
| (dollars in millions) | Actual | As adjusted (4)(5) |
||||||
|
|
||||||||
| Cash and cash equivalents |
$ | 725 | $ | |||||
|
|
|
|||||||
| Long-term debt, including current portions(1): |
||||||||
| Senior secured credit facilities: |
||||||||
| Term loan facility(2) |
2,777 | |||||||
| Revolving credit facility |
— | |||||||
| 12.5% Senior Notes |
1,000 | |||||||
| Senior PIK Notes |
750 | |||||||
| 6% Senior Notes |
500 | |||||||
|
|
|
|||||||
| Total debt |
5,027 | |||||||
|
|
|
|||||||
| Stockholders’ equity: |
||||||||
| Common stock, par value $0.001 per share; 3,075,000,000 shares authorized and 2,805,271,546 shares issued and outstanding on an actual basis, shares authorized and shares issued and outstanding on an as adjusted basis(3) |
3 | |||||||
| Additional paid-in capital |
913 | |||||||
| Accumulated deficit |
(20 | ) | ||||||
| Treasury stock |
(6 | ) | ||||||
| Accumulated other comprehensive loss |
(7 | ) | ||||||
|
|
|
|||||||
| Total stockholder’s equity |
883 | |||||||
|
|
|
|||||||
| Total capitalization |
$ | 5,910 | $ | |||||
|
|
||||||||
| (1) | Concurrent with the closing of this offering, we expect to effect the Refinancing. See “Use of proceeds.” |
| (2) | As presented on the face of our consolidated balance sheet, which is net of unamortized discounts of $67 million. |
| (3) | Does not include 189 million shares of common stock issuable upon exercise of stock options outstanding as of December 31, 2013 at a weighted average exercise price of $0.74 per share, or 32 million shares of common stock reserved for future issuance under our equity incentive plans as of , 2014. |
| (4) | As adjusted reflects the application of the estimated proceeds of the offering as described in “Use of proceeds.” |
46
Table of Contents
| (5) | A $1.00 increase (decrease) in the assumed initial public offering price of $ per share, the midpoint of the price range set forth on the cover of this prospectus, would increase (decrease) the as adjusted amount of each of cash and cash equivalents and total stockholders’ equity by approximately $ million after deducting underwriting discounts and commissions and estimated offering expenses payable by us. A share increase in the number of shares offered by us would increase the as-adjusted amount of each of cash and cash equivalents and total stockholders’ equity by approximately $ million after deducting underwriting discounts and commissions and any estimated offering expenses payable by us. Conversely a decrease in the number of shares offered by us would decrease the as-adjusted amount of each of cash and cash equivalents and total stockholders’ equity by approximately $ million after deducting underwriting discounts and commissions and any estimated offering expenses payable by us. |
47
Table of Contents
If you invest in our common stock in this offering, your interest will be diluted to the extent of the difference between the initial public offering price per share of our common stock in this offering and the pro forma as adjusted net tangible book value per share of our common stock after this offering. Dilution results from the fact that the initial public offering price per share of common stock is substantially in excess of the net tangible book deficit per share of our common stock attributable to the existing stockholders for our presently outstanding shares of common stock. Our net tangible book deficit per share represents the amount of our total tangible assets (total assets less intangible assets) less total liabilities, divided by the number of shares of common stock issued and outstanding.
As of December 31, 2013, we had a historical net tangible book deficit of $ million, or $ per share of common stock, based on shares of our common stock outstanding as of , 2014. Dilution is calculated by subtracting net tangible book deficit per share of our common stock from the assumed initial public offering price per share of our common stock.
Investors participating in this offering will incur immediate and substantial dilution. Without taking into account any other changes in such net tangible book deficit after December 31, 2013, after giving effect to the sale of shares of our common stock in this offering assuming an initial public offering price of $ per share (the midpoint of the offering range shown on the cover of this prospectus), less the underwriting discounts and commissions and estimated offering expenses payable by us, our pro forma net tangible book deficit as of December 31, 2013 would have been approximately $ million, or $ per share of common stock. This amount represents an immediate decrease in net tangible book deficit of $ per share of our common stock to the existing stockholders and immediate dilution in net tangible book deficit of $ per share of our common stock to investors purchasing shares of our common stock in this offering. The following table illustrates this dilution on a per share basis:
|
|
||||||||
| Assumed initial public offering price per share |
$ | |||||||
| Net tangible book deficit per share as of December 31, 2013, before giving effect to this offering |
$ | |||||||
| Decrease in net tangible book deficit per share attributable to investors purchasing shares in this offering |
||||||||
|
|
|
|||||||
| Pro forma net tangible book value per share, after giving effect to this offering |
||||||||
|
|
|
|||||||
| Dilution in as adjusted net tangible book deficit per share to investors in this offering |
$ | |||||||
|
|
||||||||
If the underwriters exercise their option in full to purchase additional shares, the pro forma as adjusted net tangible book deficit per share of our common stock after giving effect to this offering would be $ per share of our common stock. This represents an increase in pro forma as adjusted net tangible book deficit of $ per share of our common stock to existing stockholders and dilution in pro forma as adjusted net tangible book deficit of $ per share of our common stock to new investors.
Each $1.00 increase (decrease) in the assumed initial public offering price of $ per share would increase (decrease) the pro forma as adjusted net tangible book deficit per share of our common stock after giving effect to this offering by $ , or by $ per share of our common
48
Table of Contents
stock, assuming no change to the number of shares of our common stock offered by us as set forth on the front cover page of this prospectus and after deducting the estimated underwriting discounts and expenses payable by us. A share increase (decrease) in the number of shares offered by us would increase (decrease) the net proceeds to us from this offering by $ million (or approximately $ million if the underwriters exercise their option to purchase additional shares of common stock in full), assuming the aggregate offering price set forth on the cover page of this prospectus remains the same, and after deducting underwriting discounts and commissions and estimated offering expenses payable by us.
The following table summarizes, as of December 31, 2013, on the pro forma basis described above, the total number of shares of our common stock purchased from us, the total consideration paid to us, and the average price per share of our common stock paid by purchasers of such shares and by new investors purchasing shares of our common stock in this offering.
| Shares purchased | Total consideration | Average price per share |
||||||||||||||||
| Number | Percent | Amount | Percent | |||||||||||||||
|
|
||||||||||||||||||
| Existing stockholders |
% | $ | % | $ | ||||||||||||||
| New investors |
||||||||||||||||||
|
|
||||||||||||||||||
| Total |
100% | $ | 100% | $ | ||||||||||||||
|
|
||||||||||||||||||
The number of shares of common stock to be outstanding after this offering is based on shares of common stock outstanding as of , 2014 and excludes the following:
| • | shares of common stock issuable upon exercise of stock options outstanding as of , 2014 at a weighted average exercise price of $ per share; and |
| • | shares of common stock reserved for future issuance under our equity incentive plans as of , 2014. |
49
Table of Contents
Selected and pro forma consolidated financial data
You should read the following selected and pro forma consolidated financial data together with our financial statements and the related notes appearing at the end of this prospectus. The acquisition of IMS Health through the Merger resulted in a new basis of accounting. The term “Predecessor” refers to all periods related to the IMS Health business prior to and including the date of the closing of the Merger on February 26, 2010. We have derived the statement of comprehensive income (loss) and cash flow data for the year ended December 31, 2009 and for the period from January 1, 2010 to February 26, 2010 and the balance sheet data as of December 31, 2009 from our Predecessor’s audited consolidated financial statements not included in this prospectus. The term “Successor” refers to all periods from inception of IMS Health Holdings, Inc. (from October 23, 2009), which includes all periods of IMS Health after the closing of the Merger on February 26, 2010. We have derived the balance sheet data as of December 31, 2013 and 2012 and the statement of comprehensive income (loss) and cash flow data for each of the three years in the period ended December 31, 2013 from our Successor’s audited consolidated financial statements included elsewhere in this prospectus. We have derived the balance sheet data as of December 31, 2011 and 2010 from our Successor’s audited consolidated financial statements not included in this prospectus. We have derived the balance sheet data as of December 31, 2009 and the statement of comprehensive income (loss) and cash flow data for the period from October 23, 2009 to December 31, 2009 from our Successor’s unaudited consolidated financial statements not included in this prospectus.
Historical results are not necessarily indicative of the results to be expected for future periods. The following information should be read in conjunction with the sections entitled “Management’s discussion and analysis of financial condition and results of operations” and our financial statements and the notes thereto contained elsewhere in this prospectus.
50
Table of Contents
| (dollars in millions) |
Successor | Predecessor | ||||||||||||||||||||||||||
| Years ended December 31, |
October 23, 2009 through December 31, 2009 |
January 1, 2010 through February 26, 2010 |
Year ended December 31, |
|||||||||||||||||||||||||
| 2013 | 2012 | 2011 | 2010 | 2009 | ||||||||||||||||||||||||
|
|
||||||||||||||||||||||||||||
| Results of operations: |
||||||||||||||||||||||||||||
| Revenue |
$ | 2,544 | $ | 2,443 | $ | 2,364 | $ | 1,869 | $ | — | $ | 293 | $ | 2,190 | ||||||||||||||
| Information |
1,525 | 1,521 | 1,532 | 1,234 | 214 | 1,465 | ||||||||||||||||||||||
| Technology services |
1,019 | 922 | 832 | 635 | 79 | 725 | ||||||||||||||||||||||
| Costs and expenses(1) |
2,190 | 2,204 | 2,145 | 1,801 | 53 | 391 | 1,919 | |||||||||||||||||||||
|
|
|
|
|
|||||||||||||||||||||||||
| Operating income (loss) |
354 | 239 | 219 | 68 | (53 | ) | (98 | ) | 271 | |||||||||||||||||||
|
|
|
|
|
|||||||||||||||||||||||||
| Net income (loss) |
82 | $ | (42 | ) | $ | 111 | $ | (118 | ) | $ | (53 | ) | $ | (84 | ) | $ | 261 | |||||||||||
|
|
|
|
|
|||||||||||||||||||||||||
| As a % of revenue: |
||||||||||||||||||||||||||||
| Operating income (loss) |
13.9% | 9.8% | 9.3% | 3.6% | — | % | (33.4% | ) | 12.4% | |||||||||||||||||||
| Net income (loss) |
3.2% | (1.7% | ) | 4.7% | (6.3% | ) | — | % | (28.7% | ) | 11.9% | |||||||||||||||||
| Earnings (loss) per common share attributable to common shareholders: |
||||||||||||||||||||||||||||
| Basic earnings (loss) per share |
$ | 0.03 | $ | (0.02 | ) | $ | 0.04 | $ | (0.05 | ) | — | $ | (0.46 | ) | $ | 1.42 | ||||||||||||
| Diluted earnings (loss) per share |
0.03 | (0.02 | ) | 0.04 | (0.05 | ) | — | (0.46 | ) | 1.42 | ||||||||||||||||||
| Weighted average common shares outstanding: |
||||||||||||||||||||||||||||
| Basic |
2,800 | 2,795 | 2,788 | 2,348 | — | 183 | 182 | |||||||||||||||||||||
| Diluted |
2,870 | 2,795 | 2,793 | 2,348 | — | 183 | 183 | |||||||||||||||||||||
| Unaudited pro forma data(2): |
||||||||||||||||||||||||||||
| Net income |
||||||||||||||||||||||||||||
| Basic income per common share |
||||||||||||||||||||||||||||
| Diluted income per common share |
||||||||||||||||||||||||||||
| Weighted average common shares outstanding: |
||||||||||||||||||||||||||||
| Basic |
||||||||||||||||||||||||||||
| Diluted |
||||||||||||||||||||||||||||
| Balance sheet data: |
||||||||||||||||||||||||||||
| Shareholders’ equity (deficit) |
$ | 883 | $ | 1,683 | $ | 2,971 | $ | 2,813 | $ | (53 | ) | $ | 33 | $ | 72 | |||||||||||||
| Total assets |
7,999 | 8,215 | 8,358 | 8,220 | — | 2,018 | 2,223 | |||||||||||||||||||||
| Postretirement and postemployment benefits |
77 | 116 | 106 | 117 | — | 107 | 112 | |||||||||||||||||||||
| Long-term debt, deferred tax liability and other long-term liabilities |
6,107 | 5,573 | 4,488 | 4,555 | $ | — | 1,283 | 1,393 | ||||||||||||||||||||
|
|
||||||||||||||||||||||||||||
| (1) | Years ended 2013, 2012, 2011 and 2010 (Successor) and January 1, 2010 through February 26, 2010 (Predecessor) and year ended 2009 includes severance, impairment and other charges of $16, $48, $31, $54, ($13) and $144, respectively. Years ended 2013, 2012, 2011 and 2010 (Successor) and January 1, 2010 through February 26, 2010 (Predecessor) and year ended 2009 include merger costs of $—, $2, $23, $65, $45 and $11, respectively, related to the Merger. Refer to the notes to the consolidated financial statements for the year ended December 31, 2013, which are included elsewhere in this prospectus, for additional information regarding significant items impacting the consolidated statements of income during the three years ended December 31, 2013. |
| (2) | Pro forma earnings per share |
| We declared and paid dividends to our stockholders of $753 million during 2013. Dividends declared in the year preceding an initial public offering are deemed to be in contemplation of the offering with the intention of repayment out of offering proceeds to the extent that the dividends exceeded earnings during such period. Unaudited pro forma earnings per share for 2013 gives effect to the sale of the number of shares the proceeds of which would be necessary to (i) pay the dividend amount that is in excess of 2013 earnings, (ii) fund the repayment of the debt and related fees and expenses described in “Use of proceeds” and (iii) pay holders of Phantom SARs as described in “Use of proceeds,” up to the number of shares assumed to be issued in this offering. |
51
Table of Contents
| Additionally, unaudited pro forma earnings per share for 2013 gives effect to the reversal of interest expense relating to such debt, including the reversal of amortization related to debt issuance costs and discount. |
| For purposes of calculating unaudited pro forma earnings per share for 2013 we assumed shares are sold in this offering at a price of $ per share, the midpoint of the price range set forth on the cover page of this prospectus. |
The following presents the computation of pro forma basic and diluted earnings per share:
| Year ended December 31, 2013 |
||||
|
|
||||
| Numerator: |
||||
| Net income as reported |
$ | |||
| Pro forma adjustments: |
||||
| Interest expense, net of tax(a) |
||||
|
|
|
|||
| Pro forma net income |
$ | |||
|
|
|
|||
| Denominator: |
||||
| Weighted average common shares used in computing basic income per common share outstanding |
||||
| Adjustment for common stock issued whose proceeds will be used to pay dividends in excess of earnings(b) |
||||
| Adjustment for common shares used to repay outstanding indebtedness(c) |
||||
| Adjustment for common stock to pay holders of Phantom SARs(d) |
||||
| Pro forma weighted average common shares used in computing basic income per common share outstanding |
||||
|
|
|
|||
| Pro forma basic earnings per share |
$ | |||
|
|
|
|||
| Weighted average common shares used in computing diluted income per common share outstanding |
||||
| Diluted effect of securities |
||||
| Pro forma weighted average common shares used in computing diluted income per common share outstanding |
||||
|
|
|
|||
| Pro forma diluted earnings per share |
$ | |||
|
|
|
|||
|
|
|
|||
| (a) These adjustments reflect the elimination of the historical interest expense and amortization of debt issuance costs and discount after reflecting the effect of the Refinancing. |
||||
| (b) Dividends declared in the past twelve months |
$ | |||
| Net income attributable to IMS Health Holdings, Inc. in the past 12 months |
||||
|
|
|
|||
| Dividends paid in excess of earnings |
$ | |||
|
|
|
|||
| Offering price per common share |
$ | |||
|
|
|
|||
| Common shares assumed issued in this offering necessary to pay dividends in excess of earnings |
||||
| (c) Indebtedness to be repaid with proceeds from this offering |
$ | |||
|
|
|
|||
| Offering price per common share |
$ | |||
|
|
|
|||
| Common shares assumed issued in this offering to repay indebtedness |
||||
| (d) Number of Phantom SARs |
||||
| Excess of fair market value over exercise price |
||||
| Common shares assumed issued in this offering necessary to pay holders of Phantom SARs |
||||
52
Table of Contents
Management’s discussion and analysis of financial condition and results of operations
You should read the following discussion and analysis of our financial condition and results of operations together with our consolidated financial statements and the related notes included elsewhere in this prospectus. This discussion and analysis includes forward-looking statements that involve risks and uncertainties. You should read the “Cautionary note regarding forward-looking statements” and “Risk factors” sections of this prospectus for a discussion of important factors that could cause actual results to differ materially from the results described in or implied by the forward-looking statements contained in the following discussion and analysis. The terms “Company,” “IMS,” “we,” “our” or “us,” as used herein, refer to IMS Health Holdings, Inc. and its consolidated subsidiaries unless otherwise stated or indicated by context. Amounts presented may not add due to rounding.
Background
We are a leading global information and technology services company providing clients in the healthcare industry with comprehensive solutions to measure and improve their performance. We have one of the largest and most comprehensive collections of healthcare information in the world, spanning sales, prescription and promotional data, medical claims, electronic medical records and social media. We standardize, organize, structure and integrate this data by applying our sophisticated analytics and leveraging our global technology infrastructure to help our clients run their organizations more efficiently and make better decisions to improve their operational and financial performance. We have a presence in over 100 countries and we generated 63% of our 2013 revenue from outside the United States.
We serve key healthcare organizations and decision makers around the world, spanning the breadth of life science companies, including pharmaceutical, biotechnology, consumer health and medical device manufacturers, as well as distributors, providers, payers, government agencies, policymakers, researchers and the financial community. Our information and technology services offerings, which we have developed with significant investment over our 60-year history, are deeply integrated into our clients’ workflow.
On October 23, 2009, we were formed by investment entities affiliated with TPG Global, LLC, CPP Investment Board Private Holdings Inc. and Leonard Green & Partners, L.P. (collectively, the “Sponsors”). On February 26, 2010, we acquired 100% of the outstanding shares of IMS Health Incorporated (“IMS Health”) through our wholly owned subsidiary Healthcare Technology Acquisition, Inc., which we refer to as the Merger. We were formed for the purpose of consummating the Merger with IMS Health and had no operations from inception other than our investment in IMS Health and its subsidiaries and costs incurred associated with our formation and the Merger. The acquisition of IMS Health resulted in a new accounting basis.
On December 20, 2013, we changed our name from Healthcare Technology Holdings, Inc. to IMS Health Holdings, Inc.
53
Table of Contents
Outlook
The primary factors we expect to impact our results of operations in the near future are set forth below.
| • | We believe that we have opportunities to continue to grow revenue from our information offerings and technology services offerings. Revenue from technology services offerings has grown faster than our information offerings over the past three years and we expect this to continue for various reasons, including due to investments we have made in technology services offerings and significant expansion of our capabilities, growing client demand for new technology services solutions, and our estimate of the respective size of the untapped addressable market. Although margins are lower on our technology services offerings, we expect our overall operating margins to expand as we continue to benefit from our ability to control costs. We believe the integration of our information offerings and our technology services enable a differentiated value proposition for a client base in need of better solutions. We are in the early stages of penetration into the expanding opportunity we see within our global client base for our technology services offerings. |
| • | We also expect to benefit from growth in emerging markets, which we believe will continue to grow their healthcare spending over the next five years. Emerging markets currently represent 17% of our total revenue and have grown at an 11% constant dollar CAGR since 2010. We expect that revenue from these markets will grow at a faster rate than those in our mature markets. |
| • | We will also seek to grow through selective acquisitions in both existing markets and new markets that exhibit positive long-term fundamentals. Since the beginning of 2011, we have invested approximately $586 million of capital in 22 acquisitions. As the global healthcare landscape evolves, we expect that there will be a growing number of acquisition opportunities across the life sciences, payer and provider sectors. We will continue to invest in strategic acquisitions to grow our platform and enhance our ability to provide more products and services to our clients and expect to seek opportunities primarily in the areas of technological platforms, data suppliers and consulting services providers. |
Acquisitions
We completed several acquisitions during 2013, 2012 and 2011 to enhance our capabilities and offerings in certain areas, including technology services. During 2013, we acquired, at a total cost of approximately $129 million, Vedere Group Limited, Appature, Inc., Semantelli, LLC, 360 Vantage, LLC, Incential Software, Inc., Diversinet Corp., the consumer health business of Nielsen Holdings N.V. in certain European markets, HCM-BIOS, Pygargus AB and Amundsen Group, Inc. During 2012, we acquired, at a total cost of approximately $77 million, PharmARC Analytical Solutions Private Limited, Pharmadata s.r.o., Suomen Lääkedata Oy, DecisionView, Inc., Pharma Ventures Limited, Tar Heel Trading Company, LLC, Life Science Partners Pty Limited, Pharmexpert Group and Marina Consulting, LLC. In 2011, we acquired, at a total cost of approximately $380 million, Med-Vantage, Inc., Ardentia Limited and SDI Health LLC. See Note 4 to our consolidated financial statements found elsewhere in this prospectus for additional information with respect to these acquisitions. The results of operations of acquired businesses have been included since the date of acquisition and were not significant to our consolidated results of operations.
54
Table of Contents
Sources of revenue
Revenue is generated in each region through our local sales teams that manage client relationships within each region, reporting locally to country managers and up to regional managers. These sales teams go to market locally with our full suite of information and technology services offerings. Total global 2013 revenue from our information offerings represented 60% of our total revenue and primarily included revenue we earned from various information offerings developed to meet our clients’ needs by using data secured from a worldwide network of suppliers. Approximately 90% of our information revenue in each of the last three fiscal years came from subscription or license-based contracts and, as a result, historically this revenue has been recurring and predictable. Total global 2013 revenue from our technology services offerings represented 40% of our total revenue. Revenue from technology services consists of a mix of revenue from small and large-scale services and consulting projects, multi-year outsourcing contracts and software licenses. Approximately 35% of our technology services revenue in each of the last three fiscal years is recurring in nature, primarily driven by subscription and license-based contracts. Our information and technology services offerings complement each other and can provide enhanced value to our clients when delivered in an integrated fashion, with each driving demand for the other.
Costs and expenses
Our costs and expenses are comprised primarily of direct costs of revenue and selling and administrative expenses.
Our costs of revenue consist of operating costs of information and direct and incremental costs of technology services. Operating costs of information include costs attributable to personnel involved in production, data management and delivery, and the costs of acquiring and processing data for our information offerings. Our direct and incremental costs of our technology services offerings are comprised of costs of staff directly involved with delivering technology-related services offerings and engagements, related accommodations and the costs of data purchased specifically for technology services engagements. Direct and incremental costs of technology services do not include an allocation of direct costs of data that are included in operating costs of information as we do not have a meaningful way to allocate direct costs of data between information and technology services revenue. As a result, direct and incremental costs of technology services do not reflect the total costs incurred to deliver our technology services offerings.
Selling and administrative expenses consist primarily of expenses attributable to sales, marketing, and administration, including human resources, legal, finance and general management.
Results excluding the effects of foreign currency translation and certain charges
We report results in U.S. dollars, but we do business on a global basis. Exchange rate fluctuations affect the rate at which we translate foreign revenue and expenses into U.S. dollars and may have a significant effect on our results. The discussion of our business in this report sometimes describes the magnitude of changes in constant dollar terms. We believe this information facilitates comparison of results over time. During 2013, the U.S. dollar was generally stronger against the other currencies in which we transact business as compared to 2012. The revenue growth at actual currency rates was lower than the growth at constant dollar exchange rates. See
55
Table of Contents
“—How exchange rates affect our results” and “—Quantitative and qualitative disclosures about market risk” below for a more complete discussion regarding the impact of foreign currency translation on our business.
We also discuss below our revenue, operating income (loss), operating costs of information offerings, direct and incremental costs of technology services offerings, selling and administrative expenses and operating margins excluding restructuring and related charges, merger costs, purchase accounting adjustments, non-cash stock-based compensation charges, acquisition-related charges and sponsor monitoring fees. We believe providing these non-GAAP measures is useful as it facilitates comparisons across the periods presented and more clearly indicates trends. Management uses these non-GAAP measures in its global decision making, including developing budgets and managing expenditures.
Results of operations
Summary operating results for the years ended December 31, 2013, 2012 and 2011
| (dollars in millions) | Year ended December 31, |
|||||||||||
| 2013 | 2012 | 2011 | ||||||||||
|
|
||||||||||||
| Revenue |
$ | 2,544 | $ | 2,443 | $ | 2,364 | ||||||
|
|
|
|
|
|||||||||
| Information |
1,525 | 1,521 | 1,532 | |||||||||
| Technology services |
1,019 | 922 | 832 | |||||||||
|
|
|
|
|
|||||||||
| Operating costs of information, exclusive of depreciation and amortization |
648 | 675 | 698 | |||||||||
| Direct and incremental costs of technology services, exclusive of depreciation and amortization |
520 | 476 | 396 | |||||||||
| Selling and administrative expenses, exclusive of depreciation and amortization |
596 | 579 | 604 | |||||||||
| Depreciation and amortization |
410 | 424 | 393 | |||||||||
| Severance, impairment and other charges |
16 | 48 | 31 | |||||||||
| Merger costs |
— | 2 | 23 | |||||||||
|
|
|
|
|
|||||||||
| Operating income |
354 | 239 | 219 | |||||||||
|
|
|
|
|
|||||||||
| Interest income |
4 | 4 | 3 | |||||||||
| Interest expense |
(332) | (275 | ) | (277 | ) | |||||||
| Other loss, net |
(74) | (29 | ) | (7 | ) | |||||||
|
|
|
|
|
|||||||||
| Non-operating loss, net |
(402) | (300 | ) | (281 | ) | |||||||
|
|
|
|
|
|||||||||
| Loss before benefit from income taxes |
(48) | (61 | ) | (62 | ) | |||||||
| Benefit from income taxes |
130 | 19 | 173 | |||||||||
|
|
|
|
|
|||||||||
| Net income (loss) |
$ | 82 | $ | (42 | ) | $ | 111 | |||||
|
|
||||||||||||
Net income (loss) to Adjusted EBITDA reconciliation
We have included a presentation of Adjusted EBITDA because we believe it provides additional information to measure our performance and evaluate our ability to service our debt. In addition, management believes that Adjusted EBITDA is a useful financial metric to assess our operating performance from period to period by excluding certain material non-cash items, unusual or non-
56
Table of Contents
recurring items that we do not expect to continue in the future and certain other adjustments we believe are not reflective of our ongoing operations and our performance. Adjusted EBITDA is not a presentation made in accordance with U.S. GAAP, and our computation of Adjusted EBITDA may vary from others in our industry. Adjusted EBITDA should not be considered to be an alternative to net income, a measure of operating performance or cash flow or a measure of liquidity. Adjusted EBITDA has limitations as an analytical tool, and it should not be considered in isolation, or as a substitute for analysis of our results as reported under U.S. GAAP.
| Year ended December 31, |
||||||||||||
| (dollars in millions) | 2013 | 2012 | 2011 | |||||||||
|
|
||||||||||||
| Net income (loss) |
$ | 82 | $ | (42 | ) | $ | 111 | |||||
| Deferred revenue purchase accounting adjustments |
2 | 7 | 7 | |||||||||
| Non-cash stock-based compensation charges |
22 | 19 | 18 | |||||||||
| Restructuring and related charges(1) |
23 | 54 | 39 | |||||||||
| Acquisition-related charges |
10 | 11 | 13 | |||||||||
| Sponsor monitoring fees |
8 | 8 | 9 | |||||||||
| Depreciation and amortization |
410 | 424 | 393 | |||||||||
| Merger costs |
— | 2 | 23 | |||||||||
| Interest income |
(4) | (4 | ) | (3 | ) | |||||||
| Interest expense |
332 | 275 | 277 | |||||||||
| Other loss, net |
74 | 29 | 7 | |||||||||
| Benefit from income taxes |
(130) | (19 | ) | (173 | ) | |||||||
|
|
|
|
|
|||||||||
| Adjusted EBITDA |
$ | 829 | $ | 764 | $ | 721 | ||||||
|
|
||||||||||||
| (1) | Restructuring and related charges includes severance and impairment charges and the cost of employee and third-party charges related to dual running costs for knowledge transfer activities. |
Revenue
Total revenue grew 4.2% to $2,544 million in 2013 compared to $2,443 million in 2012, or 6.1% on a constant dollar basis. Revenue from our information offerings increased slightly and grew 2.6% on a constant dollar basis in 2013. Revenue from our technology services offerings grew 10.5% and grew 11.3% on a constant dollar basis in 2013. Excluding the impacts of foreign currency translation of $56 million and $7 million in 2013 and 2012, respectively, and deferred revenue purchase accounting adjustments of $2 million and $7 million in 2013 and 2012, respectively, total revenue grew 5.9% on a constant dollar basis for 2013. Growth in the Americas and Asia Pacific regions contributed approximately three-fourths of our total revenue growth during 2013 compared to 2012. The constant dollar increase in information offerings was driven by growth in Latin America and Asia, partially offset by a decline in Canada. The constant dollar increase in technology services offerings was driven by increases in commercial services throughout all of our geographies, with the largest contributions coming from the U.S. and Japan.
Total revenue grew 3.3% to $2,443 million in 2012 compared to $2,364 million in 2011, or 5.9% on a constant dollar basis. Revenue from information offerings declined 0.7%, and grew 2.7% on a constant dollar basis in 2012. Revenue from our technology services offerings grew 10.8% and grew 13.3% on a constant dollar basis in 2012. Excluding the impacts of foreign currency translation of $7 million and $52 million in 2012 and 2011, respectively, and deferred revenue purchase accounting adjustments of $7 million in both 2012 and 2011, total revenue grew 5.9% on a constant dollar basis for 2012. The growth in total revenue in 2012 was largely attributable to the increase in revenue from technology services. The constant dollar increase in information
57
Table of Contents
offerings was driven by growth in the U.S., Latin America and Asia, partially offset by declines in Canada and Central Europe. Additionally, the majority of the 2012 growth in our technology services offerings, on a constant dollar basis and otherwise, was driven by our acquisition of a healthcare market insights and analytics firm based in the U.S., which was completed in the fourth quarter of 2011 (the “SDI acquisition”).
Operating costs of information, exclusive of depreciation and amortization
Operating costs of information includes costs attributable to personnel involved in production, data management and delivery, and the costs of acquiring and processing data for our information offerings.
Operating costs of information offerings declined $27 million, or 4.0%, in 2013 compared to 2012. Excluding the effect of foreign currency translation of negative $11 million, non-cash stock-based compensation charges and restructuring and related charges, operating costs of information decreased 2.7%. The constant dollar decline in operating costs of information was primarily due to reductions in compensation costs of $8 million and in third-party professional services costs of $13 million resulting from our continuing restructuring efforts and the shift to our low cost production hubs, and lower occupancy costs of $10 million, partially offset by an increase in headcount of approximately 400 employees and normal annual merit salary increases.
Operating costs of information offerings declined $23 million, or 3.3%, in 2012 compared to 2011. Excluding the effect of foreign currency translation of negative $19 million, non-cash stock-based compensation charges and restructuring and related charges, operating costs of information decreased 1.4% in 2012 compared to 2011. The constant dollar decline in operating costs of information was primarily due to reductions in compensation costs and in third-party professional services costs of $13 million resulting from our restructuring efforts and the continuing shift to our low cost production hubs, partially offset by normal annual merit salary increases.
Direct and incremental costs of technology services, exclusive of depreciation and amortization
Direct and incremental costs of technology services offerings include costs of staff directly involved with delivering those offerings and engagements, related accommodations, and the costs of data purchased specifically for technology services engagements. Direct and incremental costs of technology services do not include an allocation of direct costs of data that are included in operating costs of information.
Direct and incremental costs of technology services offerings grew $44 million, or 9.3%, in 2013 compared to 2012. Excluding the effect of foreign currency translation of negative $6 million and non-cash stock-based compensation charges, direct and incremental costs of technology services grew 10.3% in 2013 compared to 2012. The constant dollar increase in direct and incremental costs of technology services was driven primarily by increased compensation costs of $59 million, including approximately 700 more employees in 2013, to support the growth in our technology services revenue.
Direct and incremental costs of technology services offerings grew $80 million, or 20.2%, in 2012 compared to 2011. Excluding the effect of foreign currency translation of negative $9 million and non-cash stock-based compensation charges, direct and incremental costs of technology services
58
Table of Contents
grew 22.8% in 2012 compared to 2011. The constant dollar increase in direct and incremental costs of technology services was due to higher compensation and data costs of $63 million and $16 million, respectively, primarily resulting from the SDI acquisition completed in the fourth quarter of 2011. Headcount increased by approximately 900 employees in 2012.
Selling and administrative expenses, exclusive of depreciation and amortization
Selling and administrative expenses consist primarily of expenses attributable to sales, marketing, and administration, including human resources, legal, finance, and general management.
Selling and administrative expenses grew $17 million, or 2.9%, for 2013 compared to 2012. Excluding the effect of foreign currency translation of negative $10 million, non-cash stock-based compensation charges, acquisition-related charges and sponsor monitoring fees, selling and administrative expenses grew 4.9% in 2013 compared to 2012. The constant dollar increase in selling and administrative expenses was primarily due to increases in compensation of $42 million resulting from normal annual merit salary increases, higher selling and administrative headcount of approximately 500 employees from recently completed acquisitions and increased sales staff to drive revenue.
Selling and administrative expenses decreased $25 million, or 4.1%, in 2012 compared to 2011. Excluding the effect of foreign currency translation of negative $12 million, non-cash stock-based compensation charges, acquisition-related charges and sponsor monitoring fees, selling and administrative expenses decreased 0.7% in 2012 compared to 2011. The constant dollar decrease in selling and administrative expenses was due to reductions in third-party professional service expenses of approximately $3 million, partially offset by increases in compensation resulting from normal annual merit increases and the SDI acquisition completed in the fourth quarter of 2011.
Depreciation and amortization
Depreciation and amortization charges decreased $14 million, or 3.3%, in 2013 compared to 2012 primarily due to the absence of depreciation in 2013 for assets related to an impaired property lease recorded at the end of the third quarter of 2012.
Depreciation and amortization charges increased $31 million, or 7.9%, in 2012 compared to 2011. The 2012 increase was primarily due to higher intangible assets from completed acquisitions.
Severance, impairment and other charges
Severance, impairment and other charges in 2013 were $16 million, comprised of $12 million of severance and $3 million for an impaired lease for a property in the U.S., both of which were recorded in the fourth quarter of 2013, and $4 million related to impaired leases for properties in the U.S. and $3 million for contract-related charges for which we will not realize any future economic benefits. These charges were partially offset by the reversal of approximately $6 million of severance accruals for terminations recorded in 2012 due to the favorable settlement of required termination benefits and strategic business changes.
Severance, impairment and other charges in 2012 were $48 million, comprised of $23 million of severance, $23 million related to the write-down of certain assets to their net realizable values, $4 million for contract-related charges for which we did not realize any future economic benefits and $9 million for the exit of leased facilities in the U.S. and Europe. Approximately $29 million
59
Table of Contents
of these charges were recorded in the fourth quarter of fiscal 2012. These charges were partially offset by reversals of approximately $11 million in the fourth quarter of 2012 of severance accruals related to termination benefits recorded in 2010.
Severance, impairment and other charges in 2011 were $31 million, comprised of $33 million of severance, $10 million for contract-related charges for which we did not realize any future economic benefits and $2 million for the exit of leased facilities in the U.S. Approximately $35 million of these charges were recorded in the fourth quarter of fiscal 2011. These charges were partially offset by reversals of approximately $14 million in the fourth quarter of 2011 of severance accruals related to termination benefits recorded in 2010.
See Note 6 to our consolidated financial statements for the year ended December 31, 2013 included elsewhere in this prospectus.
Merger costs
We incurred $2 million and $23 million in 2012 and 2011, respectively, for employment contract related payments as a result of the Merger. There were no merger costs recorded in 2013. See Note 4 to our consolidated financial statements for the year ended December 31, 2013 included elsewhere in this prospectus.
Operating income
Operating income grew $115 million, or 48.0%, in 2013 compared to 2012. This increase was due to the revenue growth discussed above and decreases in operating costs of information offerings of $27 million, depreciation and amortization of $14 million and severance, impairment and other charges of $32 million, partially offset by increases in direct and incremental costs of technology services offerings of $44 million and selling and administrative expenses of $17 million. Operating income for 2013 increased $130 million in constant dollar terms. Absent the impact of restructuring and related charges, merger costs, purchase accounting adjustments, non-cash stock-based compensation charges, acquisition-related charges and sponsor monitoring fees, operating income for 2013 grew 22.5% at reported foreign currency rates and 26.5% on a constant dollar basis.
Operating income grew $20 million, or 9.1%, in 2012 compared to 2011. This increase was due to the revenue growth discussed above and decreases in operating costs of information offerings of $23 million, selling and administrative expenses of $25 million and merger costs of $21 million, partially offset by increases in direct and incremental costs of technology services offerings of $80 million, depreciation and amortization of $31 million and severance, impairment and other charges of $17 million. Operating income for 2012 increased 19.2% in constant dollar terms. Absent the impact of restructuring and related charges, merger costs, purchase accounting adjustments, non-cash stock-based compensation charges, acquisition-related charges and sponsor monitoring fees, operating income for 2012 declined 7.5% at reported rates and 2.7% on a constant dollar basis.
Trends in our operating margins
Operating margins were 13.9%, 9.8% and 9.3% in 2013, 2012 and 2011, respectively. Margins were negatively impacted by restructuring and related charges, merger costs, purchase accounting adjustments, non-cash stock-based compensation charges, acquisition-related charges
60
Table of Contents
and sponsor monitoring fees. Excluding these charges, operating margin was 25.7%, 21.8% and 24.4% in 2013, 2012 and 2011, respectively.
Non-operating loss, net
Non-operating losses increased $102 million, or 33.8%, in 2013 compared to 2012. The increase was due to higher net interest expense of $57 million resulting from higher debt balances in 2013, higher net foreign exchange losses of $33 million, which included a $14 million loss in 2013 from the devaluation of the Venezuelan Bolívar (“Bolívars”), and $12 million of debt extinguishment expenses and third-party fees related to the amendment of our term loan in February 2013.
Non-operating losses increased 6.8% in 2012 compared to 2011. The $19 million increase in non-operating losses in 2012 was driven by higher net foreign exchange losses of $20 million in 2012 compared to 2011.
Taxes
We operate in more than 100 countries around the world and our earnings are taxed at the applicable income tax rate in each of these countries. As required, we compute interim taxes based on an estimated annual effective tax rate.
During the fourth quarter of 2013, we restructured our foreign operations and integrated our U.K., Spain and Austria businesses under our main European holding company in Switzerland. The restructuring significantly affected the book over tax basis differences among group members and the ultimate worldwide tax cost of a theoretical recognition of such differences. As a result, the associated deferred tax liability was reduced by approximately $86 million as of December 31, 2013.
In 2013, our effective tax rate was favorably impacted by a tax reduction of $10 million as a result of the conclusion of U.S. audits. In connection with one of the audits, we received a $47 million refund for which a receivable had been previously established. We also recorded tax reductions of $5 million as a result of the expiration of various statutes of limitation and $2 million for the reversal of a valuation allowance due to a change in enacted state tax law changes. We recorded a tax charge of $2 million for interest and penalties related to unrecognized tax benefits. As of December 31, 2013, we had $38 million of unrecognized tax benefits that if recognized would favorably affect the effective tax rate and $11 million of interest and penalties associated with unrecognized tax benefits.
In 2012, our effective tax rate was favorably impacted by a reduction of $7 million to deferred tax liability and a tax reduction of $5 million as a result of the expiration of certain statutes of limitation. We recorded a tax charge of $3 million for interest and penalties related to unrecognized tax benefits. As of December 31, 2012, we had $39 million of unrecognized tax benefits that if recognized would favorably affect the effective tax rate and $10 million of interest and penalties associated with unrecognized tax benefits.
During the fourth quarter of 2011, we restructured our foreign operations to integrate our German operating group subsidiaries under our main European holding company in Switzerland. The restructuring significantly affected the book over tax basis differences among group
61
Table of Contents
members and the ultimate worldwide tax cost of a theoretical recognition of such differences. As a result, the associated deferred tax liability was reduced by approximately $170 million as of December 31, 2011.
Additionally, we recorded in 2011 a tax charge of $6 million associated with the impact of the merger and a tax charge of $3 million for interest and penalties related to unrecognized tax benefits. As of December 31, 2011, we had $41 million of unrecognized tax benefits that if recognized would favorably affect the effective tax rate and $9 million of interest and penalties associated with unrecognized tax benefits.
We file numerous consolidated and separate income tax returns in U.S. (federal and state) and non-U.S. jurisdictions. We are no longer subject to U.S. federal income tax examination by tax authorities for years before 2010. With few exceptions, we are no longer subject to tax examination in state and local jurisdictions for years prior to 2009 and in its material non-U.S. jurisdictions prior to 2007. It is reasonably possible that within the next twelve months we could realize $3 million of unrecognized tax benefits as a result of the expiration of certain statutes of limitation.
For all years presented, our effective tax rate was reduced as a result of global tax planning initiatives. While we intend to continue to seek global tax planning initiatives, there can be no assurance that we will be able to successfully identify and implement such initiatives to reduce or maintain our overall tax rate.
Operating results by geographic region
The following represents selected geographic information for the regions in which we operate for the periods and dates indicated below.
| (dollars in millions) | Americas(1) | EMEA(2) | Asia Pacific(3) |
Corporate and Other |
Total IMS | |||||||||||||||
|
|
||||||||||||||||||||
| Year ended December 31, 2013: |
||||||||||||||||||||
| Revenue(4) |
$ | 1,160 | $ | 936 | $ | 448 | $ | — | $ | 2,544 | ||||||||||
| Operating income (loss)(5) |
304 | 248 | 146 | (344 | ) | 354 | ||||||||||||||
| Total assets at December 31, 2013 |
4,065 | 2,383 | 1,333 | 218 | 7,999 | |||||||||||||||
| Year ended December 31, 2012: |
||||||||||||||||||||
| Revenue(4) |
$ | 1,096 | $ | 891 | $ | 456 | $ | — | $ | 2,443 | ||||||||||
| Operating income (loss)(5) |
293 | 217 | 161 | (432 | ) | 239 | ||||||||||||||
| Total assets at December 31, 2012 |
3,862 | 2,283 | 1,635 | 435 | 8,215 | |||||||||||||||
| Year ended December 31, 2011: |
||||||||||||||||||||
| Revenue(4) |
$ | 1,013 | $ | 915 | $ | 436 | $ | — | $ | 2,364 | ||||||||||
| Operating income (loss)(5) |
286 | 252 | 146 | (465 | ) | 219 | ||||||||||||||
| Total assets at December 31, 2011 |
4,034 | 2,223 | 1,765 | 336 | 8,358 | |||||||||||||||
|
|
||||||||||||||||||||
In 2013, we made some changes to our geographic reporting classifications to move some functions from corporate and other to the geographic regions and as a result, reclassifications of prior years’ geographic financial information were made to conform to the current year presentation. The reclassifications did not change previously reported consolidated results of operations or financial position. See Note 15 to our consolidated financial statements for further information.
| (1) | Our Americas region includes the United States, Canada and Latin America. Revenue in the U.S. was $935 million, $885 million and $808 million for the years ended December 31, 2013, 2012 and 2011, respectively. Total U.S. assets were $3,837 million, $3,638 million and $3,821 million at December 31, 2013, 2012 and 2011, respectively. |
| (2) | Our EMEA region includes countries in Europe, the Middle East and Africa. |
62
Table of Contents
| (3) | Our Asia Pacific region includes Japan, Australia and other countries in the Asia Pacific region. Revenue in Japan was $261 million, $286 million and $277 million for the years ended December 31, 2013, 2012 and 2011, respectively. |
| (4) | Revenue relates to external clients and is primarily based on the location of the client. Revenue for the geographic regions includes the impact of foreign exchange in translating results into U.S. dollars. |
| (5) | Operating Income for the three geographic regions does not reflect the allocation of certain expenses that are maintained in Corporate and Other and as such, is not a true measure of the respective regions’ profitability. The Operating Income amounts for the geographic regions include the impact of foreign exchange in translating results into U.S. dollars. For 2013, depreciation and amortization related to purchase accounting adjustments of $126 million, $87 million and $42 million for the Americas, EMEA and Asia Pacific regions, respectively, are presented in Corporate and Other. For 2012, depreciation and amortization related to purchase accounting adjustments of $126 million, $84 million and $51 million for the Americas, EMEA and Asia Pacific regions, respectively, are presented in Corporate and Other. For 2011, depreciation and amortization related to purchase accounting adjustments of $126 million, $91 million and $52 million for the Americas, EMEA and Asia Pacific regions, respectively, are presented in Corporate and Other. |
Americas region
Revenue in the Americas region grew 5.9% in 2013 compared to 2012. On a constant dollar basis, revenue grew 6.9% in 2013 compared to 2012. The constant dollar increase in the Americas was the driven primarily by continued strong revenue growth in technology services offerings, which accounted for approximately $57 million of the increase. Revenue in the Americas region grew 8.2% in 2012 compared to 2011. On a constant dollar basis, revenue grew 8.9% in 2012 compared to 2011. The growth in 2012 was primarily due to the impact of the technology services offerings from the SDI acquisition completed in the fourth quarter of 2011.
Operating income in the Americas region grew 3.9% in 2013 compared to 2012. On a constant dollar basis, operating income grew 5.7% in 2013 compared to 2012. The increase in operating income in 2013 was a result of revenue growth in the region, partially offset by increases in operating expenses of $53 million required to support the revenue growth. Operating income in the Americas region grew 2.5% in 2012 compared to 2011. On a constant dollar basis, operating income grew 3.5% in 2012 compared to 2011. The constant dollar operating income growth in 2012 was a result of revenue growth in technology services offerings, partially offset by increases in operating expenses of $76 million, both primarily due to the SDI acquisition.
EMEA region
Revenue in the EMEA region grew 5.1% in 2013 compared to 2012. On a constant dollar basis, revenue grew 3.4% in 2013 compared to 2012. The constant dollar increase in revenue in EMEA was the result of strong overall growth in Eastern Europe as well as growth in our technology services offerings, particularly in Central and Northern Europe. Revenue in the EMEA region declined by 2.7% in 2012 compared to 2011. On a constant dollar basis, revenue grew 3.1% in 2012 compared to 2011. The constant dollar increase in revenue in EMEA was driven by 4.7% revenue growth in North Europe.
Operating income in the EMEA region grew 14.3% in 2013 compared to 2012. On a constant dollar basis, operating income grew 10.8% in 2013 compared to 2012. The increase in constant dollar operating income in 2013 was a result of revenue growth in the region, partially offset by increases in operating expenses of $14 million. Operating income in the EMEA region declined 13.9% in 2012 compared to 2011. On a constant dollar basis, operating income declined 5.4% in 2012 compared to 2011. The operating income decline in 2012 was a result of the revenue decrease noted above and increases in operating expenses of $11 million.
63
Table of Contents
Asia Pacific region
Revenue in the Asia Pacific region declined 1.8% in 2013 compared to 2012. On a constant dollar basis, revenue grew 9.6% in 2013 compared to 2012. The constant dollar increase in revenue was driven by overall growth in Japan and China. Revenue in the Asia Pacific region grew 4.5% in 2012 compared to 2011. On a constant dollar basis, revenue grew 4.9% in 2012 compared 2011. The constant dollar increase in revenue in 2012 was driven by gains in Japan and strong overall growth in China.
Operating income in the Asia Pacific region declined 9.1% in 2013 compared to 2012. On a constant dollar basis, operating income grew 10.3% in 2013 compared to 2012. The increase in constant dollar operating income in 2013 was a result of the revenue increase, partially offset by increases in operating expenses of $6 million due to continued investments in the region to drive growth. Operating income in the Asia Pacific region grew 9.6% in 2012 compared 2011. On a constant dollar basis, operating income grew 10.8% in 2012, due principally to revenue growth in the region, partially offset by increases in operating expenses of $5 million.
How exchange rates affect our results
We operate globally, deriving a significant portion of our operating income from non-U.S. operations. As a result, fluctuations in the value of foreign currencies in which we transact business relative to the U.S. dollar may increase the volatility of U.S. dollar operating results. We enter into foreign currency forward contracts to partially offset the effect of currency fluctuations and the impact of these forward contracts is reflected in other loss, net on the consolidated statements of comprehensive (loss) income. In 2013, foreign currency translation decreased our U.S. dollar revenue and operating income growth by approximately 1.9 and 6.9 percentage points, respectively. In 2012, foreign currency translation decreased the U.S. dollar revenue and operating income growth by approximately 3.0 and 10.1 percentage points, respectively.
Non-U.S. monetary assets are maintained in currencies other than the U.S. dollar, principally the Euro and the Japanese Yen. Where monetary assets are held in the functional currency of the local entity, changes in the value of these currencies relative to the U.S. dollar are reflected in accumulated other comprehensive income in the consolidated statements of financial position. The effect of exchange rate changes during 2013 decreased the U.S. dollar amount of cash and cash equivalents by $23 million. The effect of exchange rate changes increased the U.S. dollar amount of cash and cash equivalents by $0.4 million and $2 million during 2012 and 2011, respectively.
Liquidity and capital resources
Cash and cash equivalents increased $145 million to $725 million at December 31, 2013 compared to $580 million at December 31, 2012. The increase reflects cash provided by operating activities of $400 million, partially offset by cash used in investing and financing activities of $180 million and $52 million, respectively, and a decrease of $23 million due to the effect of exchange rate changes.
Cash and cash equivalents increased $127 million to $580 million at December 31, 2012 compared to $453 million at December 31, 2011. The increase reflects cash provided by operating activities of $399 million, partially offset by cash used in investing activities and financing activities of $209 million and $63 million, respectively.
64
Table of Contents
At December 31, 2013, short-term investments totaled $4 million, which consisted of government bond funds with maturities greater than 90 days, but less than one year.
Over the next twelve months we currently expect that we will use our cash and cash equivalents primarily to fund:
| • | principal and interest payments of approximately $390 million; |
| • | development of software to be used in our new products and capital expenditures of $170 million to $180 million to expand and upgrade our information technology capabilities and to build or acquire facilities to house our business—this includes approximately $60 million of one-time capital expenditures related to the planned purchase of an office building in India; |
| • | payments of approximately $22 million related to our employee severance plans; |
| • | pension and other postretirement benefit plan contributions of approximately $16 million; and |
| • | acquisitions. |
Cash flows
Net cash provided by operating activities amounted to $400 million for the year ended December 31, 2013, essentially flat when compared to the year ended December 31, 2012. Cash flows from operating activities for 2013 reflects higher cash-related net income and lower professional fees and severance payments in 2013, almost entirely offset by higher funding of accounts payable, higher pension contributions and lower funding of other current assets in 2013 compared to 2012. Net cash provided by operating activities was $399 million for the year ended December 31, 2012, an increase of $65 million compared to the year ended December 31, 2011. The increase relates to lower funding of prepaid expenses and other current assets, lower restructuring payments and lower pension funding.
Net cash used in investing activities amounted to $180 million for the year ended December 31, 2013, a decrease in cash used of $29 million compared to the year ended December 31, 2012. The decrease relates to higher proceeds received from sales of short-term investments, net of purchases, in 2013, partially offset by higher payments for acquisitions, lower proceeds from the sale of assets and higher additions to computer software in 2013 compared to 2012. Net cash used in investing activities was $209 million for the year ended December 31, 2012, a decrease of $276 million compared to the year ended December 31, 2011. The decrease relates to lower payments for acquisitions during 2012 largely due to the SDI acquisition in the fourth quarter of 2011, higher proceeds from the sale of assets in 2012, and a decrease in computer software additions during 2012, partially offset by increases in short-term investments and facility-related capital expenditures during 2012.
Net cash used in financing activities amounted to $52 million for the year ended December 31, 2013, a decrease in cash used of $11 million compared to the year ended December 31, 2012. The decrease relates to lower dividends paid to shareholders and lower repayments, net of borrowings, of our revolving credit facility in 2013, partially offset by lower proceeds from issuance of debt in 2013 compared to 2012. Net cash used in financing activities was $63 million for the year ended December 31, 2012, an increase of $169 million compared to cash provided during the year ended December 31, 2011. The increase relates to the dividend paid to shareholders during the fourth quarter of 2012, higher repayments of our revolving credit facility and term loans during 2012, and higher debt issuance costs during 2012, partially offset by
65
Table of Contents
higher proceeds from new borrowings during 2012. The dividend and higher borrowings and debt issuance costs relate to our recapitalization transaction which was completed during the fourth quarter of 2012. See Note 7 to our consolidated financial statements for the year ended December 31, 2013 included elsewhere in this prospectus.
Liquidity in the capital and credit markets
Overview
We fund our liquidity needs for capital investment, working capital, and other financial commitments through cash flow from continuing operations and our credit facility ($375 million in aggregate commitments, all of which was available as of December 31, 2013). We believe that we have the financial resources to meet business requirements for the next twelve months and for our long-term needs.
Credit concentrations
We continually monitor our positions with, and the credit quality of, the financial institutions that are counterparties to our financial instruments and do not anticipate non-performance by the counterparties. In general, we enter into transactions only with financial institution counterparties that are large banks and financial institutions. In addition, we attempt to limit the amount of credit exposure with any one institution. We would not have realized a material loss during the year ended December 31, 2013 in the event of non-performance by any one counterparty. Management continues to monitor the status of these counterparties and will take action, as appropriate, to manage any counterparty credit risk.
We maintain accounts receivable balances ($313 million and $308 million, net of allowances, at December 31, 2013 and 2012, respectively), principally from clients in the pharmaceutical industry. Our trade receivables do not represent significant concentrations of credit risk at December 31, 2013 due to the credit worthiness of our clients and their dispersion across many geographic areas.
Debt
At December 31, 2013, our principal amount of debt totaled $5,027 million. Management does not believe that this level of debt poses a material risk to us due to the following factors:
| • | in each of the last two calendar years, we have generated strong net cash provided by operating activities of approximately $400 million; |
| • | at December 31, 2013, we had $729 million in worldwide cash and cash equivalents and short-term investments; and |
| • | at December 31, 2013, we had $375 million of unused debt capacity under our existing Senior Secured Credit Facilities. |
66
Table of Contents
The following table summarizes our debt at the dates indicated:
| December 31, | ||||||||
| (dollars in millions) | 2013 | 2012 |
||||||
|
|
||||||||
|
Senior Secured Term Loan due 2017—USD LIBOR at average floating rates of 3.75% |
$ | 1,747 | $ | 1,766 | ||||
| Senior Secured Term Loan due 2017—EUR LIBOR at average floating rates of 4.25% |
1,030 | 999 | ||||||
| 12.50% Senior Notes due 2018 |
1,000 | 1,000 | ||||||
| 7.375%/8.125% Senior PIK Toggle Notes due 2018 |
750 | — | ||||||
| Revolving Credit Facility due 2017—USD LIBOR at average floating rates |
— | — | ||||||
| 6.00% Senior Notes due 2020 |
500 | 500 | ||||||
|
|
|
|||||||
| Principal Amount of Debt |
5,027 | 4,265 | ||||||
| Less: Unamortized Discounts |
(67 | ) | (88 | ) | ||||
|
|
|
|||||||
| Total Debt |
$ | 4,960 | $ | 4,177 | ||||
|
|
||||||||
In August 2013, we issued $750 million of Senior PIK Notes. The Senior PIK Notes are unsecured obligations and mature on September 1, 2018. Interest is paid semi-annually in March and September of each year, commencing March 1, 2014. Subject to certain restrictions, we may elect to pay a portion of the interest due on the outstanding principal amount of the Senior PIK Notes by issuing PIK Notes in a principal amount equal to the interest due. The proceeds, along with cash provided by us, were used to pay an approximate $753 million dividend to our shareholders and for the payment of fees and expenses of the transaction of approximately $17 million.
In February 2013, we entered into an amendment of our existing Senior Secured Term
Loans due 2017 (“Term Loan Amendment”) to reduce our interest rate. We reduced the borrowing margins and LIBOR floors by 50 basis points and 25 basis points, respectively, for both the USD and EUR tranches of debt. As a result of the Term Loan Amendment, we recorded $9 million of debt extinguishment losses and $3 million of third party fees in Other loss, net during the year ended December 31, 2013.
On October 24, 2012, we completed a recapitalization (the “Recapitalization”). The Recapitalization included an amendment (the “Amendment”) to the Amended and Restated Credit and Guaranty Agreement (“New Term Loan Agreement”) for additional term loans in the aggregate U.S. dollar equivalent of approximately $760 million, which included 200 million Euros. Among other modifications, the Amendment: (a) extended the maturity date of the Revolving Credit Facility to August 2017; and (b) increased the maximum leverage ratio.
The Recapitalization also included a new offering of $500 million aggregate principal amount of the 6% Senior Notes. The 6% Senior Notes are guaranteed on a senior unsecured basis by the Company’s wholly-owned domestic subsidiaries. The 6% Senior Notes have terms substantially similar to the existing $1,000 million 12.5% Senior Notes, except that, most notably, the 6% Senior Notes have a three-year no call redemption period.
In order to effect the Recapitalization, we conducted an exchange offer and consent solicitation to exchange the Old 12.5% Senior Notes for the New 12.5% Senior Notes, and to solicit consents to proposed amendments to the indenture governing the Old 12.5% Senior Notes to permit the recapitalization. The requisite consents were obtained and 99.96% of the holders of the Old 12.5% Senior Notes agreed to participate in the exchange and received New 12.5% Senior Notes in an equal principal amount.
67
Table of Contents
The proceeds from the Recapitalization were used to pay a $1,202 million dividend to our stockholders and for payment of fees and expenses of the transaction of approximately $48 million, which were capitalized.
In March 2011, we entered into a New Term Loan Agreement replacing our Credit and Guaranty Agreement dated February 2010. Under the New Term Loan Agreement, we increased our borrowings by $52 million and EUR 21 million. The terms of the New Term Loan Agreement extended the maturity date of the term loan and revolver by eighteen months to August 2017 and one year to February 2016, respectively, reduced the borrowing margins and LIBOR floor, expanded the revolver borrowing capacity by $100 million, and eliminated the interest coverage ratio covenant.
At December 31, 2013, short-term and long-term debt was $66 million and $4,894 million, respectively, in the consolidated statements of financial position. Our Senior Secured Credit Facilities are secured by a security interest in substantially all of our tangible and intangible assets, including the stock and the assets of certain of our current and certain future wholly-owned U.S. subsidiaries (and the stock held by our immediate direct parent holding company) and a portion of the stock of certain of our non-U.S. subsidiaries. In addition, certain of the assets of our Swiss subsidiaries have been pledged to secure any borrowings under the Senior Term Loan by IMS AG. There have been no such borrowings to date.
Costs incurred to issue debt are generally deferred and amortized as a component of interest expense over the estimated term of the related debt using the effective interest rate method. As of December 31, 2013, the unamortized balance of original issue discount reflected as a reduction to long term debt and fees and expenses related to the issuance of debt included in Other assets was $67 million and $74 million, respectively. During the year ended December 31, 2013, we recorded interest expense of $35 million related to the amortization of these balances.
Our financing arrangements provide for certain covenants and events of default customary for similar instruments, including in the case of our New Term Loan Agreement (as amended), a covenant to maintain a specific ratio of consolidated total indebtedness to adjusted EBITDA, as defined in the Credit Agreement. If an event of default occurs under any of our financing arrangements, the creditors under such financing arrangements will be entitled to take various actions, including the acceleration of amounts due under such arrangements, and in the case of the lenders under our New Term Loan Agreement (as amended), other actions permitted to be taken by a secured creditor. At December 31, 2013, we were in compliance with the financial covenants under our New Term Loan Agreement (as amended).
In May 2010, we purchased interest rate caps and entered into interest rate swap agreements for purposes of managing our risk in interest rate fluctuations. We purchased U.S. dollar and Euro denominated interest rate caps for a total nominal value of approximately $1,675 million at strike rates ranging from 3% to 4%. These caps covered different periods between May 2010 and January 2015. The total premiums paid were $5 million. Most of these caps have expired and the nominal value of caps outstanding at December 31, 2013 was approximately $365 million, of which $250 million expired in January 2014.
We also entered into interest rate swap agreements to hedge notional amounts of $375 million of our borrowings. All were effective January 2012, and expire at various times from January 2014 through January 2016. On these agreements, we pay a fixed rate ranging from 2.6% to 3.3% and receive a variable rate of interest equal to the three-month London Interbank Offered Rate (“LIBOR”).
68
Table of Contents
The fair value of the interest rate caps and swaps is the estimated amount that we would receive or pay to terminate such agreements, taking into account market interest rates and the remaining time to maturities. As of December 31, 2013 and 2012, based upon mark-to-market valuation, we recorded in the consolidated statements of financial position a long-term liability of $12 million and $21 million, respectively.
Severance, impairment and other charges
We record a liability for significant costs associated with restructuring activities, including employee severance and related benefits, lease termination costs, asset impairments and other qualifying exit costs, when such costs are deemed probable and estimable. Employee severance benefits are calculated pursuant to the terms of established employee protection plans, in accordance with local statutory minimum requirements or individual employee contracts, as applicable. These charges are included in Severance, impairment and other charges, a component of operating income, on the consolidated statements of comprehensive (loss) income.
In December 2013, as a result of ongoing cost reduction efforts, we recorded a pre-tax severance charge of $12 million consisting of global workforce reductions to streamline our organization (the “2013 Plan”). Cash outlays related to the 2013 Plan were de minimis through December 31, 2013. We expect that cash outlays related to the 2013 Plan will be substantially complete by the end of 2014.
Also in 2013, we recorded severance, impairment and other charges of $10 million, $3 million of which was recorded in the fourth quarter of 2013, related to impaired leases for properties in the U.S. and contract-related charges for which we will not realize any future economic benefits.
In December 2012, as a result of ongoing cost reduction efforts, we implemented a restructuring plan (the “2012 Plan”) and recorded a pre-tax severance charge of $23 million consisting of global workforce reductions to streamline our organization. In 2013, $6 million of severance accruals were reversed due to the favorable settlement of required termination benefits and strategic business changes. We expect that cash outlays related to severance benefits for the 2012 Plan will be substantially complete by the end of the second quarter of 2014.
| (dollars in millions) | Severance related reserves |
|||
|
|
||||
| Balance at December 31, 2012 |
$ | 23 | ||
| 2013 utilization |
(11 | ) | ||
| 2013 reversal |
(6 | ) | ||
|
|
|
|||
| Balance at December 31, 2013 |
$ | 6 | ||
|
|
||||
During the fourth quarter of 2012, we recorded impairment charges of $2 million related to the write-down of certain assets to their net realizable values, $3 million for contract-related charges for which we will not realize any future economic benefits and $1 million related to a lease impairment for property in the U.S.
Also in 2012, we recorded $8 million of impairment charges related to leased facilities in the U.S. and Europe and $21 million of impairment charges related to the write-down of certain assets to their net realizable values and $1 million of contract-related charges for which we will not realize any future economic benefits.
69
Table of Contents
In the fourth quarter of 2011, as a result of classifying a building in the U.S. as held for sale, we recorded an impairment charge of $2 million. Also in 2011, we recorded $10 million in contract-related charges related to a cash payment made to a vendor for which we did not realize any future economic benefit.
In December 2010, we implemented a multi-year restructuring plan and recorded a pre-tax severance, impairment and other charge totaling $50 million related to ongoing cost reduction efforts, including workforce reductions to streamline our organization, the elimination of certain regional headquarter functions and asset impairments (the “2010 Plan”). During December 2011, we recorded an incremental charge of $19 million, bringing the total charge under the 2010 Plan to $69 million. Also during 2011, we reversed the facility exit portion of the 2010 Plan as we were able to successfully assign the related lease to a third party. During the fourth quarter of 2012, we reversed approximately $10 million of severance accruals for the 2010 Plan due to the favorable settlement of required termination benefits and strategic business changes. The cash outlays related to severance benefits for the 2010 Plan were substantially complete by the end of 2013.
| (dollars in millions) | Severance related reserves |
Facility exit charges |
Total | |||||||||
|
|
||||||||||||
| Balance at December 31, 2010 |
$ | 48 | $ | 1 | $ | 49 | ||||||
| 2011 utilization |
(26 | ) | — | (26 | ) | |||||||
| 2011 reversal |
— | (1 | ) | (1 | ) | |||||||
| Q4 2011 charge |
19 | — | 19 | |||||||||
| Currency translation adjustments |
1 | — | 1 | |||||||||
|
|
|
|||||||||||
| Balance at December 31, 2011 |
42 | — | 42 | |||||||||
| 2012 utilization |
(26 | ) | — | (26 | ) | |||||||
| Q4 2012 reversal |
(10 | ) | — | (10 | ) | |||||||
|
|
|
|||||||||||
| Balance at December 31, 2012 |
6 | — | 6 | |||||||||
| 2013 utilization |
(5 | ) | — | (5 | ) | |||||||
|
|
|
|||||||||||
| Balance at December 31, 2013 |
$ | 1 | — | $ | 1 | |||||||
|
|
||||||||||||
Additionally, during the fourth quarter of 2012, we reversed $1 million of a severance charge related to an acquisition recorded in 2010 as a result of favorable settlement of termination benefits.
Contingencies
We are exposed to certain known contingencies that are material to our investors. The facts and circumstances surrounding these contingencies and a discussion of their effect on us are included in Note 12 to our consolidated financial statements for the year ended December 31, 2013.
These contingencies may have a material effect on our liquidity, capital resources or results of operations. In addition, even where our reserves are adequate, the incurrence of any of these liabilities may have a material effect on our liquidity and the amount of cash available to us for other purposes.
Management believes that we have made appropriate arrangements in respect of the future effect on us of these known contingencies. Management also believes that the amount of cash available to us from our operations, together with cash from financing, will be sufficient for us to
70
Table of Contents
pay any known contingencies as they become due without materially affecting our ability to conduct our operations and invest in the growth of our business.
Contractual obligations
Our contractual obligations include facility leases, agreements to purchase data and telecommunications services, leases of certain computer and other equipment, projected pension and other postretirement benefit plan contributions, long-term debt obligations and employee severance. At December 31, 2013, the minimum annual payment under these agreements and other contracts that have initial or remaining non-cancelable terms in excess of one year are as listed in the following table:
| Year | ||||||||||||||||||||||||||||
| (dollars in millions) | 2014 | 2015 | 2016 | 2017 | 2018 | Thereafter | Total | |||||||||||||||||||||
|
|
||||||||||||||||||||||||||||
| Operating leases(1) |
$ | 52 | $ | 46 | $ | 43 | $ | 41 | $ | 32 | $ | 62 | $ | 276 | ||||||||||||||
| Data acquisition and telecommunication services(2) |
205 | 152 | 103 | 69 | 24 | 29 | 582 | |||||||||||||||||||||
| Computer and other equipment leases(3) |
27 | 15 | 12 | 7 | 5 | 10 | 76 | |||||||||||||||||||||
| Projected pension and other postretirement benefit plan contributions(4) |
16 | — | — | — | — | — | 16 | |||||||||||||||||||||
| Long-term debt(5) |
392 | 348 | 345 | 2,934 | 1,848 | 560 | 6,427 | |||||||||||||||||||||
| Other liabilities(6) |
40 | 17 | 18 | 18 | 20 | 119 | 232 | |||||||||||||||||||||
|
|
|
|||||||||||||||||||||||||||
| Total |
$ | 732 | $ | 578 | $ | 521 | $ | 3,069 | $ | 1,929 | $ | 780 | $ | 7,609 | ||||||||||||||
|
|
||||||||||||||||||||||||||||
| (1) | Rental expense under real estate operating leases for the years ended 2013, 2012 and 2011 were $20 million, $21 million and $34 million, respectively. |
| (2) | Expense under data and telecommunications contracts for the years ended 2013, 2012 and 2011 were $215 million, $191 million and $212 million, respectively. |
| (3) | Rental expense under computer and other equipment leases for the years ended 2013, 2012 and 2011 were $25 million, $26 million and $24 million, respectively. These leases are frequently renegotiated or otherwise changed as advancements in computer technology produce opportunities to lower costs and improve performance. |
| (4) | Our contributions to pension and other postretirement benefit plans for the years ended 2013, 2012 and 2011 were $46 million, $15 million and $16 million, respectively. The estimated contribution amount shown for 2014 relates to required contributions to funded plans as well as benefit payments from unfunded plans. The expected contribution shown for 2014 is required. |
| (5) | Amounts represent the principal balance plus estimated interest expense based on current interest rates under our long-term debt (see Note 7 to our consolidated financial statements for the year ended December 31, 2013 included elsewhere in this prospectus). |
| (6) | Includes estimated future funding requirements related to pension and postretirement benefits (see Note 8 to our consolidated financial statements for the year ended December 31, 2013 included elsewhere in this prospectus) and severance, impairment and other charges (see Note 6 to our consolidated financial statements for the year ended December 31, 2013 included elsewhere in this prospectus). As the timing of future cash outflows is uncertain, the following long-term liabilities (and related balances) are excluded from the above table: deferred taxes ($1,102) million and uncertain tax benefits reserve ($28) million. |
Under the terms of certain acquisition-related purchase agreements, we may be required to pay additional amounts as contingent consideration based primarily on the achievement of certain financial performance related metrics. At December 31, 2013, we have recorded estimated accruals of approximately $65 million, which could become due through 2017, with respect to these additional payments relating to eight acquisitions.
71
Table of Contents
Off-balance sheet obligations
As of December 31, 2013, we have no off-balance sheet arrangements that currently have or are reasonably likely to have a material effect on our consolidated financial condition, changes in financial condition, results of operations, liquidity, capital expenditures or capital resources.
Critical accounting estimates
Note 2 to the consolidated financial statements for the year ended December 31, 2013 included elsewhere in this prospectus includes a summary of the significant accounting policies and methods used in the preparation of our consolidated financial statements. Following is a brief discussion of the more significant accounting policies and methods used by us.
The most significant estimates relate to allowances, depreciation of fixed assets including salvage values, carrying value of goodwill and intangible assets, provision for income taxes and tax assets and liabilities, reserves for employee benefits, stock-based compensation, contingencies and litigation. We base our estimates on historical experience and on various other assumptions that are believed to be reasonable under the circumstances, the results of which form the basis for making judgments about the carrying values of assets and liabilities that are not readily apparent from other sources. The accounting estimates used in the preparation of our consolidated financial statements will change as new events occur, as more experience is acquired, as additional information is obtained and as our operating environment changes. Actual results could vary from the estimates and assumptions used in the preparation of the consolidated financial statements for the year ended December 31, 2013.
We believe the following critical policies involve significant judgments and estimates used in the preparation of our consolidated financial statements for the year ended December 31, 2013.
Revenue recognition. We recognize revenue when the following criteria have been met: 1) persuasive evidence of an arrangement exists; 2) delivery has occurred or services have been rendered; 3) the seller’s price to the buyer is fixed or determinable; and 4) collectibility is reasonably assured.
We offer various information offerings developed to meet our clients’ needs by using data secured from a worldwide network of suppliers. Our revenue arrangements may include multiple elements. A typical information offerings arrangement (primarily under fixed-price contracts) may include an ongoing subscription-based deliverable for which revenue is recognized ratably as earned over the contract period and/or a one-time delivery of data offerings for which revenue is recognized upon delivery, assuming all other criteria are met. These deliverables qualify as separate units of accounting as each has value on a standalone basis to the client, objective and reliable evidence of fair value for any undelivered item(s) exists, and where the arrangement includes a general right of return relative to the delivered item(s), delivery of the undelivered item(s) is probable and within our control. We allocate revenue to each element within our arrangements based upon their respective relative selling price. Fair values for these elements are based upon the normal pricing practices for these offerings when sold separately. We defer revenue for any undelivered elements, and recognize revenue when the product is delivered or over the term of the agreement, in accordance with our revenue recognition policy for such element as noted above. Our subscription arrangements typically have terms ranging from one to three years and are generally non-cancelable and do not contain refund-type provisions.
72
Table of Contents
We also offer technology services offerings that enable our clients to make informed business decisions. These arrangements typically have terms ranging from several weeks to three years, with a majority having terms of one year or less. Revenue for services engagements where deliverables occur ratably over time are recognized on a straight-line basis over the term of the arrangement. Revenue from time and material contracts are recognized as the services are provided. Revenue from fixed price ad hoc services and consulting contracts are recognized either over the contract term based on the ratio of the number of hours incurred for services provided during the period compared to the total estimated hours to be incurred over the entire arrangement (efforts based), or upon delivery (completed contract).
Operating costs of information. Operating costs of information includes costs attributable to personnel involved in production, data management and delivery, and the costs of acquiring and processing data for our information offerings.
One of our major expenditures is the cost for the data we receive from suppliers. After receipt of the raw data and prior to the data being available for use in any part of our business, we are required to transform the raw data into useful information through a series of comprehensive processes. These processes involve significant employee costs and data processing costs.
Costs associated with our purchases are deferred within work-in-process inventory and recognized as expense as the corresponding data product revenue is recognized by us, generally over a 30 to 60 day period.
Direct and incremental costs of technology services. Direct and incremental costs of technology services include costs of staff directly involved with delivering technology-related, consulting and services generating offerings and engagements, related accommodations and the costs of data purchased specifically for technology services engagements. Direct and incremental costs of technology services do not include an allocation of direct costs of data that are included in operating costs of information. Although our data, the costs of which are included in Operating Costs of Information, is used in multiple client solutions across different offerings within both information and technology services, we do not have a meaningful way to allocate the direct cost of the data between information and technology services. As such, the direct and incremental costs of technology services do not reflect the total costs incurred to deliver our technology services engagements.
Stock-based compensation. We maintain a stock incentive plan, which provides for the grant of stock options, stock appreciation rights, restricted stock, unrestricted stock, restricted stock units, and/or performance awards to key employees and directors, consultants, and advisors to us as determined by the plan administrator. We recognize as stock-based compensation expense for all share-based payments to employees over the requisite service period (generally the vesting period) in the consolidated statements of comprehensive (loss) income based on the fair values of the number of awards that are ultimately expected to vest. For performance-based awards, stock-based compensation expense is adjusted over time based on our assessment of the probability of achieving the financial targets. As a result, for most awards, recognized stock-based compensation expense is reduced for estimated forfeitures prior to vesting primarily based on historical annual forfeiture rates. Estimated forfeitures will be reassessed in subsequent periods and may change based on new facts and circumstances. We satisfy exercises and issuances of vested equity awards with issuances of common stock. We recorded stock-based compensation expense of $22 million, $19 million and $18 million in the years ended December 31, 2013, 2012 and 2011, respectively.
73
Table of Contents
Fair value measurement and valuation methodologies
Stock-based compensation expense is primarily based on the estimated grant date fair value using the Black-Scholes option pricing model. Considerable judgment is required in determining the fair value of stock-based grants, including factors such as estimating the expected term of the grant, expected volatility of our stock and the expected forfeiture rate. In addition, for stock option grants where vesting is dependent on achieving certain operating performance targets, we estimate the likelihood of achieving those performance targets. The following table summarizes the weighted average assumptions used to compute the weighted average fair value of stock option grants:
| 2013 | 2012 | 2011 | ||||||||||
|
|
||||||||||||
| Dividend Yield |
0.0% | 0.0% | 0.0% | |||||||||
| Weighted Average Volatility |
26.7% | 27.00% | 25.2% | |||||||||
| Risk Free Interest Rate |
1.19% | 0.92% | 1.56% | |||||||||
| Expected Term |
5.50 years | 5.50 years | 5.50 years | |||||||||
| Weighted Average Fair Value of Options Granted |
$0.49 | $0.33 | $0.30 | |||||||||
| Weighted Average Grant Price |
$1.30 | $1.24 | $1.12 | |||||||||
|
|
||||||||||||
| • | The dividend yield of 0.0% is used because no recurring dividends have been authorized and we do not expect to pay cash dividends in the foreseeable future. An increase in the dividend yield will decrease stock compensation expense. |
| • | The weighted average volatility was developed using the historical volatility of several peer companies to IMS Health Holdings, Inc. for periods equal to the expected life of the options. An increase in the weighted average volatility assumption will increase stock compensation expense. |
| • | The risk-free interest rate was developed using the U.S. Treasury yield curve for periods equal to the expected life of the options on the grant date. An increase in the risk-free interest rate will increase stock compensation expense. |
| • | The expected term was estimated for the 2013 grant of stock options as the vesting term plus 6 months. Participants are unlikely to exercise before a liquidity event because there has been no market to sell the shares. On January 2, 2014, we filed the registration statement, of which this prospectus forms a part related to this offering of our common stock with the Securities and Exchange Commission, which could alter the expected term for future grants. An increase in the expected holding period will increase stock compensation expense. |
The following table summarizes the stock option grants for 2013 and 2012:
| (in thousands except per share
Stock option grant period (three months ended) |
Number of options |
Weighted exercise price |
Weighted |
Weighted average fair
value |
||||||||||||
|
|
||||||||||||||||
| March 31, 2012 |
3,350 | $1.19 | (2)(4) | $1.19 | $0.31 | |||||||||||
| June 30, 2012 |
4,040 | $1.40 | (2)(4) | $1.40 | $0.38 | |||||||||||
| September 30, 2012 |
450 | $1.40 | (2)(4) | $1.40 | $0.37 | |||||||||||
| December 31, 2012 |
1,950 | $0.98 | (3)(4) | $0.98 | $0.26 | |||||||||||
| March 31, 2013 |
1,830 | $1.35 | (4) | $1.35 | $0.37 | |||||||||||
| June 30, 2013 |
5,985 | $1.35 | (4) | $1.35 | $0.36 | |||||||||||
| September 30, 2013 |
3,985 | $1.35 | (4) | $1.35 | $0.38 | |||||||||||
| December 31, 2013 |
2,825 | $1.09 | (5) | $1.95 | $1.00 | |||||||||||
|
|
||||||||||||||||
| (1) | Does not include 2,070 and 5,110 shares, respectively, of Phantom SARs (as defined herein) granted in 2012 and 2013, respectively, for which no expense was recognized. |
74
Table of Contents
| (2) | The weighted average exercise price does not reflect the reduction in the exercise price of unvested awards resulting from the $0.42 per share dividend paid in October 2012 (See Note 9 to our consolidated financial statements). |
| (3) | The decrease in the exercise price from prior grants is the result of the $0.42 per share dividend we paid in October 2012. |
| (4) | The weighted average exercise price does not reflect the reduction in the exercise price of unvested awards resulting from the $0.26 per share dividend paid in August 2013 (See “Executive compensation–Elements of compensation–Payments and adjustments in connection with cash dividends”). |
| (5) | The decrease in the exercise price from prior grants is the result of the $0.26 per share dividend we paid in August 2013. |
The exercise price of stock options set by our board of directors is not less than the estimated fair market value of our common stock on the date of grant. Our board of directors have taken into account a number of objective and substantive factors in determining the fair market value of our common stock. Factors considered, but not limited to, include a) valuations using the methodologies described below and b) our overall operating and financial performance.
Our stock is not currently publicly traded, and as such, we conduct stock valuations on an annual basis as of December 31 for each year. We consider a number of objective and subjective factors in determining the value of our common stock at each valuation date in accordance with the guidance in the American Institute of Certified Public Accountants Practice Aid Valuation of Privately-Held-Company Equity Securities Issued as Compensation, or Practice Aid. These objective and subjective factors included, but were not limited to:
| • | arm’s-length sales of our common stock in privately negotiated transactions; |
| • | valuations of our common stock; |
| • | our stage of development and financial position; and |
| • | our future financial projections. |
Our common stock valuations performed from the Merger through the date of this prospectus were determined by taking a weighted-average value calculated under two different valuation approaches, the income approach and market approach.
The Income Approach quantifies the future cash flows that management expects to achieve consistent with our annual operating plan process. These future cash flows are discounted to their net present values using a rate corresponding to an estimated weighted-average cost of capital. The discount rate reflects the risks inherent in the cash flows and the market rates of return available from alternative investments of similar type and quality as of the valuation date. Our weighted average cost of capital (“WACC”) is calculated by weighting the required returns on interest-bearing debt and common equity capital in proportion to their estimated percentages in our capital structure as well as the capital structure of comparable publicly-traded companies. Our WACC assumptions utilized in the valuations performed during the year from December 31, 2012 through December 31, 2013 ranged from 10.5% to 11.0%.
The Market Approach considers the fair value of an asset based on the price at which comparable assets have been purchased under similar circumstances. The transactions are usually based on recent sale prices of similar assets based on an arm’s length transaction. Most commonly, the market approach relies on published transactions, based on a multiple of earnings before interest, taxes, depreciation and amortization (“EBITDA”), which is consistent with the primary profitability metric underlying our annual operating plan process. The EBITDA multiples were determined based on acquisition and/or trading multiples of a peer group of companies that are periodically reviewed by management for consistency with our business strategy, the businesses and markets in which we operate and our competitive landscape. The EBITDA multiples ranged from 8.5x to 10.5x in the valuations performed during the year from December 31, 2012 through December 31, 2013.
75
Table of Contents
While we believe both of these two approaches provide reliable estimates of fair value, we apply a heavier weighting to the income approach as we believe this valuation method provides a more reasonable estimate of fair value given the market approach may reflect greater volatility based on the trading multiples of a peer group in an unstable or illiquid market. We have applied a discount factor to the resulting fair values obtained by averaging the values calculated under the income approach and the market approach to reflect the lack of marketability of the common stock for being a private company.
During the periods discussed above, we performed valuations of our common stock in January 2013 and 2014. As a standard part of its approval process for each of these valuations, our board of directors reviewed our current and projected financial performance, including the consideration of various scenarios of such performance and their corresponding impact on our common stock valuation. As part of its assessment of our operating performance, our board considered general economic conditions, the peer group of companies and their performance relative to our business strategy, and the volatility in the equity markets generally. Additional information on stock-based compensation is contained in Note 9 to the consolidated financial statements.
Pensions and other post retirement benefits. We provide a number of retirement benefits to our employees, including defined benefit pension plans and postretirement medical plans. The determination of benefit obligations and expense is based on actuarial models. In order to measure benefit costs and obligations using these models, critical assumptions are made with regard to the discount rate, expected return on plan assets, cash balance crediting rate, lump sum conversion rate and the assumed rate of compensation increases. In addition, retiree medical care cost trend rates are a key assumption used exclusively in determining costs for our postretirement health care and life insurance benefit plans. Management reviews these critical assumptions at least annually. Other assumptions involve demographic factors such as the turnover, retirement and mortality rates. Management reviews these assumptions periodically and updates them when its experience deems it appropriate to do so.
The discount rate is the rate at which the benefit obligations could be effectively settled and is determined annually by management. For U.S. plans, the discount rate is based on results of a modeling process in which the plans’ expected cash flow (determined on a projected benefit obligation basis) is matched with spot rates developed from a yield curve comprised of high-grade (Moody’s Aa and above, or Standard and Poor’s AA and above) non-callable corporate bonds to develop the present value of the expected cash flow, and then determining the single rate (discount rate) which when applied to the expected cash flow derives that same present value. In the U.K. specifically, the discount rate is set based on the yields on a universe of approximately 120 high quality (Aa rated) non-callable corporate bonds denominated in U.K. Sterling, appropriate to the duration of Plan liabilities. For the other non-U.S. plans, the discount rate is based on the current yield of an index of high quality corporate bonds. At December 31, 2013, the discount rate ranged from 2.9% to 4.7% compared to 3.8% at December 31, 2012 for its U.S. pension plans and postretirement benefit plan. The discount rate for its U.K. pension plan was decreased to 4.6% from 4.7% at December 31, 2012. The U.S. and U.K. plans represent 96% of the consolidated benefit obligation as of December 31, 2013. The discount rate in other non-U.S. countries decreased, where the range of applicable discount rates at December 31, 2013 was 0.9% to 6.2%. As a sensitivity measure, a 25 basis point increase in the discount rate for either our U.S. plan or our U.K. plan, absent any offsetting changes in other assumptions, would result in a de minimis increase in pension expense within the consolidated statements of comprehensive (loss) income.
76
Table of Contents
Under the U.S. qualified retirement plan, participants have a notional retirement account that increases with pay and investment credits. The rate used to determine the investment credit (cash balance crediting rate) varies monthly and is equal to 1/12th of the yield on 30-year U.S. Government Treasury Bonds, with a minimum of 0.25%. At retirement, the account is converted to a monthly retirement benefit.
In selecting an expected return on plan asset assumption, we consider the returns being earned by each plan investment category in the fund, the rates of return expected to be available for reinvestment and long-term economic forecasts for the type of investments held by the plan. The expected return on plan assets for the U.S. pension plans was 8.0% at January 1, 2014 and January 1, 2013. Outside the U.S., the range of applicable expected rates of return was 1.0% to 6.5% as of January 1, 2014 and January 1, 2013. The actual return on plan assets will vary from year to year versus this assumption. We believe it is appropriate to use long-term expected forecasts in selecting the expected return on plan assets. As such, there can be no assurance that our actual return on plan assets will approximate the long-term expected forecasts. The expected return on assets (“EROA”) was $29 million and $27 million and the actual return on assets was $68 million and $44 million for the years ended December 31, 2013 and 2012, respectively. As a sensitivity measure, a 25 basis point change in the EROA assumption for our U.S. plan, absent any offsetting changes in other assumptions, would result in an approximately $1 million increase or decrease in pension expense within the consolidated statements of comprehensive (loss) income. For our U.K. plan, a 25 basis point change in the EROA assumption, absent any offsetting changes in other assumptions, would result in a de minimis increase or decrease in pension expense within the consolidated statements of comprehensive income. While we believe that the assumptions used are reasonable, differences in actual experience or changes in assumptions may materially affect its pension and postretirement obligations and future expense.
We utilize a corridor approach to amortizing unrecognized gains and losses in the pension and postretirement plans. Amortization occurs when the accumulated unrecognized net gain or loss balance exceeds the criterion of 10% of the larger of the beginning balances of the projected benefit obligation or the market-related value of the plan assets. The excess unrecognized gain or loss balance is then amortized using the straight-line method over the average remaining service-life of active employees expected to receive benefits. At December 31, 2013, the weighted-average remaining service-life of active employees was 22.15 years.
At December 31, 2013, the fair value of assets exceeded the projected benefit obligation of our pension plans by $12 million.
Additional information on pension and other postretirement benefit plans is contained in Note 8 to the consolidated financial statements.
Goodwill. Goodwill represents the excess purchase price over the fair value of identifiable net assets of businesses acquired, and is not amortized. We review the recoverability of goodwill annually (or based on any triggering event) by comparing the estimated fair values (based on discounted cash flow analysis) of reporting units with their respective net book values. If the carrying amount of the reporting unit exceeds its fair value, the goodwill impairment loss is measured as the excess of the carrying value of goodwill over its fair value. We completed our annual impairment tests in 2013, 2012 and 2011 and no goodwill impairment charges were recorded.
Other long-lived assets. We review the recoverability of our long-lived assets and identifiable intangibles held and used whenever events or changes in circumstances indicate that the carrying amount of an asset may not be recoverable. In general, the assessment of possible impairment is
77
Table of Contents
based on our ability to recover the carrying value of the asset from the undiscounted expected future cash flows of the asset. If the future cash flows are less than the carrying value of such asset, an impairment charge is recognized for the difference between the estimated fair value and the carrying value. In addition, we also review our indefinite-lived intangible assets on an annual basis.
Income taxes. We operate in more than 100 countries around the world and our earnings are taxed at the applicable income tax rate in each of those countries. We provide for income taxes utilizing the asset and liability method of accounting for income taxes. Under this method, deferred income taxes are recorded to reflect the tax consequences in future years of differences between the tax basis of assets and liabilities and their financial reporting amounts at each balance sheet date, based on enacted tax laws and statutory tax rates applicable to the periods in which the differences are expected to affect taxable income. If it is determined that it is more likely than not that future tax benefits associated with a deferred tax asset will not be realized, a valuation allowance is provided. In the event we were to determine that we would be able to realize our deferred tax assets in the future in excess of our net recorded amount, an adjustment to the deferred tax asset would increase income in the period such determination was made. Likewise, should we determine that we would not be able to realize all or part of our net deferred tax asset in the future, an adjustment to the deferred tax asset would be charged to income in the period such determination was made. The effect on deferred tax assets and liabilities of a change in the tax rates is recognized in income in the period that includes the enactment date. We recognize interest and penalties related to unrecognized tax benefits in income tax expense.
Foreign currency. We have significant investments in non-U.S. countries. Therefore, changes in the value of foreign currencies affect our consolidated financial statements when translated into U.S. dollars. For all operations outside the United States where we have designated the local currency as the functional currency, assets and liabilities are translated using end-of-period exchange rates; revenues, expenses and cash flows are translated using average rates of exchange prevailing during the period the transactions occurred. Translation gains and losses are included as an adjustment to the accumulated other comprehensive income (loss) component of shareholders’ equity. In addition, gains and losses from foreign currency transactions, such as those resulting from the settlement and revaluation of third-party and intercompany foreign receivables and payables, are included in the determination of net (loss) income.
For operations in countries that are considered to be highly inflationary or where the U.S. dollar is designated as the functional currency, monetary assets and liabilities are remeasured using end-of-period exchange rates, whereas non-monetary accounts are remeasured using historical exchange rates, and all remeasurement and transaction adjustments are recognized in Other loss, net.
Recently issued accounting standards
In July 2013, the Financial Accounting Standard Board (“FASB”) determined that an unrecognized tax benefit should be presented as a reduction to a deferred tax asset for a net operating loss (“NOL”) carryforward or other tax credit carryforward, excluding certain exceptions. The guidance is consistent with our existing practices and is effective for interim and annual periods beginning January 1, 2014. We do not believe the adoption of this guidance will have a material impact on our financial results.
In March 2013, the FASB issued amendments to address the accounting for the cumulative translation adjustment when a parent either sells a part or all of its investment in a foreign entity
78
Table of Contents
or no longer holds a controlling financial interest in a subsidiary or group of assets that is a nonprofit activity or a business within a foreign entity. The amendments are effective prospectively for fiscal years beginning after December 15, 2013, with early adoption permitted. The adoption of this guidance is not expected to have a material impact on our financial results.
In February 2013, the FASB amended existing guidance by requiring companies to present information about reclassification adjustments from accumulated other comprehensive income in their financial statements in a single note or on the face of the financial statements. The amendments are effective prospectively for reporting periods beginning after December 15, 2012, with early adoption permitted. As these amendments required only additional disclosure, adoption did not have a material impact on our financial results.
Quantitative and qualitative disclosures about market risk
Market risk is the potential loss arising from adverse changes in market rates and prices, such as foreign currency exchange rates, interest rates, and other relevant market rate or price changes. In the ordinary course of business, we are exposed to various market risks, including changes in foreign currency exchange rates, interest rates and equity price changes, and we regularly evaluate our exposure to such changes. Our overall risk management strategy seeks to balance the magnitude of the exposure and the cost and availability of appropriate financial instruments. From time to time, we have utilized forward exchange contracts to manage our foreign currency exchange rate risk.
Foreign exchange risk
Our primary market risks are the impact of foreign exchange fluctuations on non-U.S. dollar denominated revenue and the impact of interest rate fluctuations on interest expense.
We transact business in more than 100 countries and are subject to risks associated with changing foreign exchange rates. Our objective is to reduce earnings and cash flow volatility associated with foreign exchange rate changes. Accordingly, we enter into foreign currency forward contracts to minimize the impact of foreign exchange movements on EBITDA, and to hedge non-U.S. dollar anticipated royalties.
It is our policy to enter into foreign currency transactions only to the extent necessary to meet our objectives as stated above. We do not enter into foreign currency transactions for investment or speculative purposes. The principal currencies hedged are the Euro, the Japanese Yen, the British Pound, the Swiss Franc and the Canadian Dollar. See Note 7 to our consolidated financial statements for the year ended December 31, 2013 included elsewhere in this prospectus.
The contractual value of our foreign exchange hedging instruments was approximately $421 million at December 31, 2013. The fair value of these hedging instruments is subject to change as a result of potential changes in foreign exchange rates. We assess our market risk based on changes in foreign exchange rates utilizing a sensitivity analysis. The sensitivity analysis measures the potential loss in fair values based on a hypothetical 10% change in currency rates. The potential loss in fair value for foreign exchange rate-sensitive instruments, all of which were foreign currency forward contracts, based on a hypothetical 10% decrease in the value of the U.S. dollar or, in the case of non-dollar-related instruments, the currency being purchased, was $30 million at December 31, 2013. However, the change in the fair value of foreign exchange rate-sensitive instruments would likely be offset by a change in the fair value of the future
79
Table of Contents
income or royalty being hedged. The estimated fair values of the foreign exchange risk management contracts were determined based on quoted market prices.
In February 2013, the Venezuelan government announced the devaluation of its currency and the official exchange rate was adjusted from 4.30 Bolívars to each U.S. dollar to 6.30. Our Swiss operating subsidiary, IMS AG, maintains certain account balances in Bolívars (mainly Cash and cash equivalents). As these balances are held in a non-functional currency of IMS AG, it is required that we mark-to-market these balances at each reporting date and reflect these movements as gains or losses in income. Approximately 6% of our consolidated cash and cash equivalents balance as of December 31, 2013 was held in Venezuelan Bolívars.
Additionally, since January 2010, Venezuela has been designated as hyper-inflationary, and as such, all foreign currency fluctuations are recorded in income for certain account balances at our local Venezuelan operating subsidiary. We recorded a pre-tax charge of approximately $14 million to other loss, net in 2013 related to the remeasurement of the IMS AG Venezuelan Bolívar account balances and the remeasurement of certain local Venezuelan account balances. As of December 31, 2013, the net assets, including cash and cash equivalents, held by our Venezuelan subsidiaries was approximately 6% of our consolidated net assets and for the year ended December 31, 2013, revenue generated by our Venezuelan subsidiaries was less than 1% of our consolidated revenues. Venezuela has foreign exchange and price controls which have historically limited our ability to convert Bolívars to U.S. dollars and transfer funds out of Venezuela. Additionally, government restrictions on the transfer of cash out of the country have limited our ability to repatriate cash; however, these restrictions have not impacted our ability to execute our business plans in Venezuela. It is not possible for us to predict the extent to which we may be affected by additional future changes in exchange rates and exchange controls imposed by the Venezuelan government.
Interest rate risk
We also borrow funds and since the interest rate associated with those borrowings changes over time, we are subject to interest rate risk. We have not hedged all of this exposure. We assess our market risk based on changes in interest rates utilizing a sensitivity analysis. The sensitivity analysis measures the increase in annual interest expense based on a hypothetical 1% increase in interest rates. This increase would have amounted to approximately $3 million at December 31, 2013.
80
Table of Contents
Our Company
We are a leading global information and technology services company providing clients in the healthcare industry with comprehensive solutions to measure and improve their performance. We have one of the largest and most comprehensive collections of healthcare information in the world, spanning sales, prescription and promotional data, medical claims, electronic medical records and social media. Our scaled and growing data set contains over 10 petabytes of unique data and over 500 million comprehensive, longitudinal, anonymous patient records (i.e., records that are linked over time for each anonymous individual across healthcare settings). Based on this data, we deliver information and insights on approximately 90% of the world’s pharmaceuticals, as measured by sales revenue. We standardize, organize, structure and integrate this data by applying our sophisticated analytics and leveraging our global technology infrastructure to help our clients run their organizations more efficiently and make better decisions to improve their operational and financial performance. We have a presence in over 100 countries, including high growth emerging markets, and we generated 63% of our $2.54 billion of 2013 revenue from outside the United States.
We serve key healthcare organizations and decision makers around the world, spanning the breadth of life science companies, including pharmaceutical, biotechnology, consumer health and medical device manufacturers, as well as distributors, providers, payers, government agencies, policymakers, researchers and the financial community. The breadth of the intelligent, actionable information we provide is not comprehensively available from any other source and our scope of offerings would be difficult and costly for another party to replicate. As a result, our information and technology services offerings, which we have developed with significant investment over our 60-year history, are deeply integrated into our clients’ workflow. We maintain long-standing relationships and high renewal rates with our clients due to the value of the services and solutions we provide. The average length of our relationships with our top 25 clients, as measured by 2013 revenue, is over 25 years and our retention rate for our top 1,000 clients from 2012 to 2013 was approximately 99%. We have significant visibility into our financial performance, as historically about 70% of our revenue has recurred annually, principally because our information and technology services offerings are critical to our clients’ daily decision-making and are sold primarily through subscription and service contracts.
We leverage our proprietary information assets to develop technology and services capabilities with a talented healthcare-focused workforce that enables us to grow our relationships with healthcare stakeholders. This set of capabilities includes:
| • | A leading healthcare-specific global IT infrastructure, which we use to process data from over 45 billion healthcare transactions annually and to collect data from over 780,000 fragmented feeds globally which we organize in a consistent and highly structured fashion using proprietary methodologies; |
| • | A staff of approximately 9,500 professionals across the globe, including over 1,200 experts in areas such as biostatistics, data science, bioinformatics, healthcare economics, outcomes research, epidemiology, pharmacology and key therapeutic areas; |
| • | Our intelligent cloud, IMS One, which opens our sophisticated global IT infrastructure to our clients and provides the ability to perform business analytics in the cloud with large amounts of complex data. Our cloud is unique in the healthcare industry because it pre-integrates |
81
Table of Contents
| applications with IMS data, eliminating the cost traditionally associated with integrating information, and provides interoperability across both IMS and third party applications, reducing the complexity traditionally associated with siloed data; and |
| • | A growing set of proprietary applications, which includes: commercial applications supporting sales operations, sales management, multi-channel marketing and performance management; real-world evidence solutions helping manufacturers and payers evaluate the value of treatments in terms of cost, quality and outcomes; payer-provider solutions helping these constituents to optimize contracting and performance management; and clinical solutions helping manufacturers and CROs better design, plan, execute and track clinical trials. |
At a time when the healthcare industry is experiencing transformational change driven by global expansion and the growth of new categories of medicines, intense cost pressures, a changing regulatory environment, and new payment and delivery models, we enable our clients to gain and apply insights designed to substantially improve operating performance. Our solutions, which are designed to provide our clients access to our deep healthcare specific subject matter expertise, take various forms, including information, tailored analytics, subscription software and expert services.
We believe our mission-critical relationships with our life science clients are reflected in the role we play within four important areas of decision-making related to their product portfolios: Research and Development, Pre-Launch, Launch and In-Market. Over the last three years, we have introduced software and services applications that have further deepened our level of client integration by enabling our clients to enhance and automate many of these key decision-making processes.
| • Market opportunity assessment
• Clinical trial feasibility/planning
• Site selection
• Patient recruitment
• Trial monitoring
• Performance management |
• Drug pricing optimization
• Launch readiness
• Commercial planning
• Brand positioning
• Message testing
• Influence networks
• Territory design |
• Market access
• Health technology assessment
• Commercial readiness
• Forecasting
• Resource allocation
• Call planning
• Stakeholder engagement |
• Commercial operations
• Sales force effectiveness
• Sales force alignment
• Multi-channel marketing
• Client relationship management
• Lifecycle management |
82
Table of Contents
We believe that a powerful component of our value proposition is the breadth and depth of intelligence we provide to help our clients address fundamental operational questions.
| User | Illustrative questions | |||||
| Sales | Which providers generate highest return on rep visit? | Does my sales rep drive appropriate prescribing? | How much should I pay my sales rep next month? | |||
| Marketing | What share of patients is appropriately treated? | Which underserved patient populations will benefit most from my new drug? | Is my brand gaining market share quickly enough to hit revenue forecasts? | |||
| Research & Development | Are there enough patients for my clinical trial? | Which study centers have the target patients? | How long will trial enrollment take to hit target patient volumes? | |||
| Real World Evidence (“RWE”)/Pharmacovigilance | What is the likely impact of new therapies on costs and outcomes? | Are new therapies performing better against existing standards of care in real world settings? | Does real world data indicate adverse events not detected in clinical trials? | |||
We generate revenue through local sales teams that manage client relationships in each region and go to market locally with our full suite of information and technology services offerings. Total global revenue from our information offerings, including national and sub-national information services represented 60% of our 2013 revenue. Total global revenue from our technology services offerings, which include hosted and cloud-based applications, implementation services, subscription software, analytic services and consulting, represented 40% of our 2013 revenue. We believe the data from our information offerings, when combined with our technology services offerings, can provide valuable insights to our clients and can increase the speed and effectiveness of decision making while also simplifying processes and reducing complexity and costs. Increasing demand from our clients for broader and more integrated offerings has been an important driver of our growth in technology services revenue, which grew at a CAGR of 13% between 2010 and 2013.
Ari Bousbib was appointed as our Chief Executive Officer on August 16, 2010 following the purchase of our Company by our Sponsors in February 2010, which we refer to as the Merger. Over the past three years, Mr. Bousbib and the management team have made substantial investments in human capital, technology and services infrastructure to expand the breadth of our platform and the number of constituents we serve within the healthcare value chain. Examples of our strategic investments and operational changes include:
| • | improving our operating efficiency by streamlining our organization, deploying lean methodologies throughout our global operations, and standardizing and automating processes; |
| • | in-sourcing development activities and capabilities, with approximately 70% of our development resources in-house as of 2013 year end, compared to approximately 30% in 2010; |
| • | increasing our offshore delivery resources to over 2,000 people as of 2013 year end, compared to 250 in 2010, which has driven substantial productivity improvement; |
83
Table of Contents
| • | shifting our employee mix, with over 50% now client-facing as of 2013 year end, compared to approximately 33% in 2010; and |
| • | expanding our offerings and capabilities by investing over $900 million in 22 complementary acquisitions, internal development projects and capital expenditures since the beginning of 2011 through 2013 year end. |
These strategic investments and operational changes have transformed our organization into a more client-centric, service oriented, high-performance culture. Since the Merger through the end of 2013, we added approximately 7,600 employees to the organization and oversaw the departure of approximately 5,200 employees from the organization, reflecting the various strategic and operational changes described above. We estimate that about 60% of our approximately 9,500 employees have joined us since the Merger through the end of 2013.
We believe our investments in people, technology and services have enabled us to significantly expand our addressable market and capture an additional portion of our clients’ spend by providing more powerful technology solutions and new insight-driven services. The following financial performance metrics have improved significantly between 2010 and 2013:
| • | revenue increased to $2.54 billion, generating a CAGR of 5.6% on an as reported basis and 5.9% on a constant dollar basis; |
| • | Adjusted EBITDA increased to $829 million, generating a CAGR of 10.2% on an as reported basis and 10.6% on a constant dollar basis; and |
| • | Adjusted EBITDA as a percentage of revenue increased to 32.6% from 28.6%. |
We incurred a net loss of $202 million for the combined 2010 year-end period. Amounts expressed in constant dollar terms exclude the effect of changes in foreign currency exchange rates on the translation of foreign currency results into U.S. dollars. For additional information regarding these financial measures, including a reconciliation of our non-GAAP measures to the most directly comparable measure presented in accordance with United States GAAP, see “Summary and pro forma consolidated financial data” included elsewhere in this prospectus. For additional information regarding foreign currency translation, see “Management’s discussion and analysis of financial condition and results of operations—Results excluding the effect of foreign currency translation and certain charges” included elsewhere in this prospectus.
Our market opportunity
We compete in the global information, technology and services market for the life sciences and the broader healthcare industry. Historically, we concentrated our efforts in the market for information and consulting services primarily supporting the commercial functions of life sciences organizations, which we estimate to be a $5 billion market. In response to the needs of a broader set of life sciences clients for more specialized information, such as longitudinal anonymous patient data and clinical trial analytics, we have expanded our offerings to serve the market for information and services, which we estimate to be a $22 billion market. In addition, in response to our life sciences clients’ need to streamline operations, we offer an expanded range of technology services that include data warehousing, IT outsourcing, software applications and other services in the broader market for IT services, which, together, represent an additional $28 billion market among our life sciences clients. As a result, we now operate across a life sciences marketplace for information and technology services that we estimate to be $50 billion. We also
84
Table of Contents
have newer offerings in the $25 billion market for information and technology services for payers and providers and view this rapidly expanding market as an opportunity for further growth.
We believe there are five key trends affecting our end markets that will create increasing demand for our information and technology services solutions:
Growth and innovation in the life sciences industry. The life sciences industry is a large and critical part of the global healthcare system, generating approximately $1 trillion in annual revenue. According to our research, revenue growth in the life sciences industry globally is expected to accelerate from 2.5% in 2013 to approximately 6% in 2017. The IMS Institute estimates that an average of 35 NMEs, are expected to be approved each year from 2013 to 2017, up from 25 NMEs in 2010 and a return to mid-2000s levels. The reacceleration of industry growth is also the result of dramatically lower expected patent expirations on prescription medications versus the recent past. Sales losses from drug patent expirations peaked at approximately $44 billion in 2012, significantly reducing commercialization initiatives among life sciences companies. By comparison, over the next five years, we expect sales losses from patent expirations to decline to under $16 billion by 2017, just over one-third of the 2012 peak.
Growth in access to healthcare in emerging markets. We believe there will be significant growth in healthcare spending in emerging markets, driven predominantly by a rapidly growing middle class in countries such as China and India. According to the IMS Institute, it is estimated that spending on pharmaceuticals in emerging markets will expand at a 10 to 13% CAGR through 2017. The rapid growth of emerging markets is making these geographies strategically important to life sciences organizations and, consistent with their approach in the mature markets, we expect these organizations to apply a high degree of sophistication to their commercial operations in these countries. For global companies, this requires highly localized knowledge and information assets, the development of market access strategies and benchmarking performance. In addition, local players are learning that they need to compete on the basis of improved information and analytics.
Financial pressures driving the need for increased efficiency. Despite expected accelerating growth in the global life sciences market, we believe our clients will face operating margin pressure due to their changing product mix, pricing and reimbursement challenges, and rising costs of compliance. Product portfolios for life sciences companies have shifted toward specialty products with lower peak market sales potential than traditional primary care medicines. Based on our research, we believe large pharmaceutical companies must collectively reduce costs by approximately $35 billion from 2012 to 2017 to maintain historic operating margins. As a result, our clients are looking for new ways to simplify processes and drive operational efficiencies including by using automation, consolidating vendors and adopting new technology options such as hosted and cloud-based applications. This provides opportunities for technology services vendors to capture and consolidate internal spending by providing lower-cost and variable-cost options that lower clients’ research and development selling, marketing and administrative costs.
Evolving need to integrate and structure expanding sources of data. Over the past decade, many health systems around the world have focused on digitizing medical records. While such records theoretically enhance access to data, relevant information is often unintegrated, unstructured, siloed in disparate software systems, or entered inconsistently. In addition, new sources of data from the internet, such as social media and information on limited patient pools,
85
Table of Contents
and information resulting from enhanced diagnostic technologies are creating new sources of healthcare data.
In order to derive valuable insights from existing and expanding sources of information, clients need access to statistically significant data sets organized into databases that can be queried and analyzed. For example, RWE studies demonstrate the practical and clinical efficacies, which we believe require the aggregation and integration of large clinical data sets across all care settings, types of therapies and patient cohorts. Longitudinal studies require analysis of anonymous patient diagnoses, treatments, procedures and laboratory test results to identify types of patients that will likely best respond to particular therapies. Finally, manufacturers also require the ability to analyze social media activity to identify the specific patient and advocacy groups that influence the adoption of new orphan drugs. This information is highly relevant to all healthcare stakeholders and we believe the opportunity to more broadly apply healthcare data can only be realized through structuring, organizing and integrating new and existing forms of data in conjunction with sophisticated analytics.
Need for demonstrated value in healthcare. Participants in the healthcare industry are focused on improving quality and reducing costs, both of which require assessment of quality and value of therapies and providers. As a result, physicians no longer make prescribing decisions in isolation, but rather in the context of guidance and rules from payers, integrated delivery networks and governments. We believe life sciences companies are working to bring alignment across constituents on the value of their treatments in order to successfully develop and commercialize new therapies.
There is increasing pressure on life sciences companies to support and justify the value of their therapies. Many new drugs that are being approved are more expensive than existing therapies, and will likely receive heightened scrutiny by payers to determine whether the existing treatment options would be sufficient. Additionally, many new specialty drugs are molecular-based therapies and require a more detailed understanding of clinical factors and influencers that demonstrate therapeutic value. As a result, leading life sciences companies are utilizing more sophisticated analytics for insight-driven decisions.
We believe we are well positioned to take advantage of these global trends in healthcare. Beyond our proprietary information assets, we have developed key capabilities to assess opportunities to develop and commercialize therapies, support and defend the value of medicines and help our clients operate more efficiently through the application of insight-driven decision-making and cost-efficient technology solutions.
Our strengths
Comprehensive information assets and collection network. The scale of our information assets, breadth and depth of our data supplier network, and our global reach are distinct advantages as clients value quality, consistency and continuity across geographies to accurately measure trends and their performance. With over 10 petabytes of proprietary data sourced from over 100,000 data suppliers covering over 780,000 data feeds globally, we have one of the largest and most comprehensive collections of healthcare information in the world, which includes over 500 million comprehensive, longitudinal anonymous patient records. Based on this data, we deliver information and insights on approximately 90% of the world’s pharmaceuticals, as measured by sales revenue. We have proprietary healthcare data management and projection methodologies developed over a long history, which enable us to extrapolate more precise
86
Table of Contents
insights from large-scale databases to provide greater granularity and segmentation for our clients. We continue to invest in new technology to source data that is valued by our clients, including social media analytics and mobile health solutions to continuously add records to our data sets, and refine our information and analytic methods. Use of our proprietary encryption technologies allows anonymous information to be linked across different care settings and across data sets, resulting in more complete healthcare information about anonymous patients and a deeper understanding of real world treatment, cost and outcomes.
Scaled healthcare specific technology infrastructure. To manage our proprietary, global information base, we have built what we believe is one of the largest and most sophisticated information technology infrastructures in healthcare. By processing data from over 45 billion healthcare transactions annually, our infrastructure connects complex healthcare data while applying a wide range of privacy, security, operational, legal and contractual protections for data in response to local law, supplier requirements and industry leading practices. We have four Centers of Excellence and five operation hubs around the world, and approximately 9,500 associates, including over 1,200 experts in areas such as biostatistics, data science, bioinformatics, healthcare economics, outcomes research, epidemiology, pharmacology and key therapeutic areas. Our distributed global operations infrastructure allows us to support client deliverables 24 hours a day, seven days a week, in more than 100 countries. We believe the scale, global footprint and connectivity our infrastructure provides is unique within the healthcare vertical and will be of increasing value to our clients in a period where cost pressures will grow.
As part of our information technology infrastructure, we employ a wide variety of proprietary technologies and processes to source, collect, cleanse, bridge, edit and organize data. We then apply a combination of sophisticated computer processing, statistical sampling and projection procedures, advanced analytics, forecasting methodologies and our skills and experience to create and deliver our offerings to clients. The following is an overview of the technologies and processes we employ:
| • | Data Sourcing. We collect information from a wide variety of data suppliers, including manufacturers, wholesalers, pharmacies, physicians, hospitals, laboratories, health plans and other payors, governments, services organizations, information technology vendors, patients and others. We are able to collect information in a wide variety of formats and through various methods of delivery. We frequently license some of our proprietary technologies (e.g., encryption programs, data standardization algorithms, data editing and collection software) to data suppliers to support the accurate and privacy-enhanced collection of data by the supplier and secure delivery of that data to us. |
| • | Data Receipt. We work closely with data suppliers to support the timely and secure delivery of data to us. Following receipt of data from our suppliers, we employ a variety of initial quality control checks and processes (based on proprietary metrics and parameters) to ensure data has been properly delivered to us. |
| • | Data Editing / Validation. Following data receipt and initial quality control checks, we use proprietary data cleansing, editing, and other sophisticated tools (based on proprietary metrics, parameters and methodologies) to find and resolve data quality issues in the data supplied to us. |
| • | Data Bridging / Reference Files. We receive data relating to tens of millions of transactions each week. To standardize data for each transaction, which is received from a wide variety of sources who frequently use their own proprietary reference numbers and codes, and allow |
87
Table of Contents
| for alignment of the data prior to projection or aggregation, we bridge (i.e., link) information received from suppliers to our reference files. We develop and maintain these reference files for various types of information, including medicines, diagnoses, treatment modalities, distribution centers, health care offices, integrated health networks, insurance plans and data classification schemes. |
| • | Database Management. When data has successfully passed through the processes referenced above, it is added to applicable IMS databases. In connection with the movement of the information to these databases, we employ additional quality control checks and processes. |
| • | Projection Methodologies. Most of our offerings are derived from the use of statistically representative samples. More than 100 statisticians support the development of proprietary sample designs and projection methodologies to estimate activities to achieve a high degree of accuracy. |
| • | Estimation Methodologies. For our larger datasets, we employ data imputation methods that allow us to estimate for any missing or questionable data until the underlying issue is resolved. By using these estimation methodologies, analysis has shown our offerings are more accurate and not prone to trending aberrations caused by issues in the data flow process. |
| • | Client Reports. After the completion of the processes described above, we are ready to create reports and other information deliverables for client based on their specifications. We employ various methods of report delivery, including secure portals, software-as-a-service, direct delivery of data into client data warehouses or direct delivery to mobile devices. |
Highly differentiated technology services fully integrated with IMS information. Our ability to integrate technology services with our data creates mission-critical, actionable intelligence that improves our overall value proposition to our clients. Our expanding set of sophisticated human capital resources and technology services offerings combined with our deep understanding of our scaled information assets provides what we believe to be a competitive advantage in an environment where clients require better performance. For example, in 2012, we introduced our healthcare-specific intelligent cloud, IMS One, which helps our clients fully recognize the benefits of our infrastructure. Our cloud is unique in the healthcare industry because it pre-integrates applications with IMS data and provides interoperability across IMS and third party applications. We believe that these benefits both reduce complexity associated with data integration and save our clients time and costs and in synchronizing data across application. We envision that over time IMS One will become an industry standard around which applications are hosted and information shared on an interoperable basis.
Long standing client relationships that are expanding. The breadth of the intelligent, actionable information we provide is not comprehensively available from any other source and would be difficult and costly for another party to replicate. We believe our information and technology services are deeply integrated into our clients’ workflow. We maintain long-standing relationships and high renewal rates with clients due to the value of the services and solutions we provide, as well as support the need for globally consistent information to enable comprehensive trend analysis at the local, regional, national and multi-country levels. For example, we believe the majority of pharmaceutical companies across more than 50 countries rely on our information to monitor the performance of their sales representatives and use it as a key factor in making ongoing compensation decisions. The average length of our relationships
88
Table of Contents
with our top 25 clients, as measured by 2013 revenue, is over 25 years and our retention rate for our top 1,000 clients from 2012 to 2013 was over 99%. Serving over 5,000 clients creates significant opportunity to expand breadth of services we provide to our clients.
Unique and scalable operating model. We believe we have an attractive operating model due to the scalability of our solutions, the recurring nature of our revenue and the low capital intensity/high free cash flow conversion of our business. Our global infrastructure and healthcare focus allows us to provide large-scale healthcare data, technology and service solutions to clients rapidly and cost-effectively. In 2013, our revenue generated by information offerings represented approximately 60% of our total revenue, approximately 90% of which came from subscription or licensed-based contracts in each of the last three fiscal years and, as a result, has historically been recurring and predictable. Given the fixed-cost nature of our data, we are able to scale our solutions quickly and at low marginal cost. Revenue from our technology services offerings represented approximately 40% of our total revenue, consisting of a mix of projects, large-scale engagements, multi-year outsourcing contracts and multi-year software licenses with approximately 35% being recurring in nature. Additionally, we have executed a multi-year plan to streamline our organization and enhance our technology platform to accommodate more complex analytics and significant additional data volumes with limited incremental costs. We believe our recurring revenue, combined with our leading offerings will continue to contribute to our long-term growth and strong operating margins and flexibility in allocating capital.
Our growth strategy
We believe we are well positioned for continued growth across the markets we serve. Our strategy for achieving growth includes:
Build upon our extensive client relationships. We have a diversified base of over 5,000 clients in over 100 countries, and have expanded our client value proposition since the Merger to now address a broader market for information and technology services which we estimate to be $50 billion. Through the development of IMS One and focused internal and external development of key client applications, such as CRM, channel management, incentive compensation, social media and clinical trials optimization, we have built a platform that allows us to be a more complete partner to our clients. We believe we are in the early stages of penetrating this expanding market within our global life sciences client base. Key elements of this strategy include:
| • | further integrating our existing services to provide clients with interoperable solutions; |
| • | increasing the number of clients that leverage our technology services offerings, including IMS One; |
| • | using our global presence and efficient operating model to scale new applications and solutions rapidly and efficiently across clients, markets and geographies; and |
| • | expanding the number of clients that choose to drive efficiencies by consolidating their vendor needs with us. |
Capitalize on our presence in emerging markets. We believe China, India, Brazil and Russia, together with many of the 50-plus other emerging markets in which we operate, will accelerate their healthcare spending over the next five years. We have an established presence in these markets, generating $440 million of revenue for 2013 (approximately 17% of our revenue) and growing at an 11% constant dollar CAGR since 2010. We serve both multinational companies and
89
Table of Contents
local clients. For example, China has over 5,000 domestic pharmaceutical companies, a number of which are large with global aspirations. Key elements of this strategy include:
| • | partnering with existing life sciences clients as they expand their businesses into emerging markets; |
| • | continuing to grow our existing services in emerging markets while simultaneously introducing new services drawn from our global portfolio; and |
| • | building relationships with local companies that are expanding beyond their home markets by capitalizing on the global credibility and consistency of our platform. |
Continue to innovate. We believe a significant opportunity exists to continue to enhance our information and analytics offerings and expand our technology services offerings to capitalize on the evolving healthcare environment. Our recent investments in human capital, technology and services capabilities position us to continue to pursue rapid innovation within the life sciences sector and the broader healthcare marketplace. Examples of recent innovations include:
| • | development of applications in the mobile health space including AppScript, an enterprise solution for providers and payers to establish a curated formulary of mobile applications that can be prescribed securely and reconciled by prescribers just like drug prescriptions, and AppNucleus, which allows developers to build mobile applications with secure containers for patient information on devices and secure communication channels to physicians and other applications; and |
| • | development of Evidence360, a collection of specialized technologies for RWE, including tailor-made data warehouses integrating our data sets with patient registries and a cohort builder tool facilitating efficient definitions and tracking of narrow cohorts to determine outcomes in small patient populations. |
Expand portfolio through strategic acquisitions. We have and expect to continue to acquire assets and businesses that strengthen our value proposition to clients. We have developed an internal capability to source, evaluate and integrate acquisitions that have created value for stockholders. Since the beginning of 2011, we have invested approximately $586 million of capital in 22 acquisitions. As the global healthcare landscape evolves, we expect that there will be a growing number of acquisition opportunities across the life sciences, payer and provider sectors. We will continue to invest in strategic acquisitions to grow our platform and enhance our ability to provide more services to our clients and expect to seek opportunities, primarily in the areas of technological platforms, data suppliers and consulting services providers.
Expand the penetration of our offerings to the broader healthcare marketplace. We believe that substantial opportunities exist to expand penetration of our addressable market and further integrate our offerings in a broader cross-section of the healthcare marketplace. Key elements of this strategy include:
| • | continuing to sell innovative solutions to life sciences clients in areas we have recently entered, such as clinical trial analytics; |
| • | leveraging our comprehensive collection of healthcare information to provide critical insights to payers and providers, enabling advanced patient analytics and population health management; and |
90
Table of Contents
| • | utilizing our proprietary information and analytics to address the evolving needs of the broader healthcare marketplace. The development of our MD360 Provider Performance Management platform highlights augmentation of our core capabilities to penetrate a new and growing area of healthcare information management by using our proprietary library of clinical and cost measures to determine and publish highly specific performance targets for providers. |
Our offerings
We offer hundreds of distinct services, applications and solutions to help our clients make critical decisions and perform better. While historically our offerings focused mainly in information and analytics, we now routinely integrate information with technology services to ensure our clients receive the most value from our information to enable them to incorporate insights into their workflow. These offerings complement each other and can provide enhanced value to our clients when delivered together, with each driving demand for the other.
Our principal offerings include:
National information offerings. Our national offerings comprise unique services in more than 70 countries that provide consistent country level performance metrics related to sales of pharmaceutical products, prescribing trends, medical treatment and promotional activity across multiple channels including retail, hospital and mail order. These products are an integral part of critical processes in life science companies around the world and are also used extensively by the investment and financial sectors that deal with life science companies. Clients use these products to measure relative performance, assess market opportunity, determine brand and company strategy, and understand market dynamics. The products are available in a range of frequencies from weekly to annually, and are delivered in a variety of formats, including online hosted, PCs and mobile platforms.
Sub-national information offerings. Our sub-national offerings comprise unique services in more than 50 countries that provide a consistent measurement of sales or prescribing activity at the regional, zip code and individual prescriber level (depending on regulation in country). These products are used extensively, with a majority of pharmaceutical sales organizations within these countries dependent on these services to set goals, determine resourcing, measure performance and calculate compensation.
Commercial services. We provide a broad set of strategic, analytic and support services to help the commercial operations of life sciences companies successfully transform their commercial models, engage more effectively with the marketplace and reduce their operating costs. Our global consulting teams leverage local market knowledge, therapeutic expertise and our global information resources to assist our clients with portfolio, brand and commercial strategy, pricing and market access. We leverage our global technology infrastructure and deep understanding of information and our clients’ operations to provide workflow analytics services to sales operations, market research and managed markets and provide clients with interoperable solutions rather than individual products and services.
Real-World Evidence (RWE) solutions. We integrate information from medical claims, prescriptions, electronic medical records, biomarkers and government statistics into anonymous, longitudinal patient journeys that provide detailed views of treatment patterns, disease progression, therapeutic switching and concomitant diseases and treatments. Combined with our
91
Table of Contents
health economics and outcomes research expertise, we leverage this information to help biopharmaceutical companies, health plans, providers and government agencies evaluate how treatments perform in real-world settings.
Commercial technology solutions. We provide an extensive range of hosted and cloud-based applications and associated implementation services. The applications, hosted on IMS One, support a wide range of commercial processes including multi-channel marketing, CRM, performance management, incentive compensation, territory alignment, roster management and call planning. These solutions are used by sales and marketing operations to manage, optimize and execute their sales activities and brand campaigns. We combine our data, expert analysis and therapeutic knowledge to create a SaaS based analytics solution called AnalyticsLink. Based on proprietary linking and integration of our country data sets into a global repository, we provide an offering called MIDAS which provides a leading source of insight into international market dynamics and is used by most large pharmaceutical companies.
Clinical solutions. By bringing together our information with advanced predictive modeling technology and sophisticated data visualization software, we help biopharmaceutical companies and CROs better design, plan, execute and track clinical trials. Our solutions allow our clients to dynamically model the size of patient populations for specific clinical protocols, estimate time and cost to recruit patients given a specific protocol and investigator selection, and optimize country allocation and patient recruitment. For payers and providers, we integrate client data with our information and proprietary analytics, to enable risk-sharing and pay-for-performance programs, network design and management, and population health management.
Our data suppliers
We maintain a diverse supplier base to support the information needs of our clients. Over the past six decades, we have developed and maintained strong relationships with data suppliers in each market in which we operate. These suppliers include manufacturers, wholesalers, pharmacies, physicians, hospitals, laboratories, health plans and other payors, governments, services organizations, information technology vendors, patients and others. We frequently license IMS proprietary technologies (e.g., encryption programs, data standardization algorithms, data editing and collection software) to data suppliers to support the accurate and privacy-enhanced collection of data by the supplier and secure delivery of that data to us. We have historical connections with many of the relevant trade associations and professional associations. We devote significant human and financial resources to our data collection efforts and are adding new suppliers and new data sources every year to provide the most relevant information to our clients. Many of our data suppliers are also clients. For example, we offer performance monitoring and segmentation services to retail pharmacies, services that have become critical to supporting retailer growth objectives. Developing and providing services to suppliers supports a continuation of long-term supply relationships.
Our contractual arrangements with our data suppliers number in the thousands. Typical data supply contracts specify the data to be provided to us, the frequency of data delivery (e.g., daily, weekly, monthly), data quality obligations, data use rights, and consideration provided by us in exchange for the data (e.g., reports, services, remuneration). These contracts are tailored based on the type of data collected, the market, local law and the negotiated outcome with each counterparty and therefore can vary significantly in their terms. These contracts reflect a range of commitment terms from one year to ten years, with larger data supply contracts typically having a contract term of five years.
92
Table of Contents
Our technology
We maintain what we believe is one of the largest and most sophisticated information technology infrastructures in healthcare globally. Our distributed global operations infrastructure supports client deliverables 24 hours a day, seven days a week, in more than 100 countries. Our primary data center located in Carlstadt, New Jersey manages and operates our technology infrastructure and our global network, which serves as the backbone for processing over 45 billion healthcare transactions annually. In addition, we maintain COEs and operations hubs around the world, each with a focus area of expertise.
| • | In India, a team of over 1,200 technology experts support services delivery, software development and data management. Analytical services are deployed using common methodologies across each offering to promote consistent quality for each client deliverable. |
| • | In Manila, The Philippines, we combine IT and medical resources (with over 500 specialists in healthcare and IT) to clean and standardize information from data suppliers around the world. |
| • | Beijing, China is home to our innovative and proprietary statistical methodologies. More than 200 experts manage the statistical validity of data worldwide and guide how the data can be used. |
| • | In Madrid, Spain, our experts code and manage core reference data worldwide. More than 200 IT and medical specialists with native skills in over 15 languages link information assets through in-house developed software platforms for master data management. |
| • | Our Offering Development and Delivery hubs are based in London, United Kingdom, Plymouth Meeting, Pennsylvania, and in San Francisco, California. Our product development teams leverage methodologies to release technology platforms and business intelligence tools that facilitate our clients’ ability to gain insight into information. Our applications are deployed on a common technical architecture allowing re-use across geographical locations and providing a common interface for end users. |
| • | Central and regional production focused COEs are located across the globe to efficiently support the delivery of IMS services. The Manila COE is the main global hub that provides cleaning and standardizing services, production management, and quality control operations. We selected Manila because there is wide availability of relevant healthcare skills, English is a first language, and it provides an efficient cost structure. The Madrid COE focuses on maintaining our reference management operations. The Chile based OCLA Regional hub provides time zone sensitive production services to the Latin America, Canada and U.S. business units. The Istanbul hub provides language specific production services to the North Africa, South Europe, Middle East and East Europe regions. In contrast to the central hubs, the regional hubs are generally focused on activities that are more dependent on specific languages or in some cases where we need alignment of time zones. |
Our clients
Sales to companies in life sciences, including pharmaceutical companies, biotechnology companies, device and diagnostic companies, and consumer health companies, accounted for approximately 90% of our revenue in 2013. Nearly all of the top 100 global pharmaceutical and biotechnology companies, measured by revenue, are clients, and many of these companies subscribe to reports and services in many countries. Other clients include payers, government and
93
Table of Contents
regulatory agencies, providers, pharmaceutical distributors, and pharmacies. Our client base is broad in scope and enables us to avoid dependence on any single client. No single client individually accounted for greater than 8% of our gross revenue in 2013, 2012 and 2011.
Our competition
We compete with a broad and diverse set of businesses. While we believe no competitor provides the combination of geographical reach and breadth of our services, we generally compete in the countries in which we operate with other information, analytics, technology, services and consulting companies, as well as with the in-house capabilities of our clients. Also, we compete with certain government agencies, private payers and other healthcare stakeholders that provide their data directly to others. In addition to country-by-country competition, we have a number of regional and global competitors in the marketplace as well. Our offerings compete with various firms, including Accenture, Cognizant Technology Solutions, Covance, Deloitte, Evidera, GfK, Health Market Science, IBM, Infosys, inVentiv Health, Kantar Health, McKinsey, Nielsen, OptumInsight, Parexel, Press Ganey, Quintiles, RTI Health Solutions, Symphony Health Solutions, Synovate Healthcare, The Advisory Board, Trizetto, Verisk and ZS Associates. We also compete with a broad range of new entrants and start-ups that are looking to bring new technologies and business models to healthcare information services and technology services.
Privacy management and security
Patient health information is among the most sensitive of personal information, and it is critically important that information about an individual’s healthcare is properly protected from inappropriate access, use and disclosure. For decades, our market research business was built using health information that did not identify a patient—long before the passage of HIPAA or other privacy laws. We continue to engage in strong privacy and security practices in the collection, processing, analysis, reporting and use of information. We employ a wide variety of methods to manage privacy and security, including:
| • | governance, frameworks and models to promote good decision making and accountability; |
| • | a layered approach to privacy and security management to avoid a single point of failure; |
| • | ongoing evaluation of privacy and security practices to promote continuous improvement; |
| • | use of safeguards and controls, including: |
| • | technical safeguards—for example, technology and related policies and procedures to protect healthcare information and control access to it; |
| • | administrative safeguards—for example, administrative actions and related policies and procedures to manage the selection, development, implementation and maintenance of measures to protect healthcare information; |
| • | physical safeguards—for example, physical measures and related policies and procedures to protect electronic information systems and related buildings and equipment from natural and environmental hazards, and unauthorized intrusion; |
| • | collaboration with data suppliers and trusted third parties for our syndicated data offerings to remove identifiable information or employ effective encryption or other techniques to render information anonymous before data is delivered to us; and |
94
Table of Contents
| • | working closely with leading researchers, policy makers, thought leaders and others in a variety of fields relevant to the application of effective privacy and security practices, including statistical, epidemiological and cryptographic sciences, legal, information security and compliance, and privacy. |
Our intellectual property
We create, own and maintain a wide array of intellectual property assets which, in the aggregate, are of material importance to our business. Our intellectual property assets include: patents and patent applications related to our innovations, products and services; trademarks and trademark applications related to our brands, products and services; copyrights in software and databases; trade secrets relating to data processing, statistical methodologies, editing and bridging techniques, business rules and other aspects of our business; and other intellectual property rights and licenses of various kinds. We are licensed to use certain technology and other intellectual property rights owned and controlled by others, and, similarly, other companies are licensed on a non-exclusive basis to use certain technology and other intellectual property rights owned and controlled by us.
We seek to protect our intellectual property assets through patent, copyright, trade secret, trademark and other laws of the United States and other jurisdictions, and through confidentiality procedures and contractual provisions. A patent generally has a term of 20 years from the time the full patent application is filed. As we build a patent portfolio over time, the terms of individual patents will vary. While patents can help maintain the competitive differentiation of certain products and services and maximize the return on research and development investments, no single patent is in itself essential to our business as a whole. Further, in order to replace expiring patents and licenses or replace obsolete intellectual property, we attempt to obtain new intellectual property through protection of key innovation from a combination of our ongoing research and development activities, acquisitions of other companies and licensing of intellectual property from third parties. We enter into confidentiality and invention assignment agreements with employees and contractors, and non-disclosure agreements with third parties with whom we conduct business, in order to secure ownership rights to, limit access to, and restrict disclosure of our proprietary information.
The technology and other intellectual property rights owned and licensed by us are of importance to our business, although our management believes that our business, as a whole, is not dependent upon any one intellectual property or group of such properties. We consider our trademark and related names, marks and logos to be of material importance to our business, and we have registered or applied for registration for certain of these trademarks including IMS Health, IMS, the IMS logo, IMS One, MIDAS, Xponent, DDD, AppScript, AppNucleus and Evidence360, in the United States and other jurisdictions and aggressively seek to protect them.
Our employees
As of the date of this prospectus we have approximately 9,500 employees worldwide. Almost all of these employees are full-time. None of our U.S. employees are represented by a union. In Belgium, France, Germany, Italy, the Netherlands and Spain, we have Works Councils, which are a legal requirement in those countries. We also have a European Works Council, which is a requirement under European Union laws. Management considers its relations with our employees to be good and to have been maintained in a normal and customary manner.
95
Table of Contents
Properties
Our executive offices are located at 83 Wooster Heights Road, Danbury, Connecticut in a leased property (approximately 24,000 square feet).
Our property is geographically distributed to meet our sales and operating requirements worldwide. Our properties and equipment are generally considered to be both suitable and adequate to meet current operating requirements and virtually all space is being utilized.
As of the date of this prospectus we own one property in the United States located in Pennsylvania (approximately 17,000 square feet).
Our active owned properties located outside the United States include: one property in Buenos Aires, Argentina (approximately 12,000 square feet); one property in Caracas, Venezuela (approximately 8,800 square feet); two properties in Los Ruices, Venezuela (approximately 4,000 square feet); and one property in Lisbon, Portugal (approximately 10,000 square feet). We have also entered into an agreement to purchase one facility in Bangalore, India (approximately 374,000 square feet), which we expect to close prior to the closing of this offering.
Our operations are also conducted from 26 leased offices located throughout the United States and 93 leased offices in non-U.S. locations.
We own or lease a variety of computers and other equipment for our operational needs. We continue to upgrade and expand our computers and related equipment in order to increase efficiency, enhance reliability and provide the necessary base for business expansion.
Legal proceedings
As a company operating in more than 100 countries, we are involved in a variety of legal and tax proceedings, claims and litigation that arise from time to time in the ordinary course of business. These actions may be commenced by various parties, including competitors, clients, current or former employees, government agencies or others. We record a provision with respect to a proceeding, claim or litigation when it is probable that a liability has been incurred and the amount of the loss can be reasonably estimated. However, even in instances where we have recorded an estimated liability, we are unable to predict with certainty the final outcome of the matter or whether resolution of the matter will materially affect our results of operations, financial position or cash flows. As additional information becomes available, we adjust our assessment and estimates of such liabilities accordingly.
Further, we routinely enter into agreements with our suppliers to acquire data and with our clients to sell data, all in the normal course of business. In these agreements, we sometimes agree to indemnify and hold harmless the other party for any damages such other party may suffer as a result of potential intellectual property infringement and other claims related to the use of the data. We have not accrued liability with respect to these matters, as the exposure is considered remote.
Based on our review of the latest information available, management does not expect the impact of pending tax and legal proceedings, claims and litigation, either individually or in the aggregate, to have a material adverse effect on our results of operations, cash flows or financial position. However, one or more unfavorable outcomes in any claim or litigation against us could have a material adverse effect for the period in which it is resolved. The following is a summary of the more significant legal matters involving the company.
96
Table of Contents
On June 5, 2009, Associacao Nacional de Farmacias (“ANF”) and Farminveste – Investimentos, Participacoes e Gestuo, S.A. (“Farminveste”) filed claims against IMS Health Portugal, Lda. (“IMS Portugal”) for breaching a 2008 agreement among the parties for approximately €21 million. IMS Portugal counterclaimed against ANF and Farminveste for approximately €19 million for damages and loss. In 2011, the Arbitration Tribunal ruled that ANF was liable to IMS Portugal for up to €14 million for damage caused to IMS Portugal’s business. The actual amount of damages will be adjudicated in a separate proceeding before the Lisbon Court of First Instance and the date has yet to be set. Prior to the commencement of the arbitration proceeding, the Lisbon Court of First Instance separately seized approximately €18.3 million from IMS Portugal in a non-interest bearing court escrow account. Under Portuguese civil procedure, the seized funds will remain in court escrow until there is a final and unappealable judicial judgment in respect of the arbitration proceeding. The arbitration decision was appealed by ANF in June 2011. The appeal will be heard before the Lisbon Court of Appeals, and either party will subsequently have a further right of appeal to the Supreme Court of Portugal.
On July 24, 2013, Symphony Health Solutions and two of its subsidiaries (collectively “Symphony”) filed a lawsuit in the U.S. District Court for the Eastern District of Pennsylvania against IMS Health alleging anticompetitive business practices in violation of the Sherman Antitrust Act and Pennsylvania state law. The complaint seeks trebled actual damages in an unspecified amount, punitive damages, costs and injunctive relief. IMS Health asserted various counterclaims against Symphony, including for misappropriation of trade secrets , tortious interference and unfair competition. We believe the complaint is without merit, reject all claims raised by Symphony and intend to vigorously defend IMS Health’s position and pursue the counterclaims.
On December 20, 2013, IMS Health filed a lawsuit in the U.S. District Court for the District of Delaware against Symphony for infringement of three patents seeking injunctive relief and damages. While we intend to vigorously litigate these patents and pursue our legal rights, we can offer no assurance as to when the pending litigation will be decided or whether the lawsuit will be successful.
Our wholly-owned subsidiary, IMS Government Solutions Inc., is primarily engaged in providing services and products under contracts with the U.S. government. U.S. government contracts are subject to extensive legal and regulatory requirements and, from time to time, agencies of the U.S. government have the ability to investigate whether contractors’ operations are being conducted in accordance with such requirements. IMS Government Solutions discovered potential noncompliance with various contract clauses and requirements under its General Services Administration Contract (the “GSA Contract”) which was awarded in 2002 to its predecessor company, Synchronous Knowledge Inc. (Synchronous Knowledge Inc. was acquired by IMS Health in May 2005). The potential noncompliance arose from three primary areas: first, at the direction of the government, work performed under one task order was invoiced under another task order without the appropriate modifications to the orders being made; second, personnel who did not meet strict compliance with the labor categories component of the qualification requirements of the GSA Contract were assigned to contracts; and third, certain discounts that were given to commercial customers were not also offered to the government, in alleged violation of the GSA Contract’s Price Reductions Clause. Upon discovery of the potential noncompliance, we began remediation efforts, promptly disclosed the potential noncompliance to the U.S. government, and were accepted into the Department of Defense Voluntary Disclosure Program. We filed a Voluntary Disclosure Program Report on August 29, 2008. We are currently unable to determine
97
Table of Contents
the outcome of these matters pending the resolution of the Voluntary Disclosure Program process and the ultimate liability arising from these matters could exceed its current reserves.
For additional information, see Note 12 to our consolidated financial statements for the year ended December 31, 2013 included elsewhere in this prospectus and “Risk factors—Risks related to our business—Litigation or regulatory proceedings could have a material adverse effect on our operating results and financial condition.”
98
Table of Contents
Executive officers and directors
Below is a list of the names, ages as of date of this prospectus, positions and a brief account of the business experience of the individuals who serve as our executive officers and directors as of the date of this prospectus.
| Name | Age | Position | Director/officer of IMS since | |||
|
| ||||||
| Ari Bousbib |
52 | Director; Chairman, Chief Executive Officer & President | 2010 | |||
| Ronald E. Bruehlman |
53 | Senior Vice President & Chief Financial Officer | 2011 | |||
| Harvey A. Ashman |
51 | Senior Vice President, General Counsel, External Affairs & Corporate Secretary | 2009 | |||
| Kevin C. Knightly |
53 |
Senior Vice President, Supply Management | 2006 | |||
| Stefan C. Linn |
48 | Senior Vice President, Strategy & Global Pharma Solutions | 2010 | |||
| Satwinder Sian |
49 | Senior Vice President, Global Technology & Operations | 2010 | |||
| Paul M. Thomson |
64 | Senior Vice President, Human Resources & Administration | 2010 | |||
| José Luis Fernández |
49 | Senior Vice President, Global Services | 2014 | |||
| André Bourbonnais |
51 | Director | 2010 | |||
| John G. Danhakl |
57 | Director | 2010 | |||
| David Lubek |
34 | Director | 2013 | |||
| Sharad S. Mansukani |
44 | Director | 2010 | |||
| Nehal Raj |
35 | Director | 2011 | |||
| Jeffrey K. Rhodes |
39 | Director | 2011 | |||
| Ronald A. Rittenmeyer |
66 | Director | 2010 | |||
| Todd B. Sisitsky |
42 | Director | 2010 | |||
| Bryan M. Taylor |
43 | Director | 2010 | |||
|
| ||||||
Ari Bousbib, Chairman, Chief Executive Officer & President, Director
Mr. Bousbib was appointed Chief Executive Officer of IMS Health in August 2010 and was appointed to the additional role of Chairman in December 2010. Prior to joining IMS Health, Mr. Bousbib spent 14 years at United Technologies Corporation (“UTC”). From 2008 until 2010, he served as President of UTC’s Commercial Companies. From 2002 until 2008, Mr. Bousbib was President of Otis Elevator Company, and from 2000 to 2002 he served as its Chief Operating Officer. Previously, Mr. Bousbib was a partner at Booz Allen Hamilton. Mr. Bousbib currently
99
Table of Contents
serves on the board of directors of The Home Depot, Inc., and is a member of the Harvard Medical School Health Care Policy Advisory Council. He previously served on the board of directors of Best Buy, Inc. Mr. Bousbib holds a Master of Science Degree in Mathematics and Mechanical Engineering from the Ecole Superieure des Travaux Publics, Paris, and an M.B.A from Columbia University. Because of Mr. Bousbib’s extensive leadership experience, we believe he is well qualified to serve on our board of directors.
Ronald E. Bruehlman, Senior Vice President and Chief Financial Officer
Mr. Bruehlman was appointed Senior Vice President and Chief Financial Officer of IMS Health in July 2011. Prior to joining IMS, he worked for 23 years at UTC, advancing through finance positions of increasing responsibility. He was Vice President, Operations Planning and Analysis, of UTC’s Commercial Companies from 2008 to 2010. From June 2009 until April 2011, Mr. Bruehlman also held the role of Vice President, Business Development for UTC, where he led the corporation’s global strategy and development activities. From June 2005 until May 2008, he was Vice President and Chief Financial Officer of Carrier Corporation. Prior to that, Mr. Bruehlman was Vice President, Financial Planning and Analysis for UTC and also served as Director, Investor Relations of UTC. Mr. Bruehlman holds a B.S. in Economics from the University of Delaware, and an M.B.A. from the University of Chicago.
Harvey A. Ashman, Senior Vice President, General Counsel, External Affairs and Corporate Secretary
Mr. Ashman was appointed Senior Vice President, General Counsel, External Affairs and Corporate Secretary of IMS Health in October 2009. He served as Vice President, External Affairs and Associate General Counsel for the Americas region from April 2008 until October 2009, and Vice President and Associate General Counsel for the Americas region from April 1999 until April 2008. Mr. Ashman joined IMS Health’s predecessor company, IMS International, Inc., in October 1988 as a staff attorney and has held roles of increasing responsibility from that time through the present. Mr. Ashman holds a B.A. from the University of Massachusetts, Amherst, and a J.D. from the New England School of Law.
Kevin C. Knightly, Senior Vice President, Supply Management
Mr. Knightly was appointed Senior Vice President, Supply Management of IMS Health in January 2011 and served as Senior Vice President, Pharma Business Management from 2007 until 2010. Prior to that, Mr. Knightly served as President of the EMEA region. He has also served as Chief Financial Officer for IMS Health North America and Europe, and Senior Vice President, Marketing and Major Markets, EMEA. Mr. Knightly joined an IMS Health affiliate in 1983 and since then has held a number of senior financial, operations, marketing and general management posts. He holds a B.S. in Economics and Accounting from the College of the Holy Cross, and an M.B.A. from New York University’s Stern Business School.
Stefan C. Linn, Senior Vice President, Strategy and Global Pharma Solutions
Mr. Linn was appointed Senior Vice President, Strategy and Global Pharma Solutions of IMS Health in September 2012. He served as Senior Vice President, Strategy, Innovation and Development from January 2011 until September 2012, and Senior Vice President, Strategy and Business Development from October 2010 until January 2011. From March 2008 until October 2010, Mr. Linn was a Director at TPG. From August 2001 until March 2007, Mr. Linn was Senior
100
Table of Contents
Vice President at McKesson and also served as President of Health Mart Systems, Inc. Prior to that Mr. Linn was Vice President of Marketing at Merck-Medco from 1996 until 2001. He also worked for McKinsey & Company in London. Mr. Linn previously served as a director on the board of CliniWorks, Inc. from May 2011 to August 2013. He holds a B.A. in Economics from the University of Dallas, and an M.B.A. from the University of California at Berkeley.
Dr. Satwinder Sian, Senior Vice President, Global Technology & Operations
Dr. Sian began serving as Senior Vice President, Global Technology & Operations on January 1, 2014. He has held various leadership roles at IMS Health. He served as Senior Vice President, Global Technology Services & Operations from September 2012 until January 2014. From June 2011 until September 2012, Dr. Sian served as Senior Vice President, Global Pharma Solutions. From July 2010 until June 2011, he served as President, China. From January 2006 until June 2010, he was General Manager, Commercial Effectiveness. From 2003 until 2006 he managed the Consulting & Services business in EMEA. Dr. Sian also served as Vice President and General Manager, Consumer Health. He earned a Ph.D. in Information Technology from Imperial College, London, and holds an M.B.A. from the Management School, Open University in the United Kingdom.
Paul M. Thomson, Senior Vice President, Human Resources and Administration
Mr. Thomson was appointed Senior Vice President, Human Resources and Administration in January 2011. In October 2010, Mr. Thomson joined IMS Health as Senior Vice President, Human Resources following a 37-year career at UTC. At UTC he served as Vice President, Human Resources for Otis Elevator Company from 1998 to 2010. In this role, Mr. Thomson led the company’s worldwide human resources organization covering global operations with a combined employee population of 60,000. Prior to that, he held a number of human resources roles of increasing responsibility with UTC, including Vice President, Human Resources at Sikorsky Aircraft Corporation from 1991 to 1997; UTC Director, Compensation and Benefits from 1988 to 1991; and several human resources leadership roles at Otis Elevator and Pratt & Whitney. Mr. Thomson holds a B.S. in Sociology and an M.B.A. from the University of Connecticut. He also received an M.S. in Management from the Massachusetts Institute of Technology.
José Luis Fernández, Senior Vice President, Global Services
Mr. Fernández was appointed Senior Vice President, Global Services of IMS Health in January 2014. He was responsible for IMS Health’s South Europe & Middle East operations from 2010 through the end of 2013. From 2008 to 2010, Mr. Fernández served as general manager of IMS Health’s consulting and services business in EMEA, and prior to that was general manager of EMEA mid-size markets and Spain operations. Before joining IMS Health, Mr. Fernández held a variety of sales, marketing and commercial effectiveness roles with AstraZeneca in Europe. He began his career at Accenture as a management consultant focused on commercial strategy for the pharmaceutical, consumer goods and auto sectors. Mr. Fernández holds an advanced degree in Industrial Engineering from Madrid Polytechnic University.
André Bourbonnais, Director
Mr. Bourbonnais has served as a Director of IMS Health since February 2010. Mr. Bourbonnais has more than 20 years of experience in executing transactions and he is responsible for leading private equity investments in the CPPIB portfolio. Prior to joining CPPIB in 2006, Mr. Bourbonnais managed a combined private equity portfolio in financial services, telecommunications, media
101
Table of Contents
and entertainment sectors for another Canadian pension plan manager. Prior to that, he spent several years with a leading telecommunications company mostly as a senior officer responsible for corporate development and legal affairs. He also currently serves on the boards of directors of Anglian Water Group, Ltd., and serves as Chair of Air Distribution Technologies Inc. Mr. Bourbonnais holds an L.L.M. from the London School of Economics and Political Science, and an L.L.L. from the University of Ottawa. Because of his extensive experience in leadership and financial management, we believe Mr. Bourbonnais is well qualified to serve on our board of directors.
John G. Danhakl, Director
Mr. Danhakl has served as a Director of IMS Health since February 2010. He is Managing Partner at LGP, which he joined in 1995. Previously, Mr. Danhakl was a Managing Director of Donaldson, Lufkin & Jenrette Securities Corporation, which he joined in 1990. From 1985 until 1990, Mr. Danhakl was Vice President in corporate finance at Drexel Burnham Lambert, Inc. Mr. Danhakl currently serves on the boards of directors of the following publicly traded companies: Savers, Inc., J. Crew Group, Inc., Petco Animal Supplies, Inc. and Arden Group, Inc. He previously served as a director of Big 5 Sporting Goods Corporation, Communications & Power Industries, Diamond Triumph Auto Glass, Inc., Liberty Group Publishing, Inc., MEMC Electronic Materials, Inc., Phoenix Scientific, Inc., Rite Aid Corporation, VCA Antech, Inc., Air Lease Corporation and The Neiman Marcus Group, Inc. Mr. Danhakl holds a B.A. in Economics from the University of California at Berkeley, and an M.B.A. from Harvard Business School. Because of his extensive experience serving as a public company director and his knowledge of corporation finance, we believe Mr. Danhakl is well qualified to serve on our board of directors.
David Lubek, Director
Mr. Lubek has served as a director of IMS Health since October 2013. He is a Principal in the Direct Private Equity Group of CPPIB. Prior to joining CPPIB in 2008, Mr. Lubek worked at CIBC World Markets in the Mergers & Acquisitions investment banking group. He also is a Chartered Financial Analyst Charterholder. Mr. Lubek holds an M.B.A. from the Kellogg School of Management at Northwestern University, and a B.B.A. from the Schulich School of Business at York University. Because of his extensive experience in business and finance, we believe Mr. Lubek is well qualified to serve on our board of directors.
Sharad S. Mansukani, M.D., Director
Dr. Mansukani has served as a Director of IMS Health since April 2010. Dr. Mansukani has served as a TPG Senior Advisor since 2005. He serves on the board of directors of Surgical Care Affiliates, Inc., IASIS Healthcare Corp., Immucor Inc. and Par Pharmaceuticals Companies, Inc. Dr. Mansukani serves as Strategic Advisor to the board of directors of CIGNA and previously served as Vice Chairman of HealthSpring Inc. Dr. Mansukani also serves on the board of directors of the Children’s Hospital of Philadelphia and on the editorial boards of the American Journal of Medical Quality, Managed Care, Biotechnology Healthcare and American Health & Drug Benefits. Dr. Mansukani was appointed to Medicare’s Payment Advisory and Oversight Committee, and he was previously Senior Advisor to CMS and a member of the Medicare Reform Executive Committee. Dr. Mansukani previously served on the faculty at the University of Pennsylvania and at Temple University School of Medicine. Dr. Mansukani completed his residency and fellowship in ophthalmology at the University of Pennsylvania School of Medicine and a fellowship in
102
Table of Contents
quality management and managed care at the Wharton School of the University of Pennsylvania. Because of his extensive experience in leadership and the healthcare sector, we believe Dr. Mansukani is well qualified to serve on our board of directors.
Nehal Raj, Director
Mr. Raj has served as a Director of IMS Health since December 2011. Mr. Raj joined TPG in 2006, where he is a Principal and helps lead the firm’s investments in the technology sector. Prior to joining TPG, Mr. Raj was a technology private equity investor at Francisco Partners and a technology mergers and acquisitions professional at Morgan Stanley. Mr. Raj also serves as a director of Aptina Imaging, CCC Information Services, Decision Insight Information Group and Symbility Solutions, Inc., and previously was a director of Intergraph Corporation. He holds both an A.B. in Economics and an M.S. in Industrial Engineering and Engineering Management from Stanford University. He also holds an M.B.A from Harvard Business School. Because of his experience in finance and the technology industries, we believe Mr. Raj is well qualified to serve on our board of directors.
Jeffrey K. Rhodes, Director
Mr. Rhodes has served as a Director of IMS Health since December 2011. Mr. Rhodes is a Principal at TPG, where he is a leader of the firm’s investment activities in the healthcare services and pharmaceutical/medical device sectors. Mr. Rhodes serves on the board of directors of Biomet Inc., EnvisionRx, Immucor Inc., Par Pharmaceuticals Companies, Inc., and Surgical Care Affiliates, Inc. Prior to joining TPG in 2005, Mr. Rhodes worked at McKinsey & Company and Article 27 LTD, a start-up software company. Mr. Rhodes earned his M.B.A. from the Harvard Business School, where he was a Baker Scholar, and earned his B.A. in Economics from Williams College, where he graduated summa cum laude. Because of his extensive experience in healthcare services and corporate governance, we believe Mr. Rhodes is well qualified to serve on our board of directors.
Ronald A. Rittenmeyer, Director
Mr. Rittenmeyer has served as a Director of IMS Health since April 2010. He is Chairman, President and CEO of Expert Global Solutions, Inc. Previously, Mr. Rittenmeyer served as Chairman, CEO and President of Electronic Data Systems Corporation from 2005 until 2008. Prior to that, he served as Chief Operating Officer of Electronic Data Systems Corporation from October 2005 until September 2007 (including service as Co-Chief Operating Officer until May 2006) and as Executive Vice President, Global Service Delivery from July 2005 until December 2006. Mr. Rittenmeyer also serves on the boards of directors of American International Group, Inc. and Tenet Health Care Corporation. He previously served as a director of EDS and RH Donnelley (presently Dex One Corporation). Mr. Rittenmeyer holds a B.A. in Commerce and Economics from Wilkes University, and his M.B.A. from Rockhurst University. Because of his leadership experience, over 30 years of business experience and extensive experience serving on public company boards, we believe Mr. Rittenmeyer is well qualified to serve on our board of directors.
Todd B. Sisitsky, Director
Mr. Sisitsky has served as a Director of IMS Health since February 2010. Mr. Sisitsky is a Partner of TPG where he leads TPG’s investment activities in the healthcare sector globally. Mr. Sisitsky serves on the board of directors of Surgical Care Affiliates, Inc., Aptalis Holdings, Inc., formerly Aptalis Pharma, Inc., IASIS Healthcare Corp., HealthScope Ltd., Immucor Inc. and Par
103
Table of Contents
Pharmaceuticals Companies, Inc. and previously served on the boards of Biomet Inc. and Fenwal Inc. He also serves on the board of the Campaign for Tobacco Free Kids, a global not-for-profit organization, and the Dartmouth Medical School Board of Overseers. Prior to joining TPG in 2003, Mr. Sisitsky worked at Forstmann Little & Company and Oak Hill Capital Partners. Mr. Sisitsky earned an M.B.A. from the Stanford Graduate School of Business, where he was an Arjay Miller Scholar, and earned his undergraduate degree from Dartmouth College, where he graduated summa cum laude. Because of his extensive experience in leadership, business, and healthcare, we believe Mr. Sisitsky is well qualified to serve on our board of directors.
Bryan M. Taylor, Director
Mr. Taylor has served as a Director of IMS Health since February 2010. He joined TPG in March 2004, and is a Partner in the firm’s Technology Group, where he is responsible for investments in software, data/analytics and technology services. He was also involved in TPG’s investments in Alltel Communications and Advent Software. Mr. Taylor currently serves as Chairman of Vertafore, Inc., and is a member of the Operating Committee of SunGuard. He also currently serves on the board of directors of Decision Insight Information Group, CCC Information Services Inc. and Eze Software Group. Prior to joining TPG, Mr. Taylor was a founder and Managing Director at Symphony Technology Group, a private equity firm focused exclusively on software and technology services investments. While at Symphony, Mr. Taylor was actively involved with the firm’s investments in Information Resources Incorporated, Intentia AB, GERS, Inc., Industri-Matematik International Corp. AB, and Symphony Services, Inc. Prior to joining Symphony, Mr. Taylor was a Manager at Bain & Company where he worked in the private equity and technology practice groups. He holds a B.A. from Stanford University, where he graduated with honors, and an M.B.A. from the Stanford Graduate School of Business. Because of his experience in finance and technology services, we believe Mr. Taylor is well qualified to serve on our board of directors.
Board composition and director independence
Our business and affairs are managed under the direction of our board of directors. Our board of directors is currently composed of ten directors: Messrs. Raj, Rhodes, Sisitsky and Taylor, who were designated for nomination as directors by TPG; Messrs. Bourbonnais and Lubek, who were designated for nomination as directors by CPPIB-PHI; Mr. Danhakl, who was designated for nomination as a director by LGP; Messrs. Mansukani and Rittenmeyer, who were designated for nomination as directors jointly by TPG and CPPIB-PHI; and Mr. Bousbib, who serves as a director because he is our Chief Executive Officer. Currently, each director is elected for a one-year term. A stockholders’ agreement between us and our current stockholders contains an agreement among the parties pursuant to which each of the Sponsors has certain rights to nominate individuals to serve on our board of directors.
Following the completion of this offering, we expect to be a “controlled company” under the rules of the NYSE because more than 50% of our outstanding voting power will be held by the Sponsors. See “Principal and selling stockholders.” We intend to rely upon the “controlled company” exception relating to the board of directors and committee independence requirements under the rules of the NYSE. Pursuant to this exception, we will be exempt from the rules that would otherwise require that our board of directors consist of a majority of independent directors and that our leadership development and compensation committee and nominating and governance committee be composed entirely of independent directors. The “controlled company” exception does not modify the independence requirements for the audit
104
Table of Contents
committee, and we intend to comply with the requirements of the Exchange Act and the rules of the NYSE, which require that our audit committee have at least one independent director upon consummation of this offering, consist of a majority of independent directors within 90 days following the effective date of the registration statement of which this prospectus forms a part and exclusively of independent directors within one year following the effective date of the registration statement of which this prospectus forms a part.
Our board of directors has determined that all of our directors, other than , are independent directors under the rules of the NYSE. In making this determination, the board of directors considered the relationships that each such non-employee director has with our company and all other facts and circumstances that the board of directors deemed relevant in determining their independence, including beneficial ownership of our common stock.
Board committees
Upon the completion of this offering, our board of directors will have three standing committees: the audit committee; the leadership development and compensation committee; and the nominating and corporate governance committee. Each of the committees operates under its own written charter adopted by the board of directors, each of which will be available on our website upon closing of this offering.
Audit committee
Following this offering, our audit committee will be composed of , with serving as chairman of the committee. We anticipate that, prior to the completion of this offering, our audit committee will determine that meets the definition of “independent director” under the rules of the NYSE and under Rule 10A-3 under the Exchange Act. Within 90 days following the effective date of the registration statement of which this prospectus forms a part, we anticipate that the audit committee will consist of a majority of independent directors, and within one year following the effective date of the registration statement of which this prospectus forms a part, the audit committee will consist exclusively of independent directors. None of our audit committee members simultaneously serves on the audit committees of more than three public companies, including ours. Our board of directors has determined that is an “audit committee financial expert” within the meaning of the SEC’s regulations and applicable listing standards of the NYSE. The audit committee’s responsibilities upon completion of this offering will include:
| • | appointing, approving the compensation of, and assessing the qualifications, performance and independence of our independent registered public accounting firm; |
| • | pre-approving audit and permissible non-audit services, and the terms of such services, to be provided by our independent registered public accounting firm; |
| • | reviewing the internal audit plan with the independent registered public accounting firm and members of management responsible for preparing our financial statements; |
| • | reviewing and discussing with management and the independent registered public accounting firm our annual and quarterly financial statements and related disclosures as well as critical accounting policies and practices used by us; |
| • | reviewing the adequacy of our internal control over financial reporting; |
105
Table of Contents
| • | establishing policies and procedures for the receipt and retention of accounting-related complaints and concerns; |
| • | recommending, based upon the audit committee’s review and discussions with management and the independent registered public accounting firm, the inclusion of our audited financial statements in our Annual Report on Form 10-K; |
| • | reviewing and assessing the adequacy of the committee charter and submitting any changes to the board of directors for approval; |
| • | monitoring our compliance with legal and regulatory requirements as they relate to our financial statements and accounting matters; |
| • | preparing the audit committee report required by the rules of the SEC to be included in our annual proxy statement; and |
| • | reviewing and discussing with management and our independent registered public accounting firm our earnings releases. |
Leadership development and compensation committee
Following this offering, our leadership development and compensation committee will be composed of , with serving as chairman of the committee. The leadership development and compensation committee’s responsibilities upon completion of this offering will include:
| • | annually reviewing and approving corporate goals and objectives relevant to the compensation of our chief executive officer and our other executive officers; |
| • | evaluating the performance of our chief executive officer in light of such corporate goals and objectives and determining and approving the compensation of our chief executive officer; |
| • | reviewing and approving the compensation of our other executive officers; |
| • | appointing, compensating and overseeing the work of any compensation consultant, legal counsel or other advisor retained by the leadership development and compensation committee; |
| • | conducting the independence assessment outlined in NYSE rules with respect to any compensation consultant, legal counsel or other advisor retained by the leadership development and compensation committee; |
| • | reviewing and assessing the adequacy of the committee charter and submitting any changes to the board of directors for approval; |
| • | reviewing and establishing our overall management compensation, philosophy and policy; |
| • | overseeing and administering our equity compensation and similar plans; |
| • | reviewing and approving our policies and procedures for the grant of equity-based awards; |
| • | reviewing and making recommendations to the board of directors with respect to director compensation; and |
| • | reviewing and discussing with management the compensation discussion and analysis to be included in our annual proxy statement or Annual Report on Form 10-K. |
106
Table of Contents
Nominating and corporate governance committee
Following this offering, our nominating and corporate governance committee will be composed of , with serving as chairman of the committee. The nominating and corporate governance committee’s responsibilities upon completion of this offering will include:
| • | developing and recommending to the board of directors criteria for board and committee membership; |
| • | establishing procedures for identifying and evaluating board of director candidates, including nominees recommended by stockholders; |
| • | identifying individuals qualified to become members of the board of directors; |
| • | recommending to the board of directors the persons to be nominated for election as directors and to each of the board’s committees; |
| • | developing and recommending to the board of directors a set of corporate governance principles; |
| • | articulating to each director what is expected, including reference to the corporate governance principles and directors’ duties and responsibilities; |
| • | reviewing and recommending to the board of directors practices and policies with respect to directors; |
| • | reviewing and recommending to the board of directors the functions, duties and compositions of the committees of the board of directors; |
| • | reviewing and assessing the adequacy of the committee charter and submitting any changes to the board of directors for approval; |
| • | reviewing all related person transactions for potential conflict of interest situations and approving all such transactions; |
| • | consider and report to the board of directors any questions of possible conflicts of interest of board of directors members; |
| • | provide for new director orientation and continuing education for existing directors on a periodic basis; |
| • | performing an evaluation of the performance of the committee; and |
| • | overseeing the evaluation of the board of directors and management. |
107
Table of Contents
Leadership development and compensation committee interlocks and insider participation
During the fiscal year ended December 31, 2013, our leadership development and compensation committee was comprised of Messrs. Bourbonnais, Danhakl, Rittenmeyer and Taylor. None of the members of our leadership development and compensation committee has at any time during the prior three years been one of our officers or employees. None of our executive officers currently serves, or in the past fiscal year has served, as a member of the board of directors or leadership development and compensation committee of any entity that has one or more executive officers serving on our board of directors or leadership development and compensation committee. For a description of transactions between us and members of our leadership development and compensation committee and affiliates of such members, please see “Certain relationships and related party transactions.”
Board oversight of risk management
While the full board of directors has the ultimate oversight responsibility for the risk management process, its committees oversee risk in certain specified areas. In particular, our audit committee oversees management of enterprise risks as well as financial risks. Our leadership development and compensation committee is responsible for overseeing the management of risks relating to our executive compensation plans and arrangements and the incentives created by the compensation awards it administers. Our nominating and corporate governance committee oversees risks associated with corporate governance, business conduct and ethics, and is responsible for overseeing the review and approval of related party transactions. Pursuant to the board of directors’ instruction, management regularly reports on applicable risks to the relevant committee or the full board of directors, as appropriate, with additional review or reporting on risks conducted as needed or as requested by the board of directors and its committees.
Codes of business conduct and ethics
We have adopted a code of business conduct that applies to all of our employees, officers and directors. We have also adopted an additional code of ethics applicable to those officers responsible for financial reporting. Upon the closing of this offering, our codes of business conduct and ethics will be available on our website. We intend to disclose any amendments to our codes, or any waivers of their requirements, on our website.
108
Table of Contents
Compensation discussion and analysis
This discussion and analysis of our compensation program for our named executive officers should be read in conjunction with the accompanying tables below and text disclosing the compensation awarded to, earned by or paid to our named executive officers.
Compensation of our named executive officers is determined under our compensation program for senior executives. This program is overseen by the leadership development and compensation committee of our board of directors (referred to herein as the “Committee”). The Committee determines the compensation of all our executive officers. This compensation discussion and analysis focuses on our executive officers listed in the Summary compensation table and the other compensation tables (referred to herein as our “named executive officers”). Our named executive officers for our 2013 fiscal year were:
| • | Ari Bousbib, Chairman, Chief Executive Officer & President; |
| • | Ronald E. Bruehlman, Senior Vice President & Chief Financial Officer; |
| • | Paul M. Thomson, Senior Vice President, Human Resources & Administration; |
| • | Satwinder Sian, Senior Vice President, Global Technology & Operations; and |
| • | Stefan C. Linn, Senior Vice President, Strategy & Global Pharma Solutions. |
Principal objectives of our compensation program for named executive officers
Our executive team is critical to our success and to building value for our stockholders. The principal objectives of our compensation program are to:
| • | permit us to recruit talented and well-qualified executives to serve in leadership positions; |
| • | retain such experienced executives to lead our organization over the long term; |
| • | motivate our executives to succeed by providing compensation that is directly based on performance; and |
| • | align the interests of our executive officers with those of our stockholders by delivering a substantial portion of the executive officer’s compensation through time- and performance-based equity awards with a longer-term value horizon. |
We have designed our executive compensation program with specific features to help achieve these goals and to promote related objectives that are important to our long-term success.
We have also designed our compensation program to tie a substantial portion of each named executive officer’s compensation to the achievement of performance objectives over both the short- and long-term. This approach to compensation demonstrates our “pay for performance” philosophy as well as our focus on creating longer-term value for our stockholders. The principal measures of our business performance, as they relate to our compensation programs, are:
| • | “Adjusted EBITDA”; and |
| • | “Management Cash Flow as a percentage of Adjusted EBITDA” (“Cash Flow Percentage”). |
Adjusted EBITDA and Cash Flow Percentage are non-GAAP financial measures. Adjusted EBITDA is defined as net income or loss from our consolidated statements of comprehensive income before interest income and expense, income taxes, depreciation and amortization, further adjusted to eliminate restructuring and related expense, other losses, net non-cash stock-based
109
Table of Contents
compensation charges, acquisition-related charges, sponsor monitoring fees, deferred revenue adjustment from purchase accounting and merger costs. All of these items and related amounts are disclosed in the “Net income to Adjusted EBITDA reconciliation” section of the “Management’s discussion and analysis of financial condition and results of operations” section of this prospectus, where we disclose a reconciliation of Net Income (Loss) to Adjusted EBITDA. Although Adjusted EBITDA is determined on a constant currency basis (i.e., foreign exchange rates are fixed prior to the applicable performance period) for all of our employee plans for which it is relevant, foreign exchange rates are fixed as of different times for purposes of our annual incentive compensation plan (the “Annual Plan”) and performance-based stock options granted under our 2010 Equity Plan (described below). For the Annual Plan, they are fixed prior to the applicable calendar year. For our performance-based stock option awards, they were fixed in 2010 at the time the initial awards were granted. “Management Cash Flow” is defined as Adjusted EBITDA plus or minus changes in accounts receivable, other current assets, accounts payable, accrued expenses and deferred revenue (with the exception of changes in hedge receivables and payables and accrued severance), less capital expenditures and additions to computer software. “Cash Flow Percentage” is the ratio of Management Cash Flow to Adjusted EBITDA, expressed as a percentage.
Adjusted EBITDA was selected as a performance metric because we believe it is an important measure of our financial performance and our ability to service our debt and reflects our near- and longer-term goal of increasing profitability. Cash Flow Percentage was selected because it measures how well we manage cash, and using this measure can incentivize our executives to generate a high level of cash relative to Adjusted EBITDA.
Stock options are inherently performance-based because no value is created unless the value of our common stock appreciates after the stock options are granted. In addition to stock options that vest based solely on time, we also award stock options that vest based on the achievement of one-year or two-year Adjusted EBITDA targets and/or the value returned to our stockholders as measured by a return on their investment in us or the receipt of specified internal rates of return on their investment in us.
As described below, the primary elements of our executive compensation program are annual base salary, short-term incentives, long-term incentives and retirement and termination benefits. Together, these items are intended to be complementary and serve the goals described above. The Committee, however, does not have any formal policies or guidelines for allocating compensation between short-term and long-term compensation, between cash and non-cash compensation or among different forms of cash and non-cash compensation.
Decision-making responsibility
Roles of the Committee and management in compensation decisions
Our executive compensation program is developed and overseen by the Committee, which is currently comprised of three directors affiliated with the Sponsors and one non-Sponsor director. The Committee takes into account the views and recommendations of management, in particular those of our Chairman, Chief Executive Officer & President (referred to herein as our “Chief Executive Officer”) and our Senior Vice President of Human Resources & Administration, in making decisions regarding our executive compensation program. Our Chief Executive Officer makes recommendations about annual base salary increases, annual cash bonus targets and payments and long-term equity grants for our named executive officers (other than for himself).
110
Table of Contents
The Committee, however, is responsible for approving, and makes all decisions regarding, the compensation of our named executive officers.
Use of compensation consultants
In 2013, we engaged Steven Hall & Partners (“Steven Hall”), a nationally known compensation consulting firm, on a very limited basis to provide market data relating to the total cash compensation opportunities of our Chief Executive Officer and our Chief Financial Officer, prior to their annual performance reviews. See “Compensation setting process—Role of market data” and “Elements of compensation—Annual base salary” below. During 2013, Steven Hall requested data from us and was directed to exercise its independent judgment in advising us on executive compensation matters.
Later in 2013, as part of our preparation to become a public company, the Committee engaged Steven Hall to provide a broader range of compensation consulting services on a going forward basis. These services are expected to include a review and analysis of our executive compensation levels and practices, board remuneration, executive officer and non-employee director ownership guidelines, peer group composition, long-term incentive plan design and grant practices and change in control and severance practices.
On a going forward basis, the Committee will be solely responsible for approving payments to Steven Hall and for setting the terms and scope of Steven Hall’s engagement and the termination of this engagement. In addition, Steven Hall will report directly to the Committee. Steven Hall provides only executive compensation consulting services to us, and does not provide other services such as benefits administration or actuarial services.
Compensation setting process
Role of market data
Market surveys. Although we have not engaged in formal peer group benchmarking with respect to our named executive officers on a regular basis since we were taken private in 2010 in connection with the Merger, the Committee has continued to review the total cash compensation opportunities of our named executive officers annually as well as the annualized equity values of any equity awards granted to them in light of available market data taken from certain surveys, as described below. As part of this review, our human resources personnel, on an annual basis, review surveys of executive compensation data from public and private companies across all sectors with approximately $1 billion to $3 billion in revenue. This survey data, in addition to the other factors described below under “Internal pay equity and other factors”, is taken into account by our Chief Executive Officer and our Senior Vice President of Human Resources & Administration in preparing their compensation recommendations to the Committee.
For each named executive officer, we have generally used market data from the market surveys reviewed by our human resources personnel as a consideration in setting annual base salary and the target level of annual incentives, with the intention that such target amounts, together with base salary, will result in total cash compensation at about the 50th percentile of the market survey group. These comparisons are part of the total mix of information used to annually evaluate base salary, short-term incentive compensation and total cash compensation. We have also used survey data of this type on a limited basis when determining the size of equity award grants following the Merger. While we do not engage in any formal benchmarking with respect
111
Table of Contents
to equity awards, we have used survey data of the type described above to develop general, non-binding Company guidelines against which post-Merger equity award grants (other than the equity award grants made during the initial post-Merger transition period), including equity award grants to our Chief Financial Officer, have been evaluated.
Limited review of peer companies in 2013. As noted above, we engaged Steven Hall in 2013 only to provide an additional source of market data on the total cash compensation of chief executive officers and chief financial officers of a peer group of companies. We selected the peer group companies through discussions with, and recommendations from, Steven Hall. The peer companies chosen were generally those companies that we included in our peer group prior to the time of the Merger and were as follows: Actavis, Inc., Allergan, Inc., Forest Laboratories, Inc., Mylan, Inc., St. Jude Medical, Inc., Stryker Corp., Acxiom Corp., Cerner Corp., Covance, Inc., DST Systems, Inc., Dun & Bradstreet Corp., Equifax, Inc., Fair Isaac Corp., Fiserv, Inc., Gartner, Inc., Moody’s Corp., and Nielsen Holdings NV. The peer companies selected for this purpose are companies with which we compete for executive talent, or which are broadly similar to us based on certain characteristics, such as: financial size and performance as measured by revenue, capitalization, returns, growth and/or profitability; industry focus; scope of operations, market presence outside the United States and employee base; and scope of position responsibilities, executive qualifications and expertise, and/or performance challenges. Peer companies were not pre-screened for their compensation levels or practices.
For future years, the Committee, working with Steven Hall and management, intends to re-evaluate, and expects to make changes to, this list of peer companies.
As we transition to a publicly traded company, the Committee may rely more heavily on market data and benchmarking of peer companies, which could result in changes in the level, timing and elements of compensation that we may use in the future for our named executive officers.
Internal pay equity and other factors
We take into account factors other than market data in setting salary, annual incentive and long-term incentives, which are the elements of total direct compensation. Such factors include internal pay equity, the experience and length of service of the executive, relative responsibilities among members of our executive team, contributions by the executive and business conditions. In addition, the Committee has also relied on the experience of our Sponsor-affiliated members of the Committee and on analysis performed by our Sponsors that considers the compensation of our executive team in light of the compensation structure of other portfolio companies or private equity-backed companies in general.
We do not use market surveys with respect to elements of compensation other than total direct compensation. For these other elements of compensation, such as severance, change in control benefits, retirement plans and health and welfare benefits, the Committee (and, with respect to ordinary course changes to broad-based employee benefits, our senior management) relies on its own business experience and familiarity with market conditions in determining the appropriate level of benefits for our named executive officers in light of our needs.
Elements of compensation
The following is a discussion of the primary elements of the compensation for each of our named executive officers.
112
Table of Contents
Annual base salary
We pay our named executive officers a base salary to provide them with a fixed, base level of compensation. The Committee attempts to maintain base salaries at competitive levels while also reserving a substantial portion of compensation for the other elements of compensation that are more directly linked to our performance and individual performance.
Generally, base salaries of the named executive officers are reviewed annually in July of each year. Annual base salaries may be adjusted by the Committee based upon the recommendations of our Chief Executive Officer (except with respect to his own salary). The recommendations made with respect to a named executive officer are generally based upon the executive’s individual annual performance review for the prior year’s performance, leadership and contribution to company performance, and internal pay equity considerations, as well as market conditions, survey data and our overall budgetary guidelines. The Committee takes all of these factors into account when making its decisions, but does not assign any specific weight to any one factor. In addition to the annual salary review, the Committee may also adjust base salaries at other times during the year in connection with promotions, increased responsibilities or to maintain competitiveness in the market.
The amount of our Chief Executive Officer’s annual base salary is set forth in his employment agreement, but remains subject to increase based on the same factors as described above for the other named executive officers. The Committee did not increase his annual base salary during 2013 and his annual base salary remains at the level first set in 2010.
For 2013, the Committee increased Mr. Bruehlman’s annual base salary by 12.5% based on a recommendation from our Chief Executive Officer (who took into account the findings of Steven Hall’s review described above). The Committee approved this increase in order to provide Mr. Bruehlman with a more competitive base salary and in recognition of his contributions to us. The Committee also approved increases in the annual base salaries of Mr. Thomson, Dr. Sian and Mr. Linn of 8.2%, 4.6% and 3.3%, respectively, in connection with our annual performance review process, reflecting our 2013 budgeted level of merit increases and adjustments. All base salary increases became effective on October 1, 2013.
Short-term incentive plan
We believe that the opportunity to earn an annual incentive should be based upon actual performance against specified business and individual metrics.
Each of our named executive officers participates in the Annual Plan, and is eligible for a target annual bonus that is equal to a percentage of his annual base salary. The target annual bonus amount for each of our named executive officers for our 2013 fiscal year was as follows:
| Named executive officer |
Target annual bonus as a base salary |
|||
|
|
||||
| Ari Bousbib |
150% | |||
| Ronald E. Bruehlman |
70% | |||
| Paul M. Thomson |
70% | |||
| Satwinder Sian |
70% | |||
| Stefan C. Linn |
70% | |||
|
|
||||
113
Table of Contents
These target bonus percentages were not changed for 2013 from levels in effect at the end of 2012.
Each year, the Committee establishes a notional pool to pay bonuses to all participants in the Annual Plan, including our named executive officers. The target funding for the notional pool is equal to the aggregate amount that would be payable if each participant received his or her target annual bonus. The funding of the Annual Plan is determined shortly after the end of our fiscal year based on our achievement of two pre-established metrics, Adjusted EBITDA and Cash Flow Percentage (each as defined and described above), subject to the further adjustments described below. The Committee sets reasonable, yet challenging, threshold, target and maximum Company performance-based goals early each year, taking into account current business conditions facing us and our business plan and budget for the year, with a view that the threshold level should have a relatively higher probability of achievement and the maximum level should have a relatively lower probability of achievement, and that the payouts associated with each should serve as a significant incentive. In addition, we intend that the performance levels required for threshold, target and maximum payouts will correlate to an appropriate return to our stockholders in relation to the overall budgeted compensation payable for such level of performance.
If our actual Adjusted EBITDA is equal to “threshold” Adjusted EBITDA goal, “target” Adjusted EBITDA goal or “maximum” Adjusted EBITDA goal under the Annual Plan, the funding level of the pool under the Annual Plan determined at this first step is equal to 50%, 100% or 150%, respectively. If actual Adjusted EBITDA is greater than the target Adjusted EBITDA goal but is less than the maximum Adjusted EBITDA goal, or if actual Adjusted EBITDA is greater than the threshold Adjusted EBITDA goal but is less than the target Adjusted EBITDA goal, the funding level of the pool is interpolated between the two applicable points.
The second metric that determines the level of funding for the pool under the Annual Plan is our Cash Flow Percentage. Our achievement relative to the target Cash Flow Percentage can increase or decrease the funding level established at the first step by 10%. For example, if the target Adjusted EBITDA goal is achieved and the maximum Cash Flow Percentage goal is achieved, the funding level of the Annual Plan determined at this second step is equal to 110% (100% due to the achievement of the target Adjusted EBITDA goal plus 10% (that is, 10% of 100%) due to the achievement of the maximum Cash Flow Percentage goal).
The level of funding of the pool can then be further adjusted either up or down by as much as 10% by our Chief Executive Officer in the third step of the Annual Plan funding determination process. In the fourth and final step for determining the funding level for the pool under the Annual Plan (as applied to our named executive officers), the amount can be further adjusted by as much as 20%, either up or down, by the Committee. The adjustments made by our Chief Executive Officer and the Committee in the third and fourth steps are entirely discretionary and allow our Chief Executive Officer and the Committee, respectively, to tailor the funding of the Annual Plan to events and circumstances that may not be fully taken into account by the objective metrics that otherwise determine the funding level.
The 2013 threshold, target and maximum Adjusted EBITDA levels were equal to $802.1 million, $840.3 million and $954.9 million, respectively, representing 5%, 10% and 25% year-over-year growth rates, respectively, on a constant dollar basis. If actual Adjusted EBITDA on a constant dollar basis had equaled less than the threshold amount, the Annual Plan would not have been funded, and if actual Adjusted EBITDA on a constant dollar basis had equaled more than the maximum amount, the Annual Plan would have been funded at 150% (subject to the adjustments described
114
Table of Contents
above). The threshold, target and maximum Adjusted EBITDA levels for 2013 were each established using exchange rates prevailing at September 30, 2012.
The target Cash Flow Percentage for 2013 was 85%. If the actual Cash Flow Percentage had been achieved at the target level, the funding level of the 2013 bonus pool would not have been adjusted. If an actual Cash Flow Percentage of 80% or less had been achieved, the 2013 bonus pool funding level established based on Adjusted EBITDA would have been decreased by 10% (e.g., a 90% funding level would have been decreased to 81%). If an actual Cash Flow Percentage of 90% or greater had been achieved, the 2013 bonus pool funding level established based on Adjusted EBITDA would have been increased by 10% (e.g., a 120% funding level would have been increased to 132%). If the actual Cash Flow Percentage is greater than the target Cash Flow Percentage level but is less than a 90% Cash Flow Percentage level, or if the actual Cash Flow Percentage is greater than an 80% Cash Flow Percentage level but is less than the target Cash Flow Percentage level, the funding level of the pool is adjusted based on an interpolation between the two applicable points.
After the end of the fiscal year, the Committee determines the achievement of both the Adjusted EBITDA and Cash Flow Percentage goals. Once the Committee has made those determinations, as described above, both our Chief Executive Officer and the Committee have the opportunity to exercise limited discretion to adjust the funding level for the Annual Plan.
Once the funding amount for the pool is determined, an amount is allocated for bonuses to be paid to our executive officers, including our named executive officers, as a group (the “senior management sub-pool”). The amount allocated to the senior management sub-pool is equal to the pool funding percentage (i.e., the amount approved for payment of all bonuses under the Annual Plan for the fiscal year expressed as a percentage of the target amount of the Annual Plan funding pool) multiplied by the sum of the target annual bonuses for each participant in the sub-pool (reduced by the “reserve” sub-pool, to the extent applicable, described below). The Committee then determines how the senior management sub-pool is divided among the participants in the sub-pool, based on each named executive officer’s individual performance in the applicable fiscal year (as further described below) and each named executive officer’s target annual bonus, provided that the total amount of the annual incentive payments paid to the participants who share the senior management sub-pool generally cannot exceed (but may be less than) the amount allocated to the senior management sub-pool. If the amount of the senior management sub-pool serves to cap the amount a participant in the Annual Plan would otherwise receive based on his individual performance, the participant may be able to receive the amount of the shortfall from a plan-wide “reserve” sub-pool set aside for such purposes (to the extent such reserve is sufficiently large). The “reserve” sub-pool is a discretionary amount that may be set aside by our Chief Executive Officer from the plan-wide pool for the purpose of rewarding high performers whose bonuses based on individual performance are otherwise capped by sub-limits, such as the senior management sub-pool limit, under the Annual Plan. Allocations to named executive officers from the reserve sub-pool are approved by the Committee, except to the extent it delegates such authority in a particular year.
At the beginning of each fiscal year, each of our named executive officers meets with our Chief Executive Officer (or, in the case of our Chief Executive Officer, with the Committee) to discuss his individual performance goals for the year. Each named executive officer’s individual performance goals are developed in consultation with our Chief Executive Officer for review with the Committee and consist of a series of key strategic, financial, operational and/or leadership objectives that relate to the duties of the named executive officer for the fiscal year and to our
115
Table of Contents
business objectives for the coming year. Mr. Bousbib’s individual goals for 2013 included achieving revenue and Adjusted EBITDA growth targets, EBITDA to cash performance, accelerating our growth, expanding our market potential and client reach, leveraging new technology platforms and expanding our performance culture. Mr. Bruehlman’s individual goals for 2013 included supporting the achievement of certain revenue, Adjusted EBITDA and cash flow goals, execution of acquisitions, and strengthening of our finance and business development team. Mr. Thomson’s individual goals for 2013 included managing benefit costs, support of acquisition/integration activity, achieving targeted real estate portfolio cost reductions, enhancing our learning culture and continuing to refine our leadership development review process. Dr. Sian’s individual goals for 2013 included our achievement of certain profit, revenue and financial reporting compliance goals, our achievement of certain strategic initiatives, ensuring robust integration and rollout of acquired companies and their new platforms, engaging global technology services and operations for capability build and transformation, and driving performance across all levels of our global technology services and operations. Mr. Linn’s individual goals for 2013 included meeting certain revenue and growth targets, overseeing new product offerings, further leveraging social media tools and integrating new senior hires into critical roles.
After the end of the fiscal year, the Committee and our Chief Executive Officer (except with respect to his own individual performance goals) evaluate the named executive officer’s actual individual performance against those individual performance goals. Depending on the named executive officer’s individual performance level, his annual incentive bonus payout ranges will be as follows, subject to the limits on the management sub-pool described above:
| Individual performance level | Annual incentive bonus payout range as a percentage of target annual bonus |
|||
|
|
||||
| Exceeded All or Most Goals and Objectives |
Up to 200% | |||
| Met Goals and Objectives |
Up to 110% | |||
| Did Not Meet Some or All Goals and Objectives |
Up to 80% | |||
|
|
||||
Determination of 2013 Annual Bonuses
Based on achieving an Adjusted EBITDA of $851.7 million for our 2013 fiscal year, the notional pool under our Annual Plan for our 2013 fiscal year was funded at 103.7% in the first stage of our determination process. Because we achieved a Cash Flow Percentage of 83.5% (without taking into account a year-end building purchase in India, Cash Flow Percentage would have been 86.1%), that initial funding level was decreased to a pool funding level of 100.6%. After reviewing the funding level achieved and the aggregate bonus pool resulting from such funding level, Mr. Bousbib recommended to the Committee that the funding level be reduced to 96.8%. Mr. Bousbib determined, after taking into account recommendations from senior leaders in the various regions in which the Company does business, that the aggregate bonus pool at this level would be sufficient in his judgment to appropriately reward our employees, including our named executive officers, who participate in our Annual Plan for their performance and the performance of the company in our 2013 fiscal year. After considering Mr. Bousbib’s recommendation and the performance described above, the Committee approved this funding level, the aggregate bonus pool that resulted from it and the senior management sub-pool as described above. There was no discretionary reserve sub-pool established for 2013.
After the Committee established the funding pool under our Annual Plan, the Committee and Mr. Bousbib (except with respect to his own individual performance) evaluated the performance of
116
Table of Contents
each of our named executive officers against his individual performance goals (as described above) and determined that those goals had been achieved at the levels specified in the table below. As a result of the overall funding of the notional pool for our 2013 fiscal year, the amount allocated by the Committee to the senior-management sub-pool and the individual performance of our named executive officers, the actual amount earned by each of our named executive officers as a percentage of his target annual bonus in respect of our 2013 fiscal year is as set forth in the table below.
| Named Executive Officer | Individual performance level achieved | 2013 cash bonus actually earned as a percentage of target annual bonus |
||||
|
|
|
|
||||
| Ari Bousbib |
Exceeded All or Most Goals and Objectives | 200 | % | |||
| Ronald E. Bruehlman |
Exceeded All or Most Goals and Objectives | 142 | % | |||
| Paul M. Thomson |
Exceeded All or Most Goals and Objectives | 140 | % | |||
| Satwinder Sian |
Exceeded All or Most Goals and Objectives | 136 | % | |||
| Stefan C. Linn |
Exceeded All or Most Goals and Objectives | 133 | % | |||
|
|
|
|
|
|||
After reviewing and discussing our Chief Executive Officer’s performance during 2013, our board of directors awarded our Chief Executive Officer a supplemental bonus of $200,000 in respect of our 2013 fiscal year. Our board approved this additional bonus to reward our Chief Executive Officer’s extraordinary performance in driving value creation for our stockholders and achieving strong Adjusted EBITDA growth in 2013 and over a multi-year period.
Long-term incentive awards
We believe substantial returns for our stockholders are achieved through a culture that focuses on long-term performance by our named executive officers and other senior management. By providing our senior management with a meaningful equity stake in us, we are better able to align the interests of our named executive officers with those of our stockholders and create value for our stockholders.
In connection with the Merger, we adopted the Healthcare Technology Holdings, Inc. 2010 Equity Incentive Plan (the “2010 Equity Plan”). All of our named executive officers, other than our Chief Financial Officer, were employed at, or shortly after, the Merger and were granted stock option awards that were intended to serve as long-term incentives covering a five-year time frame. The size of each option grant for those named executive officers was determined by our board of directors or the Committee in consultation with our Chief Executive Officer at time the stock options were granted (other than in the case of our Chief Executive Officer’s own awards), based on their business experience, taking into account the fact that the Committee did not expect to grant additional awards to these executives in the ordinary course during this five-year period. Our Chief Financial Officer’s stock option award, granted at his time of hire, was intended to be comparable in size to the awards made to our named executive officers who were employed at or shortly after the Merger, while still providing an appropriate incentive based on factors such as internal equity, the size of grants made to employees in comparable positions, and market conditions, taking into account market surveys, to the extent described above. Our Chief Financial Officer’s stock option award was also intended to cover a five-year time frame. In addition, with
117
Table of Contents
respect to each of the named executive officers other than Dr. Sian, the size of their grants reflected the outcome of negotiations with the named executive officer at the time he was hired.
Since the Merger, we have not had a practice of making annual grants to our executives or employees. Rather, we have awarded equity in connection with promotions or new hires, the occurrence of significant events or as special grants intended to promote retention.
Stock options granted to our named executive officers generally are subject to time- and performance-based vesting. The time-based options generally vest over a five-year period and the performance-based options are eligible to vest over a five-year period based on our achievement of specified Adjusted EBITDA goals generally for each of the five fiscal years beginning with (or, with respect to grants made after August 1 of a given year, immediately following) the fiscal year in which the option was granted. To the extent the option does not vest because the Adjusted EBITDA goal is not met (and is not met based on the combined Adjusted EBITDA for a given fiscal year and the next succeeding fiscal year), the stock options will remain outstanding and vest (together with any other unvested performance-based options) if the Sponsors realize certain returns on their investment in us or certain internal rates of return on their investment in us. We believe that these performance-based stock option awards encourage our named executive officers to achieve key strategic objectives and maximize value creation for our stockholders. The Committee also believes that time-vesting options reinforce our goal to retain key executives while creating value for our stockholders. As discussed below in “Acceleration of options and other stock-based awards” under “Potential payments upon termination or change in control,” stock options are subject to accelerated vesting in limited circumstances relating to change in control events and certain terminations of employment.
As part of a new employment package, as additional retention grants and/or in connection with the increase in responsibilities resulting from a promotion, certain named executive officers have been granted time-vesting restricted stock units (“RSUs”), time-vesting stock options issued with an exercise price equal to the fair market value of a share of our common stock on the date of grant, and “premium priced” stock options that were granted with an exercise price equal to 150% of the fair market value of a share of our common stock on the date of grant. The Committee believes that these awards served as important tools for the recruitment and/or retention and motivation of the named executive officers that received them.
For our 2013 fiscal year, certain of our performance-based options were eligible to vest if we achieved an Adjusted EBITDA of $807 million (determined on a constant currency basis based on exchange rates set at the time of the Merger, when certain of the options were first granted). Since we achieved Adjusted EBITDA on a constant currency basis of $852.8 million for our 2013 fiscal year, we exceeded our Adjusted EBITDA targets under the performance-vesting stock options for our 2013 fiscal year. We also exceeded our Adjusted EBITDA targets for each of our 2010 through 2012 fiscal years.
To recognize his individual leadership and contributions and to provide additional retention, Mr. Thomson was granted 350,000 time-vesting RSUs on February 13, 2013. The Committee determined that this grant was appropriate to reinforce our goal of retaining key executive talent. As described below, we granted additional RSUs to Mr. Thomson on August 6, 2013 in connection with our payment of a cash dividend to our stockholders.
No stock options were granted to our named executive officers in 2013 and, apart from the grants of RSUs to Mr. Thomson described above, no other incentive equity awards were granted to our named executive officers in 2013.
118
Table of Contents
The completion of this offering will not result in any acceleration of vesting of outstanding stock options or equity awards held by our named executive officers. However, if the Sponsors sell all or part of their shares of our common stock following the completion of this offering and receive certain returns on their investment, unvested performance-based stock options will vest.
Investment in the Company
Each of our named executive officers has made a direct investment in our common stock, either through a cash investment, in the case of each named executive officer other than Dr. Sian, or, in the case of Dr. Sian, our only named executive officer employed by us at the time of the Merger, through a rollover of directly owned shares and stock appreciation rights and a notional investment of a portion of his account balance under our Defined Contribution Executive Retirement Plan (as described below) into shares of our common stock. Offering our named executive officers the opportunity to invest in our company aligns their interests with the interests of our other stockholders, leads them to act as “employee owners” of our company and allows them to benefit from increases in value that they helped to create.
As a result of his decision to roll over previously granted stock appreciation rights awards in connection with the Merger, Dr. Sian holds the stock appreciation rights awards described in the Outstanding equity awards at fiscal year-end table below, all of which are fully vested.
Payments and adjustments in connection with cash dividend
On August 6, 2013, we paid a cash dividend of $0.26 per share on each share of our common stock that was outstanding as of that date. In order to prevent dilution of the value of our outstanding long-term incentive awards, including awards held by our named executive officers, and to reward executives for our success, in connection with the cash dividend, the Committee approved certain adjustments to, and certain payments in respect of, long-term incentive awards that were then outstanding. The adjustments described below with respect to stock options were required under the terms of the 2010 Equity Plan. Specifically, the Committee approved the following:
| • | payment of a dividend equivalent cash amount equal to $0.26 for each share underlying an outstanding vested stock option (other than certain excluded options), an outstanding stock option eligible to vest on or before December 1, 2013 or an outstanding stock appreciation rights award; |
| • | reduction in the exercise price by $0.26 for each share underlying an outstanding stock option on which no dividend equivalent payment was made; and |
| • | the grant of new RSUs in respect of each outstanding grant of RSUs in an amount equal to the product of $0.26 multiplied by the number of RSUs that were outstanding under the grant immediately prior to the cash dividend, divided by the per share fair market value of a share of our common stock immediately after the cash dividend. |
Retirement programs
Senior executives participate along with broad groups of employees and/or other executives in a number of plans that provide a pension or other forms of retirement benefits earned through service to us.
119
Table of Contents
All of our named executive officers other than Dr. Sian participate in our Retirement Plan (a tax-qualified defined benefit plan with a cash balance formula) and our Savings Plan (a tax-qualified defined contribution plan), each a broad-based retirement plan in which generally all of our U.S.-based employees are eligible to participate. Under the Savings Plan, we make a matching contribution of 50% of employee contributions up to 6% of compensation, subject to certain limits under the Internal Revenue Code, and employees vest in Company matching contributions after three years of service. The Retirement Plan is described further in the “Pension benefits” section below.
All of our named executive officers other than Dr. Sian also participate, along with all other eligible U.S.-based employees, in our Retirement Excess Plan and our Savings Equalization Plan, each a nonqualified excess plan to the Retirement Plan and the Savings Plan, respectively, that provides “make-whole” payments to eligible participants in place of the portion of the benefits that would have been earned if not for the limits applicable to tax-qualified plans under the Internal Revenue Code. Benefits under the Savings Equalization Plan are in the form of a matching contribution payable in cash shortly after the end of the calendar year to which it relates. The Retirement Excess Plan is described further in the “Pension benefits” section below.
Dr. Sian participates, along with all other eligible U.K.-based employees, in the IMS (UK) Pension Plan, which has a defined contribution section and a frozen defined benefit section. Under the defined contribution section of the plan (the “UK Defined Contribution Plan”), the level of our ordinary contribution ranges from 5% to 11% of a participant’s compensation depending on the level of the participant’s ordinary contribution to this plan (from 2% to 8% of compensation). The maximum amount of a participant’s ordinary contribution varies based on the employee’s age. The defined benefit section of the IMS (UK) Pension Plan (the “UK Defined Benefit Plan”) was frozen as of June 30, 2011 and is described further in the “Pension benefits” section below.
Certain of our key executives, including Dr. Sian (but none of our other named executive officers), participate in our Defined Contribution Executive Retirement Plan (the “DCERP”), a nonqualified defined contribution plan that was frozen to new benefit accruals as of June 30, 2012. The DCERP is described further in the “Nonqualified deferred compensation” section below.
We believe that our retirement programs serve as an important tool to attract and retain our named executive officers and other key employees, and that we would be at a competitive disadvantage if we did not offer an attractive retirement program. We also believe that offering a baseline of stable retirement benefits encourages our named executive officers to make a long-term commitment to us. We do not adjust the level of retirement benefits based on the value of a named executive officer’s long-term incentive awards nor do we adjust the level of a named executive officer’s total direct compensation for a given year in light of the value of retirement benefits.
Severance and change in control arrangements
We provide severance protection to our Chief Executive Officer in his employment agreement, to Dr. Sian pursuant to U.K. statutory requirements and Company practice and to our other named executive officers through our Employee Protection Plan. Certain limited change in control-related protections for our named executive officers apply to their stock options and RSUs, as described below under “Potential payments upon termination or change in control.”
120
Table of Contents
Our severance and change in control protections are designed to be fair and competitive to aid in attracting and retaining experienced executives, including our named executive officers. Our experience in recruiting well-qualified executives is similar to that of other companies in that our executives will often seek to be protected in the event of a termination by us without cause, an adverse change in working conditions that amounts to good reason for the executive to terminate employment or a transaction that may materially affect the terms of the executive’s employment with us. We believe the protection we provide, including the level of severance payments, post-termination benefits and our limited change in control benefits, is appropriate and within the range of competitive practice.
Perquisites
During our 2013 fiscal year, we did not provide perquisites to any of our named executive officers, apart from Dr. Sian, to whom we provided a monthly car allowance intended to cover the costs of owning and operating a vehicle. The Committee believes that the cost of providing this perquisite is reasonable relative to its value to Dr. Sian.
Other policies
Other policies and practices that will contribute to achieving the objectives of our compensation program include:
Stock ownership guidelines. Due to restrictions on the transfer of our common stock and long-term incentive awards since the Merger, we have not needed to have stock ownership guidelines in place since the Merger. We intend to consider adopting stock ownership guidelines in the future that will require our named executive officers to own an equity stake in us during their employment.
Clawback policy. We currently have a written policy that provides that if we are required to prepare an accounting restatement due to our material noncompliance with financial reporting requirements that results from misconduct by any of our executive officers, our chief accounting officer or any of our directors, we will have the right to recover any bonus or other incentive-based cash or equity compensation paid to, or any profits realized from the sale of Company securities by, such officer or director. We may seek recovery of such amounts only during the first 12 months following the first public issuance or filing with the SEC of the financial document embodying such financial reporting requirement. In the future, we intend to amend our policy on recovery of incentive-based compensation to conform to the applicable requirements of the Dodd-Frank Act and related rulemaking.
Risk assessment
The Committee has reviewed our compensation programs and has concluded that the risks arising from our compensation practices are not reasonably likely to have a material adverse effect on us.
121
Table of Contents
Tax deductibility
Because our common stock is not currently publicly traded, executive compensation paid in our 2013 fiscal year was not subject to the provisions of Section 162(m) of the Internal Revenue Code, which limits the deductibility of compensation paid to certain individuals to $1 million, excluding qualifying performance-based compensation and certain other compensation. Following this offering, at such time as we are subject to the deduction limitation under Section 162(m) of the Internal Revenue Code, we expect that the Committee will consider the impact of Section 162(m) of the Internal Revenue Code when structuring our executive compensation arrangements with our named executive officers. However, the Committee will retain flexibility to approve compensation arrangements that promote the objectives of our compensation program but that may not qualify for full or partial tax deductibility.
Summary compensation table
The following table sets forth information regarding the compensation awarded to, earned by or paid to each of our named executive officers during our 2013 fiscal year.
| Name and principal position |
Year | Salary ($) |
Bonus |
Stock awards ($)(1) |
Non-equity incentive plan compensation ($)(2) |
Change in ($)(3) |
All other compensation ($)(4) |
Total ($) |
||||||||||||||||||||||||
|
|
||||||||||||||||||||||||||||||||
| Ari Bousbib |
2013 | 1,200,000 | 200,000 | (5) | — | 3,600,000 | 227,763 | 128,776 | 5,356,539 | |||||||||||||||||||||||
| Chairman, Chief Executive Officer & President |
||||||||||||||||||||||||||||||||
| Ronald E. Bruehlman |
2013 | 412,500 | — | — | 410,000 | 39,457 | 22,925 | 884,882 | ||||||||||||||||||||||||
| Senior Vice President & Chief Financial Officer |
||||||||||||||||||||||||||||||||
| Paul M. Thomson |
2013 | 372,500 | — | 563,500 | 365,000 | 43,541 | 22,004 | 1,366,545 | ||||||||||||||||||||||||
| Senior Vice President, Human Resources & Administration |
||||||||||||||||||||||||||||||||
| Satwinder Sian |
2013 | 391,818 | — | — | 372,832 | 152,512 | 131,943 | 1,049,105 | ||||||||||||||||||||||||
| Senior Vice President, Global Technology & Operations (6) |
||||||||||||||||||||||||||||||||
| Stefan C. Linn |
2013 | 400,250 | — | — | 372,500 | 36,484 | 22,088 | 831,322 | ||||||||||||||||||||||||
| Senior Vice President, Strategy & Global Pharma Solutions |
||||||||||||||||||||||||||||||||
|
|
||||||||||||||||||||||||||||||||
| (1) | Represents the aggregate grant date fair value of RSUs granted to Mr. Thomson in 2013 computed in accordance with FASB ASC Topic 718. The fair value of each grant of RSUs at the grant date is equal to the number of RSUs granted multiplied by the fair market value of a share of our common stock on the date of grant (excluding the effect of estimated forfeitures based on service-based vesting conditions). Mr. Thomson was granted 350,000 RSUs on February 13, 2013 when the fair market value of a share of our common stock was equal to $1.35 and an additional 83,486 RSUs on August 6, 2013 when the fair market value of a share of our common stock was equal to $1.09. See “—Payments and adjustments in connection with cash dividend.” |
122
Table of Contents
| (2) | Represents each named executive officer’s annual cash bonus earned for our 2013 fiscal year under our Annual Plan. |
| (3) | Represents the change in the actuarial present value of the accumulated benefit of each named executive officer (other than Dr. Sian) under the Retirement Plan and Retirement Excess Plan (or, for Dr. Sian, under the U.K. Defined Benefit Plan) measured from December 31, 2012 to December 31, 2013. For Dr. Sian, the amount also represents the dollar value of interest earned on compensation deferred under the DCERP in excess of 120% of the long-term applicable federal rate for December 2013 (3.99% using annual compounding) (the interest crediting rate on deferred compensation under the plan for our 2013 fiscal year was 4.50% ($2,198). As of June 30, 2012, the DCERP is frozen as to new benefit accruals but not as to earnings on previously accrued benefits. |
| (4) | Amounts included in the “All other compensation” include the following items, as applicable to each named executive officer for our 2013 fiscal year: |
| Name | 401(k) ($)(a) |
Payments ($)(b) |
Company Contribution ($)(c) |
Automobile ($)(d) |
Dividend ($)(e) |
Total ($) |
||||||||||||||||||
|
|
||||||||||||||||||||||||
| Ari Bousbib |
7,650 | 121,126 | — | — | — | 128,776 | ||||||||||||||||||
| Ronald E. Bruehlman |
7,650 | 15,275 | — | — | — | 22,925 | ||||||||||||||||||
| Paul M. Thomson |
7,650 | 14,354 | — | — | — | 22,004 | ||||||||||||||||||
| Satwinder Sian |
— | — | 63,623 | 26,727 | 41,593 | 131,943 | ||||||||||||||||||
| Stefan C. Linn |
7,650 | 14,438 | — | — | — | 22,088 | ||||||||||||||||||
|
|
||||||||||||||||||||||||
| (a) | Represents our matching contributions to the Savings Plan, which is a broad-based tax-qualified defined contribution plan. |
| (b) | Represents certain make-whole payments made to our U.S.-based named executive officers. These amounts would have been contributed by us to the Savings Plan under the plan’s matching contribution formula if not for certain limits applicable to tax-qualified plans under the Internal Revenue Code. |
| (c) | Represents our contributions to the investment fund maintained for Dr. Sian under the UK Defined Contribution Plan. |
| (d) | Represents monthly car allowance payments made to Dr. Sian. |
| (e) | Represents certain cash dividend equivalent amounts paid during our 2013 fiscal year with respect to all vested stock appreciation rights held by Dr. Sian as of August 6, 2013. These payments were made in lieu of reducing the base price of the stock appreciation rights. Had the base price been reduced, the aggregate amount of the reduction would have equaled the amount of the cash dividend equivalent payments. In addition, certain cash dividend equivalents were also paid during our 2013 fiscal year with respect to all vested stock options and all stock options that were eligible to vest prior to December 1, 2013 held by each of our named executive officers, in the following amounts: Mr. Bousbib—$5,980,000, Mr. Bruehlman—$312,000, Mr. Thomson—$390,000, Dr. Sian—$364,000 and Mr. Linn—$806,000. These payments were made in lieu of reducing the exercise prices of these stock options (which was required by the terms of the 2010 Equity Plan on the dates these stock options were granted) and the payment per option was equal to the amount of the per share reduction in the exercise price that would have otherwise occurred. |
| (5) | Represents a supplemental cash bonus awarded to Mr. Bousbib with respect to our 2013 fiscal year. |
| (6) | Dr. Sian was paid in U.K. pounds sterling. Amounts for Dr. Sian in the Summary compensation table and the other tables in this section, where applicable, have been converted from U.K. pounds sterling to U.S. dollars based on an exchange rate of .6169, which was set in September 2012 for purposes of the Annual Plan. |
Grants of plan-based awards
The following table sets forth information regarding plan-based awards made to each of our named executive officers during our 2013 fiscal year.
| Grant date |
Potential payouts under non-equity incentive plan awards(1) |
All other stock awards number of shares of stock or units (#) |
Grant date fair of stock ($)(4) |
|||||||||||||||||||||
| Name | Threshold ($)(2) |
Target ($) |
Maximum ($)(3) |
|||||||||||||||||||||
|
|
||||||||||||||||||||||||
| Ari Bousbib |
— | — | 1,800,000 | 3,600,000 | — | — | ||||||||||||||||||
| Ronald E. Bruehlman |
— | — | 288,630 | 577,260 | — | — | ||||||||||||||||||
| Paul M. Thomson |
— | — | 260,678 | 521,356 | — | — | ||||||||||||||||||
| 2/13/2013 | — | — | — | 350,000 | 472,500 | |||||||||||||||||||
| 8/6/2013 | — | — | — | 83,486 | 91,000 | |||||||||||||||||||
| Satwinder Sian |
— | — | 274,272 | 548,545 | — | — | ||||||||||||||||||
| Stefan C. Linn |
— | — | 280,144 | 560,288 | — | — | ||||||||||||||||||
|
|
||||||||||||||||||||||||
| (1) | Represents annual cash bonus opportunities granted under the Annual Plan. As described in “—Short-term incentive plan” above, each named executive officer was eligible to receive a target annual bonus that is equal to a percentage of his annual |
123
Table of Contents
| base salary. The actual amount paid to our named executive officers under the Annual Plan for our 2013 fiscal year is reflected in the Summary compensation table above. |
| (2) | Under the Annual Plan, if our actual Adjusted EBITDA for our 2013 fiscal year were achieved at a threshold Adjusted EBITDA level, the Annual Plan would have been funded at 50% for our 2013 fiscal year, subject to the further plan-wide adjustments described above. However, each named executive officer’s actual annual cash bonus was determined based on the achievement of individual performance goals for which there is no threshold achievement level. See “—Short-term incentive plan.” |
| (3) | Under the Annual Plan, if our actual Adjusted EBITDA and Cash Flow Percentage had been achieved at maximum levels and the Committee and Mr. Bousbib had exercised their discretion to increase the funding of the Annual Plan for our 2013 fiscal year to the maximum extent permitted by the Annual Plan, the plan-wide funding level would have exceeded 200% of the target funding level. However, each named executive officer’s actual annual cash bonus is determined based on the achievement of individual performance goals, and achievement of those goals at a maximum level would have resulted in an annual cash bonus that could not have been greater than 200% of the named executive officer’s target incentive award under the Annual Plan. See “—Short-term incentive plan.” |
| (4) | Mr. Thomson was granted 350,000 RSUs on February 13, 2013 when the fair market value of a share of our common stock was equal to $1.35. As described in “—Payments and adjustments in connection with a cash dividend” above, in connection with the cash dividend paid on August 6, 2013, Mr. Thomson was granted an additional 83,486 RSUs when the fair market value of a share of our common stock was equal to $1.09. |
Narrative disclosure to Summary compensation table and grants of plan-based awards table
We are a party to an employment agreement with Mr. Bousbib, which was amended and restated as of February 12, 2014. The agreement has an initial three-year term and the term of the agreement automatically renews on each February 12, beginning in 2017, unless either party gives a notice of non-renewal at least 60 days in advance. Under his employment agreement, as in effect during our 2013 fiscal year, Mr. Bousbib was entitled to an annual base salary of $1.2 million and was eligible to earn an annual cash bonus for each fiscal year based on pre-established performance goals, with a target annual cash bonus equal to 150% of his annual base salary. Under his amended and restated employment agreement, effective January 1, 2014, Mr. Bousbib’s annual base salary has been increased to $1.6 million and his target annual cash bonus has been increased to 200% of his annual base salary. Mr. Bousbib’s annual cash bonus for 2013, as earned under the Annual Plan, is included in the Non-equity incentive plan compensation column of the Summary compensation table. Pursuant to the employment agreement, Mr. Bousbib is also entitled to participate in our savings, retirement and welfare plans in accordance with their terms.
We are also party to an employment agreement with Dr. Sian dated February 24, 1993. The agreement sets forth Dr. Sian’s initial base salary, which has been subsequently increased. Pursuant to the employment agreement, Dr. Sian is entitled to participate in certain U.K.-based benefit plans and to certain automobile-related benefits, in our discretion. The contract requires both parties to give twelve weeks written notice of any intention to terminate Dr. Sian’s employment, but does not provide for benefits beyond those that are statutorily required.
We have not entered into employment agreements with any of our other named executive officers.
The RSUs granted to Mr. Thomson in 2013 vested on February 13, 2014.
For a description of the payments and benefits our named executive officers may be entitled to in connection with a termination of employment, see “—Potential payments upon termination or change in control.”
124
Table of Contents
Outstanding equity awards at fiscal year-end
The following table sets forth information regarding equity awards held by our named executive officers as of December 31, 2013.
| Name | Option awards | Stock awards | ||||||||||||||||||||||||||
| Number of SARs (exercisable) (#) |
Number of (unexercisable) (#) |
Equity (#) |
Option ($)(1) |
Option or SAR |
Number of units of stock that have not vested (#) |
Market shares or units of stock that have not vested ($)(2) |
||||||||||||||||||||||
|
|
||||||||||||||||||||||||||||
| Ari Bousbib |
5,000,000 | — | — | 1.08 | (5) | 12/1/2020 | — | — | ||||||||||||||||||||
| — | 5,000,000 | — | 0.82 | (5) | 12/1/2020 | — | — | |||||||||||||||||||||
| 12,000,000 | — | — | 1.00 | 12/1/2020 | — | — | ||||||||||||||||||||||
| 3,600,000 | — | — | 0.58 | 12/1/2020 | — | — | ||||||||||||||||||||||
| — | 7,200,000 | 4,800,000 | 0.32 | 12/1/2020 | — | — | ||||||||||||||||||||||
| — | — | 2,400,000 | (4) | 0.58 | 12/1/2020 | — | — | |||||||||||||||||||||
| Ronald E. Bruehlman |
600,000 | — | — | 1.12 | 7/16/2021 | — | — | |||||||||||||||||||||
| 600,000 | — | — | 0.70 | 7/16/2021 | — | — | ||||||||||||||||||||||
| — | 1,580,000 | 720,000 | 0.44 | 7/16/2021 | — | — | ||||||||||||||||||||||
| Paul M. Thomson |
1,000,000 | — | — | 1.00 | 10/28/2020 | — | — | |||||||||||||||||||||
| 300,000 | — | 200,000 | (4) | 0.58 | 10/28/2020 | — | — | |||||||||||||||||||||
| — | 600,000 | 400,000 | 0.32 | 10/28/2020 | — | — | ||||||||||||||||||||||
| — | — | — | — | — | 433,486 | 472,500 | ||||||||||||||||||||||
| Satwinder Sian |
159,973.33 | (3) | — | — | 0.25 | (6) | 4/21/2016 | — | — | |||||||||||||||||||
| 900,000 | — | — | 1.00 | 3/15/2020 | — | — | ||||||||||||||||||||||
| 450,000 | — | — | 0.58 | 3/15/2020 | — | — | ||||||||||||||||||||||
| — | 540,000 | 360,000 | 0.32 | 3/15/2020 | — | — | ||||||||||||||||||||||
| 50,000 | — | — | 0.98 | 5/8/2022 | — | — | ||||||||||||||||||||||
| — | 120,000 | 80,000 | 0.72 | 5/8/2022 | ||||||||||||||||||||||||
| Stefan C. Linn |
1,000,000 | — | — | 1.08 | (5) | 10/28/2020 | — | — | ||||||||||||||||||||
| — | 1,000,000 | — | 0.82 | (5) | 10/28/2020 | — | — | |||||||||||||||||||||
| 1,400,000 | — | — | 1.00 | 10/28/2020 | — | — | ||||||||||||||||||||||
| 420,000 | — | 280,000 | (4) | 0.58 | 10/28/2020 | — | — | |||||||||||||||||||||
| — | 840,000 | 560,000 | 0.32 | 10/28/2020 | — | — | ||||||||||||||||||||||
|
|
||||||||||||||||||||||||||||
| (1) | Except as noted below, the exercise price of all stock options was originally equal to 100% of the fair market value of a share of our common stock on the date the options were granted, as determined by our board of directors based, in part, on an independent third party valuation. In connection with the cash dividends paid to our stockholders on October 23, 2012 and August 6, 2013, the exercise prices of certain stock options were reduced by the applicable amount of the per share dividend. With respect to the 2012 cash dividend, the exercise price of each option that was unvested as of the date the cash dividend was paid and that was not eligible to vest prior to December 1, 2012 was reduced by $0.42. With respect to the 2013 cash dividend, the exercise price of each option that was unvested as of the date the cash dividend was paid and that was not eligible to vest prior to December 1, 2013 was reduced by $0.26. |
| (2) | The value shown is equal to the number of RSUs subject to Mr. Thomson’s RSU awards multiplied by the fair market value of a share of our common stock on December 31, 2013 ($1.09). |
| (3) | Represents vested stock appreciation rights based on IMS Health common stock that were rolled over into stock appreciation rights based on our common stock by Dr. Sian in connection with the Merger. |
| (4) | The exercise price of these performance-vesting options was not reduced in connection with the cash dividend paid to our stockholders on August 6, 2013 because a cash dividend equivalent payment of $0.26 per option share was paid with respect to all options (including these) that were eligible to vest prior to December 1, 2013. |
| (5) | Messrs. Bousbib and Linn were granted premium priced options with an exercise price that was originally equal to 150% of the fair market value of a share of our common stock on the date the options were granted. In connection with the cash dividends paid to our stockholders on October 23, 2012 and August 6, 2013, the exercise prices of certain premium priced stock options were reduced by the applicable amount of the per share dividend in the same manner as described in footnote 1 above. |
| (6) | The exercise price of vested stock appreciation rights that were rolled over in connection with the Merger was reduced to $0.25 in a manner that complied with applicable rules under the Internal Revenue Code. |
125
Table of Contents
The following table sets forth the vesting schedule for the stock options or restricted stock units held by our named executive officers that were unvested as of December 31, 2013:
| Name | Number of stock RSUs that have not vested (#) |
Type | Vesting date schedule |
Performance metric | ||||||
|
| ||||||||||
| Ari Bousbib |
2,400,000 | Performance-based options(a) | 9/1/2013 | 2013 Adjusted EBITDA | ||||||
| 3,600,000 | Time-based options(b) | 9/1/2014 | — | |||||||
| 2,400,000 | Performance-based options(a) | 9/1/2014 | 2014 Adjusted EBITDA | |||||||
| 5,000,000 | Time-based sign-on options(c) | 9/1/2015 | Premium Priced Options | |||||||
| 3,600,000 | Time-based options(b) | 9/1/2015 | — | |||||||
| 2,400,000 | Performance-based options(a) | 9/1/2015 | 2015 Adjusted EBITDA | |||||||
| Ronald E. Bruehlman |
360,000 | Time-based options(b) | 7/16/2014 | — | ||||||
| 250,000 | Time-based options(d) | 7/16/2014 | — | |||||||
| 240,000 | Performance-based options(a) | 7/16/2014 | 2013 Adjusted EBITDA | |||||||
| 360,000 | Time-based options(b) | 7/16/2015 | — | |||||||
| 240,000 | Performance-based options(a) | 7/16/2015 | 2014 Adjusted EBITDA | |||||||
| 250,000 | Time-based options(d) | 7/16/2016 | — | |||||||
| 360,000 | Time-based options(b) | 7/16/2016 | — | |||||||
| 240,000 | Performance-based options(a) | 7/16/2016 | 2015 Adjusted EBITDA | |||||||
| Paul M. Thomson |
200,000 | Performance-based options(a) | 10/28/2013 | 2013 Adjusted EBITDA | ||||||
| 433,486 | Time-based RSUs(e) | 2/13/2014 | — | |||||||
| 300,000 | Time-based options(b) | 10/28/2014 | — | |||||||
| 200,000 | Performance-based options(a) | 10/28/2014 | 2014 Adjusted EBITDA | |||||||
| 300,000 | Time-based options(b) | 10/28/2015 | — | |||||||
| 200,000 | Performance-based options(a) | 10/28/2015 | 2015 Adjusted EBITDA | |||||||
| Satwinder Sian |
270,000 | Time-based options(b) | 2/26/2014 | — | ||||||
| 180,000 | Performance-based options(a) | 2/26/2014 | 2014 Adjusted EBITDA | |||||||
| 30,000 | Time-based options(b) | 5/8/2014 | — | |||||||
| 20,000 | Performance-based options(a) | 5/8/2014 | 2013 Adjusted EBITDA | |||||||
| 270,000 | Time-based options(b) | 2/26/2015 | — | |||||||
| 180,000 | Performance-based options(a) | 2/26/2015 | 2015 Adjusted EBITDA | |||||||
| 30,000 | Time-based options(b) | 5/8/2015 | — | |||||||
| 20,000 | Performance-based options(a) | 5/8/2015 | 2014 Adjusted EBITDA | |||||||
| 30,000 | Time-based options(b) | 5/8/2016 | — | |||||||
| 20,000 | Performance-based options(a) | 5/8/2016 | 2015 Adjusted EBITDA | |||||||
| 30,000 | Time-based options(b) | 5/8/2017 | — | |||||||
| 20,000 | Performance-based options(a) | 5/8/2017 | 2016 Adjusted EBITDA | |||||||
| Stefan C. Linn |
280,000 | Performance-based options(a) | 10/28/2013 | 2013 Adjusted EBITDA | ||||||
| 420,000 | Time-based options(b) | 10/28/2014 | — | |||||||
| 280,000 | Performance-based options(a) | 10/28/2014 | 2014 Adjusted EBITDA | |||||||
| 1,000,000 | Time-based options(c) | 10/28/2015 | Premium Priced Options | |||||||
| 420,000 | Time-based options(b) | 10/28/2015 | — | |||||||
| 280,000 | Performance-based options(a) | 10/28/2015 | 2015 Adjusted EBITDA | |||||||
|
| ||||||||||
| (a) | 20% of each grant of performance-based options is eligible to vest based on our achievement of Adjusted EBITDA targets for each of the five fiscal years beginning with (or, with respect to grants made after August 1 of a given year, immediately following) the fiscal year in which the option was granted. If the Adjusted EBITDA target is not met for a fiscal year, the tranche of performance-based options that was eligible to vest in such fiscal year is eligible for “catch-up” vesting if a two-year (based on the original fiscal year and the fiscal year that immediately follows it) Adjusted EBITDA target is met. |
On February 12, 2014, the Committee determined that the Adjusted EBITDA target with respect to our 2013 fiscal year had been achieved.
If performance-based options are earned based on achievement of the Adjusted EBITDA targets, they will vest if the named executive officer remains employed through a specified anniversary of the date the options were granted or the date the named executive officer commenced employment with us.
In addition, on or prior to December 31, 2017, (i) if the Sponsors realize a return of a certain specified multiple of the amount they invested in us, to the extent not already vested, the first 50% of each grant of performance-based options will vest, and (ii) if the Sponsors realize a return of a greater specified multiple of the amount they invested in us, to the extent not already
126
Table of Contents
vested, the second 50% of each grant of performance-based options will vest. After December 31, 2017, the first 50% of the performance-based option grant will vest, to the extent not previously vested, solely upon the Sponsors achieving a certain specified internal rate of return with respect to each year (or partial year) during the period beginning on the closing date of the Merger (February 26, 2010) and ending on the date or dates on which the Sponsors receive proceeds with respect to the shares of our common stock that they hold, and the balance (i.e., the remaining 50%) of the performance-based option grant will vest, to the extent not previously vested, solely upon the Sponsors achieving a greater specified internal rate of return with respect to each year (or partial year) during the period beginning on the closing date of the Merger and ending on the date or dates on which the Sponsors receive proceeds with respect to the shares of our common stock that they hold.
| (b) | 20% of each grant of time-based options (excluding premium priced time-based options) vest on each the first five anniversaries of (i) with respect to Dr. Sian, February 26, 2010 (the closing date of the Merger), and (ii) with respect to each other named executive officer, the grant date or the date the executive was hired, subject, in each case, to the named executive officer’s continued employment with us through the applicable vesting date. |
| (c) | 50% of the grant of premium priced time-based options vested on the third anniversary of the named executive officer’s date of hire (in the case of Mr. Bousbib) or the grant date (in the case of Mr. Linn), and 50% of the grant of premium priced time-based options vests on the fifth anniversary of such date, subject, in each case, to the named executive officer’s continued employment with us through the applicable vesting date. |
| (d) | 50% of the grant of time-based options vests on the third anniversary of the grant date, and 50% of the grant of time-based options vests on the fifth anniversary of the grant date, subject, in each case, to Mr. Bruehlman’s continued employment with us through the applicable vesting date. |
| (e) | 100% of Mr. Thomson’s outstanding time-vesting RSUs vested on February 13, 2014. |
Option exercises and stock vested
None of our named executive officers exercised any stock options or became vested in any stock awards during our 2013 fiscal year.
Pension benefits
The following table sets forth information regarding the present value of the accumulated benefits of our named executive officers under our pension arrangements as of December 31, 2013. No amounts were paid to our named executive officers under our pension arrangements during our 2013 fiscal year.
| Name | Plan name | Number of years (#)(1) |
Present value of accumulated ($) |
|||||||
|
|
||||||||||
| Ari Bousbib |
Retirement Plan | 2.33 | 37,556 | (2) | ||||||
| Retirement Excess Plan | 2.33 | 330,306 | (2)(3) | |||||||
| Ronald E. Bruehlman |
Retirement Plan | 1.42 | 20,666 | (2) | ||||||
| Retirement Excess Plan | 1.42 | 26,883 | (2)(3) | |||||||
| Paul M. Thomson |
Retirement Plan | 2.17 | 31,345 | (2) | ||||||
| Retirement Excess Plan | 2.17 | 53,235 | (2)(3) | |||||||
| Satwinder Sian |
UK Defined Benefit Plan | 18.00 | 902,602 | (4) | ||||||
| Stefan C. Linn |
Retirement Plan | 2.17 | 27,213 | (2) | ||||||
| Retirement Excess Plan | 2.17 | 47,673 | (2)(3) | |||||||
|
|
||||||||||
| (1) | Years are credited based on service from the date the individual became a participant in each plan. Individuals become participants in the Retirement Plan and the Retirement Excess Plan on the first day of the month coincident with or next following the attainment of age 21 and completion of one year of service. Dr. Sian’s credited service is based on his date of joining the IMS (UK) Pension Plan and reflects service through June 30, 2011, the date on which future benefit accruals under the plan ceased due to the plan’s being frozen as of such date. |
| (2) | These amounts represent the actuarial present value of the total retirement benefit that would be payable to each of our named executive officers other than Dr. Sian under the Retirement Plan and Retirement Excess Plan, as applicable, as of December 31, 2013. The following key actuarial assumptions and methodologies were used to calculate the present value of |
127
Table of Contents
| accumulated benefits under both the Retirement Plan and Retirement Excess Plan: a discount rate of 4.7% and 4.5%, respectively. The Pension Protection Act’s 2014 Annuitant Table for post-retirement mortality was used for both plans. The amounts were calculated assuming no future service or compensation increases, and no pre-retirement mortality or termination (i.e., each named executive officer is assumed to retire at age 65 and to receive the benefit of annual interest credits at 3.7% under the Retirement Plan and 3.5% under the Retirement Excess Plan on his account balance until such point). For more information on the assumptions used to derive the amounts, please see Note 8 to our consolidated financial statements included elsewhere in this prospectus. Mr. Thomson is our only named executive officer who was eligible for early retirement as of December 31, 2013. Had Mr. Thomson retired on that date, his account balance under the Retirement Plan would have been $35,343, which would be payable as an annuity under the terms of the plan, and his account balance under the Retirement Excess Plan would have been $53,966, which would be paid to him as a single lump sum in an amount equal to $55,880 under the terms of the plan. |
| (3) | Under the Retirement Excess Plan, if a change in control occurs and a participant’s employment with us is involuntarily terminated within two years following the change in control for a reason other than cause, or the participant voluntarily terminates employment with us for good reason, his accumulated benefit would be payable in a single lump sum on the date of such termination. Had a change in control occurred and our named executive officers who participate in the Retirement Excess Plan each experienced a qualifying termination on December 31, 2013, their account balances under the Retirement Excess Plan would have been as follows: Mr. Bousbib—$375,196, Mr. Bruehlman—$30,366, Mr. Thomson—$53,966 and Mr. Linn—$56,276. Those account balances would be payable to such named executive officers on the date of their termination as single lump sums equal to the following amounts: Mr. Bousbib—$405,463, Mr. Bruehlman—$32,757, Mr. Thomson—$55,880 and Mr. Linn—$61,608. |
| (4) | These amounts represent the actuarial present value of the total retirement benefit that would be payable to Dr. Sian under the UK Defined Benefit Plan as of December 31, 2013. The following key actuarial assumptions and methodologies were used to calculate the present value of accumulated benefits under the UK Defined Benefit Plan: a discount rate of 4.6% and post-retirement mortality assumptions based on the S-1 “All lives” Table (with scaling factors) projected to December 31, 2013 in line with the medium cohort, with future mortality improvements in accordance with CMI 2011, with a long term improvement rate of 1.25% per year. Due to the freeze of the UK Defined Benefit Plan no future service or compensation increases that occur after June 30, 2011 are taken into account under the plan. For more information on the assumptions used to derive the amounts, please see Note 8 to our consolidated financial statements included elsewhere in this prospectus. Dr. Sian is not currently eligible for early retirement under this plan. |
Retirement Plan. All of our named executive officers other than Dr. Sian participate in our Retirement Plan, a tax-qualified defined benefit retirement plan that provides retirement income to our U.S.-based employees. Benefits under the Retirement Plan’s cash balance formula are expressed in the form of a notional account balance. Each month a participant’s cash balance book-keeping account is increased by (i) pay credits of 6% of the participant’s compensation (i.e., base salary, plus annual bonus, commissions, overtime and shift pay) for that month and (ii) interest credits based on the participant’s hypothetical account balance at the end of the prior month. Monthly interest credits are based on 1/12th of the 30-year Treasury bond yields in effect during the applicable month. Participants may retire early at age 55 with three years of service. Normal retirement is at age 65. Pension benefits are payable as an actuarially equivalent annuity. Lump-sum distributions are only available for benefits valued at $5,000 or less. Retirement Plan benefits are provided on a noncontributory basis to employees.
Retirement Excess Plan. All of our named executive officers other than Dr. Sian also participate in our Retirement Excess Plan, a nonqualified defined benefit retirement plan that provides eligible employees with retirement benefits equal to the difference between the benefits provided under the qualified Retirement Plan and the benefits that would have been provided under that plan if not for the limits applicable to tax-qualified plans under the Internal Revenue Code on the amount of compensation that can be taken into account and the amount of annual benefits that can be paid. Benefits under the Retirement Excess Plan are subject to cliff-vesting after three years of service and are payable only in a single lump sum upon the later of the participant attaining age 55 or experiencing a separation from service with us.
UK Defined Benefit Plan. Dr. Sian participates in our UK Defined Benefit Plan, a tax-qualified defined benefit retirement plan that provides retirement income for our U.K.-based employees. The UK Defined Benefit Plan was frozen as to new accruals as of June 30, 2011. Any increases in compensation after that date are disregarded. Dr. Sian and similarly situated participants accrued a pension at a rate of 1/60th of final pensionable salary for each year of pensionable service until
128
Table of Contents
June 30, 2011. Final pensionable salary under the plan is equal to the average of the participant’s highest three consecutive years of pensionable salary out of the last ten years (prior to June 30, 2011). Prior to the plan freeze, participants were required to contribute 7% of compensation to the plan.
Under the UK Defined Benefit Plan, participants may retire early from age 55. The amount of the pension benefit under the plan will be discounted by an amount determined by the plan’s actuary when the participant retires prior to the normal retirement age of 65. If a participant retires after age 65, the amount of the participant’s pension benefit is calculated as if the participant had retired at age 65 but will then be increased to take account of the fact that the participant (as determined by the plan trustee on the advice of the plan’s actuary) did not draw a pension until a later date. Pension benefits are generally payable as an actuarially equivalent life annuity, but a portion of the participant’s pension benefits (as determined by the U.K. tax authority using conversion factors that are set by the plan’s actuary) may be taken as a lump sum.
Nonqualified deferred compensation
Dr. Sian is the only named executive officer who participates in the DCERP. As of June 30, 2012, the DCERP was frozen to new benefit accruals and participants, but previously accrued benefits continue to be eligible to be credited with interest and other investment returns, as described below. Dr. Sian is fully vested in his account under the DCERP.
A participant in the DCERP was able to elect to have his or her account under this plan notionally credited with investment credits (the portion that is so credited is referred to as a “Designated Account”) or, with respect to his or her account as of the closing date of the Merger, notionally invested in shares of our common stock (the portion that is so notionally invested is referred to as a “Stock Account”). Annual investment credits to a Designated Account are calculated based on the average annual corporate bond yields from the AA-AAA Rated/10+ Years Component of the Merrill Lynch U.S. Corporate Master Index. With respect to a Stock Account, upon payment of a cash dividend on shares of our common stock, the amount that would have been paid to a participant had he or she held shares of common stock directly (instead of notional stock units) is credited to the Designated Account. Upon an initial public offering of our common stock, a participant may make an election to have all or a portion of his or her Stock Account reallocated to a Designated Account. A participant’s account under the DCERP is paid as a lump sum on or shortly after the date a participant terminates employment with us. To the extent required to comply with Section 409A of the Internal Revenue Code, payment upon termination of employment is subject to a six-month delay. Investment credits continue to be earned during this six-month delay period.
129
Table of Contents
The following table sets forth information regarding the nonqualified deferred compensation of each of our named executive officers for our 2013 fiscal year. There were no executive or Company contributions to, or, with respect to our named executive officers, distributions from, the DCERP during our 2013 fiscal year.
| Name | Aggregate earnings in last fiscal year ($)(1) |
Aggregate end of |
||||||
|
|
||||||||
| Ari Bousbib |
— | — | ||||||
| Ronald E. Bruehlman |
— | — | ||||||
| Paul M. Thomson |
— | — | ||||||
| Satwinder Sian |
123,099 | 799,487 | ||||||
| Stefan C. Linn |
— | — | ||||||
|
|
||||||||
| (1) | Earnings in the last fiscal year for Dr. Sian represents (i) interest credited to his Designated Account, (ii) amounts credited to his Designated Account as a result of the cash dividend paid on August 6, 2013 and (iii) the increase/decrease during 2013 in the fair market value of shares of our common stock notionally held in his Stock Account. |
| (2) | The aggregate balance at the end of the year consists of the value of Dr. Sian’s account under the DCERP as of December 31, 2013. The Stock Account has been valued using the fair market value of our common stock on this date ($1.09). |
Potential payments upon termination or change in control
Each of our named executive officers is entitled to receive certain benefits upon a qualifying termination of employment and upon certain change in control transactions, as described below.
Employment agreement with Mr. Bousbib
Under the terms of his employment agreement, if we terminate Mr. Bousbib’s employment without cause (as defined in the employment agreement) or we do not renew his agreement, or if Mr. Bousbib resigns for good reason (as defined in the employment agreement), Mr. Bousbib will be entitled to severance in an amount equal to two times the sum of his base salary and target annual bonus, payable in equal installments over the 24-month period following the termination of his employment. If any such termination or resignation for good reason occurs within the 24-month period following a change in control of us (as defined in the employment agreement), Mr. Bousbib will be entitled to the cash severance described above, except that payment will be made in a single lump sum immediately upon such termination. The closing of this offering will not constitute a change in control for purposes of Mr. Bousbib’s employment agreement.
Mr. Bousbib will also be entitled to his accrued but unpaid base salary through the date of termination, any annual bonus in respect of a fiscal year that has been earned but has not been paid and unreimbursed business expenses (referred to as the “Accrued Obligations”).
Upon a termination for cause, a resignation without good reason, or a termination of employment due to his death or disability, Mr. Bousbib will be entitled only to the Accrued Obligations.
It is a condition to Mr. Bousbib’s receipt of the severance payments described above (other than the Accrued Obligations) that he timely execute (without revoking) a release of claims in favor of us and that he comply with certain restrictive covenants set forth in the employment agreement,
130
Table of Contents
including a covenant not to compete with us or to solicit our clients or employees during and for two years following his employment with us. Mr. Bousbib is also bound by other restrictive covenants, including covenants relating to confidentiality and non-disparagement.
Employee protection plan
Each of our named executive officers, other than Mr. Bousbib and Dr. Sian, participates in our Employee Protection Plan (the “EPP”), which provides for certain payments and benefits if the named executive officer’s employment is terminated without cause (as defined in the EPP). Under the EPP, upon a termination of employment without cause (but not within 12 months following a change in control of us (as defined in the EPP)), the named executive officer would be entitled to receive continued base salary payments for a period of time equal to 16 weeks or, if greater, 1.5 weeks for each $10,000 of base salary plus 2 weeks for each year of service (up to a maximum of 78 weeks). Upon a termination without cause within 12 months following a change in control, the named executive officer would be entitled to an amount equal to 130% of the amount described in the prior sentence, payable during the same time period as described in the prior sentence. The closing of this offering will not constitute a change in control for purposes of the EPP.
Upon a termination of employment without cause, in addition to the salary continuation described above, the named executive officer would also be entitled to continued health and life insurance coverage throughout the salary continuation period described above, a pro-rated annual bonus for the year of termination based on actual performance (but only if the named executive officer worked for at least six months in that year), and outplacement services.
A named executive officer will not be entitled to severance benefits under the EPP if he is offered comparable employment with us or an acquiring company. Benefits under the EPP will cease when the named executive officer earns compensation from a new employer, and are offset by the amounts of any other severance payments that are made to the named executive officer or by the amount of any sign-on bonus or similar amounts paid upon commencement of the named executive officer’s employment, if such payments occurred within 12 months of the termination. Any salary continuation or benefits payable under the EPP are conditioned upon the named executive officer’s timely execution (without revoking) of a release of claims in favor of us that may include certain restrictive covenants, including covenants relating to non-competition and non-solicitation of clients or employees that would apply, in each case, during the one-year period following the named executive officer’s termination of employment or, if longer, the named executive officer’s salary continuation period.
Acceleration of options and other stock-based awards
All of our named executive officers hold unvested stock options that are subject only to time-based vesting and also hold unvested stock options that are subject to both time-based and performance-based vesting, as described above. Mr. Thomson also holds time-based RSUs. All outstanding equity awards were granted under the 2010 Equity Plan, which is described below. The award agreements evidencing time-based stock options provide that if such options are not assumed, continued, substituted or cashed-out in connection with certain corporate transactions (including transactions that would constitute a change in control), they will automatically become vested in full. In addition, with respect to all time-based options and Mr. Thomson’s RSUs (to the extent they remain outstanding following a change in control), if the executive’s employment with us is terminated without cause or for good reason (each, as defined in the 2010 Equity Plan) within the two-year period following such change in control, the awards will vest in full as of immediately prior to such termination of employment.
131
Table of Contents
As described above, the performance-based stock options are eligible to vest based on the achievement of certain Adjusted EBITDA performance targets. To the extent such options have not vested because the Adjusted EBITDA target has not been satisfied or they are otherwise not vested, they are eligible to vest based in full or in part upon the Sponsors’ receipt of a certain level of proceeds, including in connection with certain corporate transactions. If the performance-based stock options do not vest as a result of a corporate transaction because the Sponsors do not receive the requisite amount of proceeds, the award agreements evidencing such performance-based stock options provide that such options will either remain outstanding and eligible to vest based on the achievement of Adjusted EBITDA targets for the originally specified vesting period or, if such treatment is not practical, then such options will also automatically vest in full immediately prior to the consummation of such corporate transaction.
Pursuant to the terms of their option award agreements, all of our named executive officers other than Mr. Bousbib are bound by certain restrictive covenants, including a covenant not to compete with us or to solicit our clients or employees during and for one year following the termination of their employment with us, and other covenants relating to confidentiality and non-disparagement.
Payments under pension and nonqualified deferred compensation plans
If Mr. Thomson had terminated employment on the last day of our 2013 fiscal year, assuming he elected early retirement under the Retirement Plan, he would have been entitled to the amounts described in footnote 2 to the Pension benefits table above under the Retirement Plan and the Retirement Excess Plan. If either of Messrs. Bousbib or Linn had terminated employment on the last day of our 2013 fiscal year, no amount would have been immediately payable to him under the Retirement Plan or Retirement Excess Plan, but upon attaining age 55 each executive officer would be entitled to take early retirement benefits under the Retirement Plan and would receive a lump sum payment under the Retirement Excess Plan. If Mr. Bruehlman had terminated employment on the last day of our 2013 fiscal year, he would have forfeited all benefits under the Retirement Plan and the Retirement Excess Plan. If Dr. Sian had terminated employment on the last day of our 2013 fiscal year, no amount would have been immediately payable to him under the UK Defined Benefit Plan, but upon attaining age 55 he would be entitled to take early retirement benefits under the UK Defined Benefit Plan.
If Dr. Sian had terminated employment on the last day of our 2013 fiscal year, his balance under the DCERP, as shown in the Nonqualified deferred compensation table above, would have been payable to him.
The occurrence of a change in control would have no impact on the amount payable, or the vesting or other terms applicable, to our named executive officers under the Retirement Plan, the DCERP or the UK Defined Benefit Plan. Under the Retirement Excess Plan, if a change in control occurs and a participant’s employment with us is involuntarily terminated within two years following the change in control for a reason other than cause, or the participant voluntarily terminates employment with us for good reason, the participant will become fully vested in his or her account balance under the plan and his or her accumulated benefit would be payable in a single lump sum on the date of such termination. The terms “change in control”, “cause” and “good reason” as applied to the Retirement Excess Plan are defined in that plan.
132
Table of Contents
Summary of potential payments
The following tables summarize the payments that would have been made to our named executive officers upon the occurrence of a qualifying termination of employment or change in control, assuming that each named executive officer’s termination of employment with the Company or a change in control of us occurred on December 31, 2013 (the last business day of our most recent fiscal year). If a termination of employment had occurred on this date, severance payments and benefits would have been determined, for Mr. Bousbib, under his employment agreement in effect on such date, for Dr. Sian, pursuant to U.K. statutory requirements and Company practice and, for the other named executive officers, under the EPP, as in effect on such date. Amounts shown do not include (i) accrued but unpaid salary, annual incentive bonuses for 2013 (which are reflected in the “Non-equity incentive plan compensation” column of the Summary compensation table) and vested benefits and (ii) other benefits earned or accrued by the named executive officer during his or her employment that are available to all salaried employees and that do not discriminate in scope, terms or operations in favor of executive officers.
Potential Payments—Ari Bousbib
| Executive payments and benefits upon termination/CIC | Involuntary termination without cause/ for good reason ($) |
CIC without termination ($) |
CIC with termination for good reason or without cause ($) |
|||||||||
|
|
||||||||||||
| Compensation: |
||||||||||||
| Severance |
6,000,000 | (1) | — | 6,000,000 | (1) | |||||||
| Long-term incentives |
— | — | — | |||||||||
| —Acceleration of unvested time-based options(2) |
— | 6,894,000 | 6,894,000 | |||||||||
| —Acceleration of unvested performance-based options(2) |
— | 4,920,000 | 4,920,000 | |||||||||
|
|
|
|||||||||||
| Total |
6,000,000 | 11,814,000 | 17,814,000 | |||||||||
|
|
||||||||||||
| (1) | Represents two times the sum of the executive’s base salary and his target annual bonus, which is the amount payable to the executive under the terms of his employment agreement. |
| (2) | The value of the acceleration of unvested stock options is determined based on the difference between the exercise price of the options and the fair market value of a share of our common stock ($1.09) as of December 31, 2013. For purposes of this table, we have assumed that no time-based options would be assumed, continued or substituted in connection with a change in control and that, as a result, all time-based options would become fully vested in connection with such change in control. We have also assumed that the amount of proceeds received by the Sponsors in connection with a change in control would result in all performance-based options becoming fully vested in connection with such change in control. The actual treatment of stock options in connection with a change in control transaction may be different. |
133
Table of Contents
Potential payments—Ronald E. Bruehlman
| Executive payments and benefits upon termination/CIC | Involuntary termination without cause ($) |
CIC without termination ($) |
CIC with termination without cause ($) |
|||||||||
|
|
||||||||||||
| Compensation: |
||||||||||||
| Severance |
618,750 | (1) | — | 804,375 | (2) | |||||||
| Long-term incentives |
— | — | — | |||||||||
| —Acceleration of unvested time-based options(3) |
— | 1,027,000 | 1,027,000 | |||||||||
| —Acceleration of unvested performance-based options(3) |
— | 468,000 | 468,000 | |||||||||
| Benefits & perquisites: |
||||||||||||
| Health/welfare(4) |
20,537 | — | 20,537 | |||||||||
| Outplacement(5) |
6,500 | — | 6,500 | |||||||||
|
|
|
|||||||||||
| Total |
645,787 | 1,495,000 | 2,326,412 | |||||||||
|
|
||||||||||||
| (1) | Represents an amount equal to 71.5 weeks of the executive’s base salary, which would be payable to the executive in accordance with our customary payroll practices. |
| (2) | Represents an amount equal to 71.5 weeks of the executive’s base salary multiplied by 130%, which would be payable to the executive in accordance with our customary payroll practices. |
| (3) | The value of the acceleration of unvested stock options is determined based on the difference between the exercise price of the options and the fair market value of a share of our common stock ($1.09) as of December 31, 2013. For purposes of this table, we have assumed that no time-based options would be assumed, continued or substituted in connection with a change in control and that, as a result, all time-based options would become fully vested in connection with such change in control. We have also assumed that the amount of proceeds received by the Sponsors in connection with a change in control would result in all performance-based options becoming fully vested in connection with such change in control. The actual treatment of stock options in connection with a change in control transaction may be different. |
| (4) | Represents the cost to us of paying us portion of premiums for medical/prescription drug, dental and life insurance benefits for 17 months following the date of termination. The cost of providing these health care benefits has been calculated using the assumptions used for purposes of our financial statements. |
| (5) | Under the EPP, the executive is entitled to outplacement services not to exceed a cost of $6,500 to us. |
Potential payments—Paul M. Thomson
| Executive payments and benefits upon termination/CIC | Involuntary termination without cause ($) |
CIC without termination ($) |
CIC with termination without cause ($) |
|||||||||
|
|
||||||||||||
| Compensation: |
||||||||||||
| Severance |
501,346 | (1) | — | 651,750 | (2) | |||||||
| Long-term incentives |
— | — | — | |||||||||
| —Acceleration of unvested time-based options(3) |
— | 462,000 | 462,000 | |||||||||
| —Acceleration of unvested RSUs(4) |
472,500 | 472,500 | ||||||||||
| —Acceleration of unvested performance-based options(3) |
— | 410,000 | 410,000 | |||||||||
| Benefits & perquisites: |
||||||||||||
| Health/welfare(5) |
5,673 | — | 5,673 | |||||||||
| Outplacement(6) |
6,500 | — | 6,500 | |||||||||
|
|
|
|||||||||||
| Total |
513,519 | 1,344,500 | 2,008,423 | |||||||||
|
|
||||||||||||
| (1) | Represents an amount equal to 66 weeks of the executive’s base salary, which would be payable to the executive in accordance with our customary payroll practices. |
134
Table of Contents
| (2) | Represents an amount equal to 66 weeks of the executive’s base salary multiplied by 130%, which would be payable to the executive in accordance with our customary payroll practices. |
| (3) | The value of the acceleration of unvested stock options is determined based on the difference between the exercise price of the options and the fair market value of a share of our common stock ($1.09) as of December 31, 2013. For purposes of this table, we have assumed that no time-based options would be assumed, continued or substituted in connection with a change in control and that, as a result, all time-based options would become fully vested in connection with such change in control. We have also assumed that the amount of proceeds received by the Sponsors in connection with a change in control would result in all performance-based options becoming fully vested in connection with such change in control. The actual treatment of stock options in connection with a change in control transaction may be different. |
| (4) | The value of the acceleration of unvested RSUs is determined by multiplying the number of unvested RSUs (433,486) by the fair market value of a share of our common stock ($1.09) as of December 31, 2013. For purposes of this table, we have assumed that the Committee would have exercised its discretion to vest all unvested RSUs in connection with a change in control. The actual treatment of RSUs in connection with a change in control transaction may be different. |
| (5) | Represents the cost to us of paying our portion of premiums for medical/prescription drug, dental and life insurance benefits for 16 months following the date of termination. The cost of providing these health care benefits has been calculated using the assumptions used for purposes of our financial statements. |
| (6) | Under the EPP, the executive is entitled to outplacement services not to exceed a cost of $6,500 to us. |
Potential payments—Satwinder Sian
| Executive payments and benefits upon termination/CIC | Involuntary termination without cause ($) |
CIC without termination ($) |
CIC with termination without cause ($) |
|||||||||
|
|
||||||||||||
| Compensation: |
||||||||||||
| Redundancy payment(1) |
467,599 | — | 467,599 | |||||||||
| Pay in lieu of notice(2) |
202,626 | 202,626 | ||||||||||
| Long-term incentives |
— | — | — | |||||||||
| —Acceleration of unvested time-based options(3) |
— | 460,200 | 460,200 | |||||||||
| —Acceleration of unvested performance-based options(3) |
— | 306,800 | 306,800 | |||||||||
| Benefits & perquisites: |
||||||||||||
| Outplacement(4) |
32,420 | — | 32,420 | |||||||||
|
|
|
|||||||||||
| Total |
702,645 | 767,000 | 1,469,645 | |||||||||
|
|
||||||||||||
| (1) | Represents the benefits under an informal severance practice for U.K. employees at the executive’s level pursuant to which the executive would receive an amount equal to three weeks of base salary for each year of completed service (up to a maximum of 104 weeks of base pay) (20 years in the case of the executive). The amounts would be payable to the executive in a lump sum at the time of termination. |
| (2) | Represents an amount equal to 6 months’ base salary as payment in lieu of providing notice of termination of employment, payable to the executive in a lump sum at the time of termination. |
| (3) | The value of the acceleration of unvested stock options is determined based on the difference between the exercise price of the options and the fair market value of a share of our common stock ($1.09) as of December 31, 2013. For purposes of this table, we have assumed that no time-based options would be assumed, continued or substituted in connection with a change in control and that, as a result, all time-based options would become fully vested in connection with such change in control. We have also assumed that the amount of proceeds received by the Sponsors in connection with a change in control would result in all performance-based options becoming fully vested in connection with such change in control. The actual treatment of stock options in connection with a change in control transaction may be different. |
| (4) | Under the informal severance practice described above, the executive is entitled to outplacement services, the value of which is estimated for purposes of this table to be $32,420. |
135
Table of Contents
Potential payments—Stefan C. Linn
| Executive payments and benefits upon termination/CIC | Involuntary termination without cause ($) |
CIC without termination ($) |
CIC with termination without cause ($) |
|||||||||
|
|
||||||||||||
| Compensation: |
||||||||||||
| Severance |
532,212 | (1) | — | 691,875 | (2) | |||||||
| Long-term incentives |
— | — | — | |||||||||
| —Acceleration of unvested time-based options(3) |
— | 916,800 | 916,800 | |||||||||
| —Acceleration of unvested performance-based options(3) |
— | 574,000 | 574,000 | |||||||||
| Benefits & perquisites: |
||||||||||||
| Health/welfare(4) |
19,148 | — | 19,148 | |||||||||
| Outplacement(5) |
6,500 | — | 6,500 | |||||||||
|
|
|
|||||||||||
| Total |
557,860 | 1,490,800 | 2,208,323 | |||||||||
|
|
||||||||||||
| (1) | Represents an amount equal to 67.5 weeks of the executive’s base salary, which would be payable to the executive in accordance with our customary payroll practices. |
| (2) | Represents an amount equal to 67.5 weeks of the executive’s base salary multiplied by 130%, which would be payable to the executive in accordance with our customary payroll practices. |
| (3) | The value of the acceleration of unvested stock options is determined based on the difference between the exercise price of the options and the fair market value of a share of our common stock ($1.09) as of December 31, 2013. For purposes of this table, we have assumed that no time-based options would be assumed, continued or substituted in connection with a change in control and that, as a result, all time-based options would become fully vested in connection with such change in control. We have also assumed that the amount of proceeds received by the Sponsors in connection with a change in control would result in all performance-based options becoming fully vested in connection with such change in control. The actual treatment of stock options in connection with a change in control transaction may be different. |
| (4) | Represents the cost to us of paying our portion of premiums for medical/prescription drug, dental and life insurance benefits for 16 months following the date of termination. The cost of providing these health care benefits has been calculated using the assumptions used for purposes of our financial statements. |
| (5) | Under the EPP, the executive is entitled to outplacement services not to exceed a cost of $6,500 to us. |
Director compensation
The following table shows information regarding the compensation earned by our non-employee directors during our 2013 fiscal year. The compensation received by Mr. Bousbib as an employee during our 2013 fiscal year is included in the Summary compensation table above and he did not receive any additional compensation for his service on our board of directors. Only our non-Sponsor, non-employee directors receive compensation for their service on our board of directors.
| Name | Fees earned or paid in cash ($) |
Stock awards ($)(1) |
Total ($)(2) |
|||||||||
|
|
||||||||||||
| Sharad S. Mansukani |
60,000 | 89,785 | 149,785 | |||||||||
| Ronald A. Rittenmeyer |
60,000 | 89,785 | 149,785 | |||||||||
| André Bourbonnais |
— | — | — | |||||||||
| John G. Danhakl |
— | — | — | |||||||||
| David Lubek |
— | — | — | |||||||||
| Nehal Raj |
— | — | — | |||||||||
| Jeffrey K. Rhodes |
— | — | — | |||||||||
| Todd B. Sisitsky |
— | — | — | |||||||||
| Bryan M. Taylor |
— | — | — | |||||||||
|
|
||||||||||||
136
Table of Contents
| (1) | The amount reported represents the aggregate grant-date fair value of RSUs granted in our 2013 fiscal year computed in accordance with FASB ASC Topic 718. The fair value of each grant of RSUs at the grant date is equal to the number of RSUs granted multiplied by the fair market value of a share of our common stock on the date of grant. Dr. Mansukani and Mr. Rittenmeyer each was granted 50,000 RSUs on May 8, 2013 when the fair market value of a share of our common stock was equal to $1.35 and an additional 20,445 RSUs when the fair market value of a share of our common stock was equal to $1.09. See “Payments and adjustments in connection with Company dividend” under “Compensation discussion and analysis” above for more information. As of December 31, 2013, Dr. Mansukani and Mr. Rittenmeyer each held 106,160 RSUs and none of our other directors held any stock awards. |
| (2) | In addition to the items required to be reported in the above table, Dr. Mansukani and Mr. Rittenmeyer each received a cash dividend equivalent payment of $78,800 made with respect to all vested stock options and all stock options that were eligible to vest prior to December 1, 2013 held by the director. These payments were made in lieu of reducing the exercise prices of these stock options (as had been required by the terms of the 2010 Equity Plan on the date these stock options were granted) and the payment per option was equal to the amount of the per share reduction in the exercise price that would have otherwise occurred. As of December 31, 2013, Dr. Mansukani and Mr. Rittenmeyer each held 500,000 stock options and none of our other directors held any stock options. |
Non-employee director compensation program. Under our current non-employee director compensation program, each member of our board of directors who is not an employee and who is not affiliated with our Sponsors is eligible to receive an annual cash retainer of $60,000, and an annual grant of 50,000 RSUs that vest in equal installments on each of the first two anniversaries of the date of grant, subject to continued service on each such vesting date. The RSUs will become fully vested upon certain corporate transactions, unless the Committee provides for their assumption or substitution in connection with such transaction. When a director first commences service with us, he or she is also entitled to receive an award of 500,000 stock options that vests in equal installments on each of the first five anniversaries of the date of grant, subject to continued service on each such vesting date. The stock options will become fully vested upon certain corporate transactions, unless they are assumed or substituted in connection with such transaction as provided for under the 2010 Equity Plan. On February 12, 2014, our board of directors approved the vesting of all currently unvested stock options and restricted stock units held by Dr. Mansukani and Mr. Rittenmeyer as of the date this offering is completed, subject to the directors’ continued service to the Company through that date. Our board of directors has the ability to alter the terms of our director compensation program at any time.
On February 12, 2014, the Committee approved a new non-employee director compensation program, which will replace our current non-employee director compensation program effective upon the completion of this offering. Under the new non-employee director compensation program, each member of our board of directors who is not an employee and who is not affiliated with our Sponsors will be eligible to receive an annual cash retainer payment of $60,000 and an annual grant of restricted stock units with a grant date fair market value of $150,000. The annual grant of restricted stock units will vest in full on the first anniversary of the date of grant, subject to the director’s continued service as a member of our board of directors through the vesting date. In addition, under the new program, eligible directors will receive the following additional cash payments on an annual basis for service on the committees of our board of directors: audit committee chairperson – $30,000; leadership development and compensation committee chairperson – $25,000; nominating and corporate governance committee chairperson – $15,000; audit committee member – $10,000; leadership development and compensation committee member – $5,000; and nominating and corporate governance committee member – $5,000. None of the committee membership fees will be payable to the chairperson of the committee, who will instead receive the applicable chairperson fee for his or her committee service.
2014 Cash Bonus Program
Our named executive officers are each entitled to participate in our Annual Plan for our 2014 fiscal year. The terms of our of Annual Plan for our 2014 fiscal year, as they apply to our named
137
Table of Contents
executive officers and our other senior executives, will be generally the same as the terms that applied for our 2013 fiscal year, as described above under “—Executive compensation—Elements of compensation—Short-term incentive plan.” Cash bonus awards payable in respect of our 2014 fiscal year will be determined based on the achievement of pre-established corporate and individual performance goals. The corporate performance goals for 2014 under our Annual Plan will be based on Adjusted EBITDA and Cash Flow Percentage, as they were for our 2013 fiscal year annual bonuses. The individual performance goals for our 2014 fiscal year include, in general, objectives related to achieving certain financial goals, establishing and extending certain technological initiatives, increasing internal product development and productivity, successfully completing acquisitions of technologies and companies and integrating acquisitions, successfully completing this offering, implementing strong reporting and investor relations processes, expanding our training and development programs, as well as other leadership, compliance and research and development goals. The target annual bonus as a percentage of annual base salary for each of our named executive officers will be unchanged for our 2014 fiscal year annual bonuses from the percentages that applied for our 2013 fiscal year annual bonuses, except that Mr. Bousbib’s target annual bonus for our 2014 fiscal year has been increased to 200% of his annual base salary.
2014 Incentive and Stock Award Plan
On February 12, 2014, our board of directors adopted the IMS Health Holdings, Inc. 2014 Incentive and Stock Award Plan (the “2014 Plan”). Following the completion of this offering, both annual award opportunities and equity-based awards for certain key employees, including our named executive officers, non-employee directors, consultants and other persons who provide substantial services to the Company will be granted under the 2014 Plan. The following is a description of the material terms of the 2014 Plan. This summary is not a complete description of all provisions of the plan and is qualified in its entirety by reference to the 2014 Plan, which will be filed as an exhibit to the registration statement of which this prospectus is a part.
Plan Administration. The 2014 Plan is administered by the Committee, which has the authority to, among other things, interpret the 2014 Plan, determine eligibility for, grant and determine the terms of awards under the 2014 Plan. The Committee’s determinations under the 2014 Plan will be final, conclusive and binding.
Authorized Shares. Subject to adjustment, the maximum number of shares of our common stock that may be delivered in satisfaction of awards under the 2014 Plan is , plus up to of shares of our common subject to outstanding equity awards under the 2010 Plan. If awards under either the 2010 Plan or the 2014 Plan are canceled, expired, forfeited, settled in cash, otherwise terminated without delivery of shares, or if shares underlying the awards are used as payment of the exercise price or taxes due upon exercise of the awards, those shares become available again for grant under the 2014 Plan. Shares of our common stock are counted against those reserved under the 2014 Plan only when those shares have been delivered and are no longer subject to a substantial risk of forfeiture. Shares of common stock to be issued under the 2014 Plan may be authorized but unissued shares of common stock or previously-issued shares acquired by the Company or its subsidiaries.
Individual Limits. The maximum number of shares subject to awards granted to any person in any fiscal year is shares, subject to certain adjustments. The maximum amount payable to any person in any fiscal year under cash awards is $ . In addition, in the case of a non-employee
138
Table of Contents
director, additional limits apply such that the maximum grant-date fair value of stock-denominated awards granted in any fiscal year during any part of which the director is then eligible under the 2014 Plan is $ , except that such limit for a non-employee chairman of our board of directors or lead director is $ .
Eligibility. The Committee may grant awards under the 2014 Plan to our employees, non-employee directors, consultants or other persons providing substantial services to the Company or to a subsidiary.
Types of Awards. The 2014 Plan provides for grants of stock options (including incentive stock options, which are referred to herein as ISOs), stock appreciation rights, restricted and deferred stock (including restricted stock units), dividend equivalents, other stock-based awards and performance awards, including annual incentive awards. The 2014 Plan permits the grant of performance awards that are intended to qualify as exempt performance-based compensation under Section 162(m) of the Internal Revenue Code, to the extent applicable, as well as awards that are not intended to so qualify. During a transition period following the completion of this offering, the 2014 Plan will also allow for the grant of performance awards that are exempt from Section 162(m) of the Internal Revenue Code and its requirements under a special transition rule under Section 162(m).
Performance Criteria. Performance awards may be made subject to the achievement of “performance conditions” specified by the Committee. Performance conditions for awards intended to qualify as performance-based compensation for purposes of Section 162(m) of the Internal Revenue Code shall be contingent on the achievement of certain business criteria, which will consist of determinable measures of performance relating to any or any combination of the following (measured either absolutely or by reference to an index or the performance of one or more companies and determined either on a consolidated basis and/or for specified subsidiaries or affiliates or other business units of the Company): net sales; revenues; earnings measures, including earnings from operations, earnings before or after taxes, earnings before or after interest, depreciation, amortization, or extraordinary or special items; pre-tax income, net income or net income per common share (basic or diluted); return measures, including return on assets (gross or net), return on investment, return on capital, or return on equity; cash flow, free cash flow, cash flow return on investment (discounted or otherwise), net cash provided by operations, or cash flow in excess of cost of capital; interest expense after taxes; net economic profit (operating earnings minus a charge for capital) or economic value created; operating margin or profit margin; stockholder value creation measures, including stock price or total stockholder return; dividend payout levels, including as a percentage of net income; expense targets, working capital targets, or operating efficiency; and strategic business criteria, consisting of one or more objectives based on meeting specified market penetration, geographic business expansion goals, cost targets, total market capitalization, agency ratings of financial strength, completion of capital and borrowing transactions, business retention, new product development, customer satisfaction, employee satisfaction, management of employment practices and employee benefits, supervision of information technology, litigation-related milestones, goals related to capital structure and goals relating to acquisitions or divestitures of subsidiaries, affiliates or joint ventures. Achievement of performance goals in respect of performance awards will be measured over a performance period specified by the Committee, which may be one year or a period shorter or longer than one year. Performance goals will be established not later than the earlier of 90 days after the beginning of any performance period or the time 25% of such performance period has elapsed.
139
Table of Contents
Annual Incentive Awards. The Committee may grant annual incentive award opportunities under the 2014 Plan to participants, including those designated by the Committee as likely to be “covered employees” under Section 162(m) of the Internal Revenue Code. Annual incentive award opportunities granted to “covered employees” will be intended to qualify as exempt performance-based compensation under Section 162(m) of the Internal Revenue Code. Within the time periods specified for performance awards under the 2014 Plan, the Committee will determine eligibility for annual incentive awards, establish the performance criteria and performance periods applicable to such awards, the amount or amounts payable if the performance criteria are achieved, and such other terms as the Committee deems appropriate. However, during a transition period following the completion of this offering, the Committee may grant annual incentive awards to “covered employees” under the 2014 Plan that are exempt from Section 162(m) and its requirements under a special transition rule.
Vesting. The Committee has the authority to determine the vesting schedule applicable to each award, and to accelerate the vesting or exercisability of any award.
Termination of Employment or Service. The Committee may determine the effect of termination of employment or service on an award. Unless otherwise provided by the Committee, upon a termination of employment or service all unvested stock options, stock appreciation rights, restricted shares and deferred stock awards will be forfeited. Further, unless otherwise determined by the Committee, in the event of a participant’s termination of employment or service, the award will remain exercisable for the shorter of a period of 30 days or the period ending on the latest date on which an award could otherwise have been exercised, and all stock options and stock appreciation rights will be immediately forfeited upon a participant’s termination of employment or service for cause. The Committee may modify the treatment of awards upon a termination of employment or service, including by providing for additional vesting upon terminations in specific situations or by modifying the post-termination exercise periods of awards requiring exercise.
Transferability. Awards under 2014 Plan may not be transferred except by will or the laws of descent and distribution, unless (for awards other than ISOs and stock appreciation rights issued in tandem with ISOs) otherwise provided by the Committee.
Corporate Transactions. In the event of certain corporate transactions (including the sale of substantially all of the assets or change in ownership of the stock of the Company or a merger, consolidation or other similar transaction), the Committee may provide for the continuation or assumption of outstanding awards, for new grants in substitution of outstanding awards, for the cash out of awards or for the accelerated vesting or delivery of shares under awards, in each case, on such terms and with such restrictions as it deems appropriate. Except as otherwise provided in an award agreement, awards not assumed or accelerated will be terminated upon the consummation of such corporate transaction.
Adjustment. In the event of certain corporate transactions (including a stock dividend, stock split or combination of shares, special and non-recurring dividend, recapitalization or other change in the Company’s capital structure), the Committee will make appropriate adjustments to the maximum number of shares that may be delivered under the 2014 Plan, and will also make appropriate adjustments to the number and kind of shares of stock or securities subject to awards, the exercise prices of such awards or any other terms of awards affected by such change. The 2014 Plan also requires that the Committee make adjustments of the type described in the preceding sentence to stock options and restricted stock units issued under the 2010 Plan. In
140
Table of Contents
addition, the Committee is authorized to make adjustments in the terms and conditions of, and the criteria included in, awards (including performance awards and performance goals) in recognition of unusual or nonrecurring events, in response to changes in applicable laws or accounting principles, or for certain other reasons.
Recovery of Compensation. Awards under the 2014 Plan will be subject to forfeiture, termination and rescission, and a participant who receives a payment pursuant to the 2014 Plan will be obligated to return such payment to us as required by law or applicable stock exchange listing standards or otherwise in accordance with any applicable company recoupment policy. In addition, the Committee may condition a participant’s right to receive an award or to retain shares of our common stock, cash or other property acquired in connection with an award or any gains in respect of an award upon compliance with, among other things, applicable non-competition, non-solicitation and other similar covenants.
Amendment and Termination. Our board of directors may amend, suspend or terminate the 2014 Plan or the Committee’s authority to grant awards under the 2014 Plan, subject to a requirement that any amendment will be approved by the Company’s stockholders if required by law, including Section 162(m) of the Internal Revenue Code, or applicable stock exchange listing standards. The Committee may amend the 2014 Plan and may amend awards granted under the 2014 Plan, except as limited by the 2014 Plan. Our board of directors or the Committee may not, however, amend outstanding awards without the consent of an affected participant if such amendment would materially and adversely affect the legal rights of such participant under any outstanding award.
2010 Equity Plan
The following is a description of the material terms of the 2010 Equity Plan. This summary is not a complete description of all provisions of the plan and is qualified in its entirety by reference to the 2010 Equity Plan, which is filed as an exhibit to the registration statement of which this prospectus is a part. As described above, we adopted the 2014 Plan in connection with this offering. Upon the completion of this offering, we will no longer make awards under the 2010 Equity Plan.
Plan administration. The 2010 Equity Plan is administered by the Committee, which has the authority to, among other things, interpret the 2010 Equity Plan, select eligible persons to receive grants of awards and determine the terms of awards under the 2010 Equity Plan.
Authorized shares. Subject to adjustment, the maximum number of shares of our common stock that may be delivered in satisfaction of awards under the 2010 Equity Plan is 253,417,637. As of , 2014, awards with respect to shares have been granted under this plan.
Eligibility. The Committee, after consultation with our Chief Executive Officer, selects participants from among those key employees and directors of, and consultants and advisors to the Company who are in a position to make a significant contribution to the success of the Company.
Types of awards; vesting. The 2010 Equity Plan provides for grants of stock options (including ISOs), stock appreciation rights, restricted and unrestricted stock and stock units, and performance awards. The Committee has the authority to determine the vesting schedule applicable to each award, and to accelerate the vesting or exercisability of any award.
141
Table of Contents
Termination of employment or service. The Committee will determine the effect of termination of employment or service on an award. Unless otherwise provided by the Committee or in an award agreement, upon a termination of employment or service all unvested options and other awards requiring exercise will terminate and all other unvested awards will be forfeited. Vested options and stock appreciation rights will remain exercisable for one year following death or disability, 90 days following a termination without cause or resignation for good reason, and 30 days following any other termination except a termination for cause (or, if shorter, for the remaining term of the option). If a participant’s service is terminated for cause, all options and other awards requiring exercise (whether or not vested) will immediately terminate.
Transferability. Awards under the 2010 Equity Plan may not be transferred except through will or by the laws of descent and distribution, unless (for awards other than ISOs) otherwise provided by the Committee.
Corporate transactions. In the event of certain corporate transactions (including the sale of substantially all of the assets or change in ownership of our stock or a reorganization, recapitalization, merger, consolidation, exchange or other restructuring), the Committee may provide for the continuation or assumption of outstanding awards, for new grants in substitution of outstanding awards, or for the accelerated vesting or delivery of shares under awards, in each case on such terms and with such restrictions as it deems appropriate. Except as otherwise provided in an award agreement, awards not assumed or accelerated will be terminated upon the consummation of such corporate transaction.
Change in control. In the event of a change in control of the Company (as defined in the 2010 Equity Plan), any awards held by a participant that are continued or assumed in connection with such transaction and that are subject solely to time-based vesting conditions will vest in full if the participant is involuntarily terminated other than for cause or voluntarily terminates for good reason within two years following the change in control.
Adjustment. In the event of certain corporate transactions (including a stock dividend, stock split or combination of shares, recapitalization or other change in our capital structure), the Committee will make appropriate adjustments to the maximum number of shares that may be delivered under the 2010 Equity Plan, and will also make appropriate adjustments to the number and kind of shares of stock or securities subject to awards, the exercise prices of such awards or any other terms of awards affected by such change. The Committee will also make the types of adjustments described above to take into account distributions and other events other than those set forth above if it determines that such adjustments are appropriate to avoid distortion and preserve the value of awards.
Amendment and termination. The Committee may amend the 2010 Equity Plan or outstanding awards, except that the Committee may not alter the terms of an award if it would affect adversely a participant’s rights under the award without the participant’s consent (unless expressly provided in the 2010 Equity Plan or reserved by the Committee).
Phantom SARs. Certain of our employees were granted cash-settled stock appreciation rights under the 2010 Equity Plan in connection with and following the Merger, which we refer to as “Phantom SARs.” None of our directors or named executive officers hold Phantom SARs. Each Phantom SAR represents the conditional right to receive a cash payment based on the appreciation of our common stock upon the occurrence of certain events and will be automatically exercised on the date that is six months following the consummation of this
142
Table of Contents
offering. As a result, we expect to use a portion of the net proceeds from this offering to make cash payments in an estimated amount of $ million in the aggregate to holders of outstanding Phantom SARs. The actual amount of the aggregate payment will be determined based on the fair market value of a share of our common stock on the date the Phantom SARs are exercised. See “Use of proceeds.”
February 2014 Grants. In February 2014, we granted eight employees options to purchase 1,150,000 shares of our common stock in the aggregate, at an exercise price equal to $1.95, one employee an aggregate of 150,000 Phantom SARs, and 23 employees an aggregate of 14,300,000 restricted stock units, including an award of 10,000,000 restricted stock units to Mr. Bousbib, 300,000 restricted stock units to Mr. Bruehlman, 300,000 restricted stock units to Dr. Sian and 200,000 restricted stock units to Mr. Linn. The restricted stock units granted to our employees and named executive officers other than our Chief Executive Officer will terminate if this offering is not completed on or prior to December 31, 2015. The stock options are subject to time- and performance-based vesting over a five-year period, subject to the optionee’s continued employment through the applicable vesting date. The Phantom SARs are subject to the vesting and settlement terms described in the section above. Fifty percent of the restricted stock units vest on the second anniversary of February 12, 2014 and the remaining fifty percent vest on the fourth anniversary of February 12, 2014, subject to continued employment. All stock options, Phantom SARs and restricted stock units granted in February 2014 were granted under the 2010 Plan.
143
Table of Contents
Certain relationships and related party transactions
Agreements with our Sponsors and management
In connection with the Merger, we entered into various agreements with our Sponsors and members of our management. These include a stockholders agreement and a management services agreement with our Sponsors or their affiliates and management stockholder and registration rights agreements. These and related arrangements are described below.
Stockholders’ agreement
In connection with the Merger, we entered into a stockholders’ agreement with various investment entities controlled by the Sponsors. This stockholders’ agreement contains agreements among the parties with respect to the election of directors, preemptive rights, rights of first refusal and first offer upon disposition of shares, permitted transferees, tag along rights, drag along rights, registration rights and other actions requiring the approval of stockholders. In connection with this offering, we will enter into an amended and restated stockholders’ agreement pursuant to which the Sponsors will have governance and registration rights following this offering. Pursuant to the registration rights provisions of the amended and restated stockholders’ agreement, following this offering our Sponsors will have demand registration rights, including shelf registration rights, in respect of any shares of common stock held by them, subject to certain conditions. In addition, in the event that we register additional shares of common stock for sale to the public following the completion of this offering, we will be required to give notice of such registration to the Sponsors, and, subject to certain limitations, include shares of common stock held by them in such registration. The agreement includes customary indemnification provisions in favor of the Sponsors, any person who is or might be deemed a control person (within the meaning of the Securities Act and the Exchange Act) and related parties against certain losses and liabilities (including reasonable costs of investigation and legal expenses) arising out of or based upon any filing or other disclosure made by us under the securities laws relating to any such registration.
Management services agreement
In connection with the Merger, we entered into a management services agreement with affiliates of TPG, CPPIB and LGP (collectively, the “Managers”), pursuant to which the Managers will provide management services to us until December 31, 2020, with evergreen one-year extensions thereafter. Pursuant to this agreement, the Managers received aggregate transaction fees of approximately $60 million in connection with services provided by such entities related to the Merger. The Managers also receive an aggregate annual management fee equal to approximately $7.5 million, and reimbursement for out-of-pocket expenses incurred by them, their members or their respective affiliates in connection with the provision of services pursuant to the agreement. Pursuant to the management services agreement, the Managers may provide advisory services related to financings or refinancings, recapitalizations, acquisitions, dispositions or other similar transactions; in connection with any such services the Managers have the right to receive customary fees charged by internationally recognized investment banks for serving as financial advisor in similar transactions. The agreement includes customary exculpation and indemnification provisions in favor of the Managers and their respective affiliates.
144
Table of Contents
The management services agreement will terminate pursuant to its terms upon consummation of this offering, and, upon termination, the Managers will receive a one-time fee in an amount equal to $ million.
Equity investment by management
In connection with the Merger, certain members of management were offered the opportunity to purchase our common stock at a purchase price of $1.00 per share, the then fair market value, and since that time certain new members of management and new directors have been offered the opportunity to purchase our common stock at the fair market value of a share of our common stock at the time of purchase. In addition, in connection with the Merger, certain members of management were also able to roll over IMS Health stock appreciation rights and/or IMS Health common stock held directly in exchange for stock appreciation rights to acquire shares of our common stock and/or shares of our common stock and to notionally invest their existing accounts under IMS Health’s deferred compensation plan in shares of our common stock.
Management stockholders and registration rights agreements
In connection with the Merger, we entered into stockholders’ and registration rights agreements with certain members of management, and other members of management have joined those agreements since the Merger. These stockholders’ and registration rights agreements contain agreements among the parties with respect to voting rights, preemptive rights, permitted transferees, tag along rights, drag along rights, registration rights and other actions relating to certain members of our management. In connection with this offering, other than with respect to registration rights, the material provisions of these agreements will terminate in accordance with their terms.
Transactions with other Sponsor portfolio companies
The Sponsors are private equity firms that have investments in companies that do business with us in the ordinary course of business. We believe these transactions are conducted on an arms-length basis. For fiscal 2013, 2012 and 2011, we recorded approximately $11 million, $11 million and $9 million, respectively, associated with sales of our products and services to companies in which one or more of our Sponsors have investments. For fiscal 2013, 2012 and 2011, we purchased goods and services of approximately $5 million $6 million and $5 million, respectively, from companies in which one or more of the Sponsors have investments.
Certain other relationships
In connection with the offering by our wholly-owned direct subsidiary, Healthcare Technology Intermediate, Inc., of $750 million Senior PIK Notes in August 2013, TPG Capital BD, LLC participated as an initial purchaser, and received $0.8 million in initial purchasers’ discounts in connection therewith. In addition, TPG Capital BD, LLC will participate in the underwriting of the shares of our common stock offered pursuant to this prospectus. See “Underwriting—Conflicts of interest” for additional information.
Related person transactions policy
In connection with this offering, we have adopted a policy with respect to the review, approval and ratification of related person transactions. Under the policy, our nominating and corporate
145
Table of Contents
governance committee is responsible for reviewing and approving related person transactions. In the course of its review and approval of related person transactions, our nominating and corporate governance committee will consider the relevant facts and circumstances to decide whether to approve such transactions. Related person transactions must be approved or ratified by the nominating and corporate governance committee based on full information about the proposed transaction and the related person’s interest. Our policy provides that we generally should not engage in related person transactions, unless:
| • | the transaction offers clear advantages to us, and its purpose is not to confer an advantage on the related person; |
| • | we are acquiring goods or services, and comparable goods or services are not available from unrelated third parties; |
| • | we are selling goods or services, and the terms of the transaction are comparable to terms we provide to unrelated third parties; |
| • | the transaction will be approved for us by independent decision-makers in good faith and without influence of the person who has a conflicting interest; or |
| • | the transaction is in our best interests. |
We did not have a written policy regarding the review and approval of related person transactions immediately prior to this offering. Nevertheless, with respect to such transactions, it was our policy for our board of directors to consider the nature of and business reason for such transactions, how the terms of such transactions compared to those which might be obtained from unaffiliated third parties and whether such transactions were otherwise fair to and in the best interests of, or not contrary to, our best interests.
146
Table of Contents
Principal and selling stockholders
The following table sets forth information relating to the beneficial ownership of our common stock as of December 31, 2013, by:
| • | each person, or group of affiliated persons, known by us to beneficially own more than 5% of our outstanding shares of common stock; |
| • | each of our directors; |
| • | each of our named executive officers; |
| • | all directors and executive officers as a group; and |
| • | each other selling stockholder. |
Beneficial ownership is determined in accordance with SEC rules. In general, under these rules a beneficial owner of a security includes any person who, directly or indirectly, through any contract, arrangement, understanding, relationship or otherwise has or shares voting power or investment power with respect to such security. A person is also deemed to be a beneficial owner of a security if that person has the right to acquire beneficial ownership of such security within 60 days. Except as otherwise indicated, and subject to applicable community property laws, the persons named in the table have sole voting and investment power with respect to all shares of common stock held by that person.
147
Table of Contents
The percentage of shares beneficially owned is computed on the basis of 2,800,047,284 shares of our common stock outstanding as of December 31, 2013. Shares of our common stock that a person has the right to acquire within 60 days of December 31, 2013 are deemed outstanding for purposes of computing the percentage ownership of such person’s holdings, but are not deemed outstanding for purposes of computing the percentage ownership of any other person, except with respect to the percentage ownership of all directors and executive officers as a group. Unless otherwise indicated below, the address for each beneficial owner listed is c/o IMS Health Holdings, Inc., 83 Wooster Heights Road, Danbury, Connecticut 06810.
| Name and address of beneficial owners |
Shares beneficially owned prior to this offering |
Number of shares being offered |
Number of shares subject to option |
Shares beneficially owned after this offering (without option) |
Shares beneficially owned after this offering (with option) | |||||||||||||||
| Number | Percent | Number | Percent | Number | Percent | |||||||||||||||
|
| ||||||||||||||||||||
| 5% stockholders: |
||||||||||||||||||||
| TPG Funds(1) |
1,740,000,000 | 62.1% | ||||||||||||||||||
| CPPIB-PHI(2) |
730,000,000 | 26.1% | ||||||||||||||||||
| Green Equity Investors V, L.P., Green Equity Investors Side V, L.P. and LGP Iceberg Co-invest, LLC(3) |
300,000,000 | 10.7% | ||||||||||||||||||
| Directors and named executive officers: |
||||||||||||||||||||
| Ari Bousbib(4) |
37,148,500 | 1.3% | ||||||||||||||||||
| Ronald E. Bruehlman(5) |
1,869,642 | * | ||||||||||||||||||
| Stefan Linn(6) |
3,300,000 | * | ||||||||||||||||||
| Satwinder Sian(7) |
2,290,247 | * | ||||||||||||||||||
| Paul M. Thomson(8) |
1,850,000 | * | ||||||||||||||||||
| André Bourbonnais |
— | * | ||||||||||||||||||
| John G. Danhakl(3) |
— | * | ||||||||||||||||||
| David Lubek |
— | * | ||||||||||||||||||
| Sharad S. Mansukani(9) |
446,428 | * | ||||||||||||||||||
| Nehal Raj(10) |
— | * | ||||||||||||||||||
| Jeffrey K. Rhodes(11) |
— | * | ||||||||||||||||||
| Ronald A. Rittenmeyer(12) |
1,446,428 | * | ||||||||||||||||||
| Todd B. Sisitsky(13) |
— | * | ||||||||||||||||||
| Bryan M. Taylor(14) |
— | * | ||||||||||||||||||
| All executive officers and directors as a group (17 persons)(15) |
55,325,932 | 1.9% | ||||||||||||||||||
|
| ||||||||||||||||||||
| * | Represents beneficial ownership of less than one percent of our outstanding shares of common stock. |
| (1) | Shares shown as beneficially owned by the TPG Funds include the following: (a) 726,566,616 shares of common stock held by TPG Partners V, L.P., a Delaware limited partnership; (b) 1,900,708 shares of common stock held by TPG FOF V-A, L.P., a Delaware limited partnership; (c) 1,532,676 shares of common stock held by TPG FOF V-B, L.P., a Delaware limited partnership; (d) 727,125,643 shares of common stock held by TPG Partners VI, L.P., a Delaware limited partnership; (e) 2,874,357 shares of common stock held by TPG FOF VI SPV, L.P., a Delaware limited partnership; (f) 30,000,000 shares of common stock held by TPG Biotechnology Partners III, L.P., a Delaware limited partnership; and (g) 250,000,000 shares of common stock held by TPG Iceberg Co-Invest LLC, a Delaware limited liability company (together with TPG Partners V, L.P., TPG FOF V-A, L.P, TPG FOF V-B, L.P., TPG FOF VI SPV, L.P. and TPG Biotechnology Partners III, L.P., the “TPG Funds”). The general partner of each of TPG Partners V, L.P., TPG FOF V-A, L.P. and TPG FOF V-B, L.P. is TPG GenPar V, L.P., a Delaware limited partnership, whose general partner is TPG GenPar V Advisors, LLC, a Delaware limited liability company. The general partner of TPG Partners VI, L.P. is TPG GenPar VI, L.P., a Delaware limited partnership, whose general partner is TPG GenPar VI Advisors, LLC. The general partner of TPG Biotechnology Partners III, L.P. is TPG Biotechnology GenPar III, L.P., a Delaware limited partnership, whose general partner is TPG Biotechnology GenPar III Advisors, LLC, a Delaware limited liability company. The sole member of each |
148
Table of Contents
| of TPG GenPar V Advisors, LLC, TPG GenPar VI Advisors, LLC and TPG Biotechnology GenPar III Advisors, LLC is TPG Holdings I, L.P., a Delaware limited partnership, whose general partner is TPG Holdings I-A, LLC, a Delaware limited liability company, whose sole member is TPG Group Holdings (SBS), L.P., a Delaware limited partnership, whose general partner is TPG Group Holdings (SBS) Advisors, Inc., a Delaware corporation. The general partner of TPG FOF VI SPV, L.P. and the managing member of TPG Iceberg Co-Invest LLC is TPG Advisors VI, Inc., a Delaware corporation. David Bonderman and James G. Coulter are officers and sole stockholders of each of TPG Advisors VI, Inc. and TPG Group Holdings (SBS) Advisors, Inc. and may therefore be deemed to be the beneficial owners of the shares held by the TPG Funds. The address of each of TPG Advisors VI, Inc., TPG Group Holdings (SBS) Advisors, Inc. and Messrs. Bonderman and Coulter is c/o TPG Global, LLC, 301 Commerce Street, Suite 3300, Fort Worth, TX 76102. |
| (2) | CPPIB-PHI is a wholly owned subsidiary of the Canada Pension Plan Investment Board, which therefore beneficially owns the ordinary shares held by CPPIB-PHI. All shares of the Canada Pension Plan Investment Board were issued to Canada’s Federal Minister of Finance to be held on behalf of Her Majesty Queen Elizabeth II in right of Canada. Messrs. Mark Wiseman and John Butler as authorized officers of CPPIB-PHI have authority to vote or dispose of the shares of CPPIB-PHI. The address of each of CPPIB-PHI and Messrs. Wiseman and Butler is c/o Canada Pension Plan Investment Board, One Queen Street East, Suite 2500, P.O. Box 101, Toronto, Ontario M5C 2W5 Canada. |
| (3) | Voting and investment power with respect to the shares of our common stock held by Green Equity Investors V, L.P. and Green Equity Investors Side V, L.P. (collectively, the “Green Funds”) and LGP Iceberg Co-invest, LLC (“LGP Ice”) may be deemed to be shared by certain affiliated entities. GEI Capital V, LLC (“GEIC”), is the general partner of the Green Funds. Green V Holdings, LLC (“Holdings”) is a limited partner of the Green Funds. LGP is the management company of the Green Funds, the Manager of LGP Ice and an affiliate of GEIC and Holdings. LGP Management, Inc. (“LGPM”) is the general partner of LGP. Mr. Danhakl may also be deemed to share voting and investment power with respect to such shares due to his position with LGPM. Messrs. Danhakl, Peter J. Nolan, Jonathan D. Sokoloff, Jonathan A. Seiffer, John M. Baumer, Timothy J. Flynn, James D. Halper, Todd M. Purdy, Michael S. Solomon, and W. Christian McCollum either directly (whether through ownership interest or position) or indirectly through one or more intermediaries, may be deemed to control LGP. As such, Messrs. Danhakl, Nolan, Sokoloff, Seiffer, Baumer, Flynn, Halper, Purdy, Solomon and McCollum may be deemed to have shared voting and investment power with respect to all shares beneficially owned by LGP Ice. The address of each of the Green Funds, LGP Ice and each of the foregoing individuals is c/o Leonard Green & Partners, L.P., 11111 Santa Monica Boulevard, Suite 2000, Los Angeles, California 90025. |
| (4) | Includes 23,000,000 shares underlying stock options that are currently exercisable or vest within 60 days. |
| (5) | Includes 1,200,000 shares underlying stock options that are currently exercisable or vest within 60 days. |
| (6) | Includes 3,100,000 shares underlying stock options that are currently exercisable or vest within 60 days. |
| (7) | Includes 1,850,000 shares underlying stock options that are currently exercisable or vest within 60 days and 159,973 shares underlying vested stock appreciation rights and 280,274 notional shares held under the Defined Contribution Executive Retirement Plan. |
| (8) | Includes 1,500,000 shares underlying stock options that are currently exercisable or vest within 60 days. |
| (9) | Includes 300,000 shares underlying stock options that are currently exercisable or vest within 60 days. Sharad S. Mansukani, who is one of our directors, is a TPG Senior Advisor. Mr. Mansukani has no voting or investment power over and disclaims beneficial ownership of the shares held by the TPG Funds. The address of Mr. Mansukani is c/o TPG Global, LLC, 301 Commerce Street, Suite 3300, Fort Worth, TX 76102. |
| (10) | Nehal Raj, who is one of our directors, is a TPG Principal. Mr. Raj has no voting or investment power over and disclaims beneficial ownership of the shares held by the TPG Funds. The address of Mr. Raj is c/o TPG Global, LLC, 301 Commerce Street, Suite 3300, Fort Worth, TX 76102. |
| (11) | Jeffrey K. Rhodes, who is one of our directors, is a TPG Principal. Mr. Rhodes has no voting or investment power over and disclaims beneficial ownership of the shares held by the TPG Funds. The address of Mr. Rhodes is c/o TPG Global, LLC, 301 Commerce Street, Suite 3300, Fort Worth, TX 76102. |
| (12) | Includes 300,000 shares underlying stock options that are currently exercisable or vest within 60 days. |
| (13) | Todd B. Sisitsky, who is one of our directors, is a TPG Partner. Mr. Sisitsky has no voting or investment power over and disclaims beneficial ownership of the shares held by the TPG Funds. The address of Mr. Sisitsky is c/o TPG Global, LLC, 301 Commerce Street, Suite 3300, Fort Worth, TX 76102. |
| (14) | Bryan M. Taylor, who is one of our directors, is a TPG Partner. Mr. Taylor has no voting or investment power over and disclaims beneficial ownership of the shares held by the TPG Funds. The address of Mr. Taylor is c/o TPG Global, LLC, 301 Commerce Street, Suite 3300, Fort Worth, TX 76102. |
| (15) | Includes 36,750,000 shares underlying stock options that are currently exercisable or vest within 60 days and 815,086 shares underlying vested stock appreciation rights and 976,304 notional shares held under the Defined Contribution Executive Retirement Plan. |
149
Table of Contents
We summarize below the principal terms of the agreements that govern our existing indebtedness. We refer you to the exhibits to the registration statement of which this prospectus forms a part for copies of agreements governing the indebtedness described below.
Senior Secured Credit Facilities
Overview. On October 24, 2012, IMS Health, and certain of its foreign subsidiaries, as co-borrowers, entered into the Senior Secured Credit Facilities. On February 6, 2013, IMS Health entered into an amendment to the Senior Secured Credit Facilities to reduce the interest rates applicable to the term loans thereunder. The following is a summary of the terms of the Senior Secured Credit Facilities after giving effect to such subsequent repricing amendment.
As of December 31, 2013, the Senior Secured Credit Facilities provide for senior secured financing of up to approximately $3,137 million, consisting of:
| • | a $1,750 million term loan maturing in 2017; |
| • | a €748 million (or approximately $1,012 billion based on exchange rates in effect as of September 30, 2013) term loan maturing in 2017; and |
| • | a $375.0 million revolving credit facility maturing in 2017, of which (x) $175.0 million is available to us in U.S. dollars (and includes letter of credit and swingline loan sub-facilities), (y) $100.0 million is available to us and IMS Japan K.K. in U.S. dollars and Japanese yen and (z) $100.0 million is available to us and IMS AG in U.S. dollars, euros and Swiss francs. |
All borrowings under the Senior Secured Credit Facilities are subject to the satisfaction of customary conditions, including the accuracy of certain representations and warranties and the absence of a default.
The Senior Secured Credit Facilities provide that IMS Health has the right to request additional commitments (x) for new term loans and (y) to increase the size of the existing revolving credit facility, in an aggregate principal amount not in excess of the greater of (i) $300.0 million and (ii) the amount of new term loans and increased revolving credit commitments such that the senior secured net leverage ratio shall be no greater than 3.50 to 1.00 after giving pro forma effect to such increases (assuming such revolving credit commitments are fully borrowed). In addition, the Senior Secured Credit Facilities provide that we have the right to replace and extend existing commitments with new commitments from existing or new lenders. The lenders under the Senior Secured Credit Facilities are not under any obligation to provide any such additional commitments, and any increase in, or replacement or extension of, commitments is subject to several conditions precedent and limitations.
Interest rate and fees. Borrowings under the Senior Secured Credit Facilities, other than swingline loans and loans denominated in a currency other than U.S. dollars, bear interest at a rate per annum equal to, at our option, either (a) a base rate determined by reference to the highest of (1) the prime rate of Bank of America, N.A. and (2) the federal funds effective rate plus 0.50% and (3) the one-month LIBOR rate plus 1.00%; provided, that, with respect to term loans denominated in U.S. dollars, the base rate at any time shall not be less than 2.00% or (b) the higher of (1) a LIBOR rate adjusted for statutory reserve requirements for a one-, two-, three- or six-month interest period, or if available to all applicable lenders, one or two weeks (for
150
Table of Contents
loans denominated in U.S. dollars) or nine- or twelve-month interest period, and (2) (x) 1.00% for term loans denominated in U.S. dollars or (y) 1.25% for term loans denominated in a currency other than U.S. dollars, in each case, plus an applicable margin. Swingline loans bear interest at the interest rate applicable to base rate loans. Borrowings denominated in currencies other than U.S. dollars bear interest at the interest rate applicable to LIBOR rate loans.
The applicable margin for borrowings of revolving loans under the Senior Secured Credit Facilities is subject to adjustment each fiscal quarter based on our leverage ratio and ranges from (a) 1.75% to 2.25% per annum with respect to revolving loans that are base rate borrowings and (b) 2.75% to 3.25% per annum with respect to revolving loans that are LIBOR borrowings. The applicable margin for borrowings of term loans under the Senior Secured Credit Facilities is equal at all times to (1) for U.S. dollar term loans, (a) 1.75% for base rate loans and (b) 2.75% for adjusted LIBOR loans and (2) for Euro term loans, 3.00%.
On the last day of each calendar quarter IMS Health is required to pay a commitment fee in respect of any unused commitments under the revolving credit facility equal to 0.75% per annum. IMS Health is also required to pay customary letter of credit fees and certain other agency fees.
Prepayments. IMS Health is required to prepay outstanding term loans, subject to certain exceptions, with:
| • | 50% (with stepdowns to 25% and 0% based upon IMS Health’s leverage ratio) of IMS Health’s annual consolidated excess cash flow (as defined in the Senior Secured Credit Facilities agreement), subject to certain exceptions; |
| • | 100% of the net proceeds of certain asset sales and insurance/condemnation events, subject to reinvestment rights and certain other exceptions; and |
| • | 100% of the net proceeds of any incurrence of debt, excluding certain permitted debt issuances. |
In addition, commitment reductions of the revolving credit facility, and voluntary prepayments of the term loans and loans under the revolving credit facility are permitted, in whole or in part, in minimum amounts without premium or penalty, other than customary breakage costs with respect to adjusted LIBOR loans.
Amortization of principal. IMS Health is required to make scheduled quarterly payments on the term loans each equal to approximately 0.25% of the original principal amount of the term loans with the balance paid at maturity.
Guarantees and collateral. The obligations under the Senior Secured Credit Facilities are guaranteed by each of IMS Health’s current and future domestic wholly-owned restricted subsidiaries (excluding IMS Japan K.K.) and by Healthcare Technology Intermediate Holdings, Inc. and, subject to the next succeeding sentence, are secured by a perfected security interest in substantially all of our assets and assets of the guarantors of the Senior Secured Credit Facilities, in each case, now owned or later acquired, including a pledge of all of the capital stock of IMS Health, the capital stock of substantially all of IMS Health’s domestic restricted subsidiaries and 66% of the voting capital stock of IMS Health’s foreign restricted subsidiaries that are directly owned by IMS Health or a guarantor of the Senior Secured Credit Facilities. The obligations of IMS AG, the Swiss subsidiary borrower, are guaranteed by certain of its current and future wholly-owned restricted subsidiaries organized in Switzerland and are secured by a perfected
151
Table of Contents
security interest in certain of the assets of IMS AG and the Swiss guarantors, including a pledge of the capital stock of the Swiss guarantors. The obligations of IMS Japan K.K. are secured by a perfected security in certain of its assets.
Restrictive covenants and other matters. The Senior Secured Credit Facilities require IMS Health to comply with a quarterly maximum leverage ratio test, which financial covenant becomes more restrictive over time. In addition, the Senior Secured Credit Facilities agreement includes negative covenants that, subject to exceptions, limit the ability of IMS Health and its restricted subsidiaries, to, among other things:
| • | incur liens and engage in sale-leaseback transactions; |
| • | make investments and loans; |
| • | make capital expenditures; |
| • | incur indebtedness or guarantees; |
| • | engage in mergers, acquisitions and asset sales; |
| • | declare dividends, make payments or redeem or repurchase equity interests; |
| • | alter the business IMS Health and its restricted subsidiaries conduct; |
| • | enter into agreements limiting restricted subsidiary distributions; |
| • | prepay, redeem or purchase certain indebtedness; and |
| • | engage in certain transactions with affiliates. |
These negative covenants restrict IMS Health’s ability to pay dividends and make certain payments by imposing caps on the aggregate amount thereof as well as certain other conditions, including in some cases, financial incurrence tests, to declare dividends and distributions.
The Senior Secured Credit Facilities contain certain customary representations and warranties, affirmative covenants and events of default. If any such event of default occurs, the lenders under the Senior Secured Credit Facilities will be entitled to take various actions, including the acceleration of amounts due under the Senior Secured Credit Facilities and all actions permitted to be taken by a secured creditor.
Old 12.5% Senior Notes
Overview
On February 26, 2010, IMS Health entered into an indenture under which it issued an aggregate principal amount of $1.0 billion of senior unsecured notes due 2018, which we refer to as the “Old 12.5% Senior Notes.” On March 16, 2011, IMS Health entered into a Supplemental Indenture to amend certain covenants in the Old 12.5% Senior Notes indenture. On October 24, 2012, we completed an exchange offer and consent solicitation (the “Exchange Offer”) to exchange the Old 12.5% Senior Notes for new 12.5% Senior Unsecured Notes due 2018, which we refer to as the “12.5% Senior Notes,” and to solicit consents to amend certain covenants to the Old 12.5% Senior Notes in connection with the second amendment and restatement of the Senior Secured Credit Facilities and the issuance of IMS Health’s 6% Senior Notes. The Old 12.5% Senior Notes bear interest in cash at the rate of 12.5% per annum. Interest on the Old 12.5% Senior Notes is payable quarterly on March 1, June 1, September 1 and December 1 of each year. As of September 30, 2013, the outstanding aggregate principal amount of the Old 12.5% Senior Notes was $0.4 million. The following is a summary of the terms of the Old 12.5% Senior Notes following the Exchange Offer.
152
Table of Contents
Optional redemption
On and after March 1, 2014, IMS Health may redeem the Old 12.5% Senior Notes, in whole or in part, at a price equal to 100% of the principal amount thereof, plus an applicable premium declining ratably to par, plus accrued and unpaid interest and special interest, if any.
Prior to March 1, 2014, IMS Health may redeem the Old 12.5% Senior Notes, in whole or in part, at a price equal to 100% of the principal amount thereof, plus a “make-whole” premium, plus accrued and unpaid interest and special interest, if any.
Change of control offer
If a change of control occurs, IMS Health must give holders of the Old 12.5% Senior Notes an opportunity to sell their notes to IMS Health at a purchase price equal to 101% of the principal amount thereof, plus accrued and unpaid interest and special interest, if any.
Mandatory offer to purchase following certain asset sales
If IMS Health or its restricted subsidiaries engage in certain asset sales, IMS Health generally must either invest the net proceeds from such sales in its business within a period of time, prepay certain debt or make an offer to purchase a principal amount of the outstanding Old 12.5% Senior Notes equal to the excess net proceeds, subject to certain exceptions. The purchase price of the Old 12.5% Senior Notes in any asset sale offer would be 100% of their principal amount, plus accrued and unpaid interest and special interest, if any.
Guarantees
IMS Health’s obligations under the Old 12.5% Senior Notes are guaranteed by Healthcare Technology Intermediate Holdings, Inc. and all of IMS Health’s existing and subsequently acquired or organized restricted subsidiaries that guarantee the Senior Secured Credit Facilities or other indebtedness of IMS Health or any guarantor of the Old 12.5% Senior Notes.
Certain covenants and events of default
The indenture governing the Old 12.5% Senior Notes contains a number of covenants that, among other things and, subject to certain exceptions, restrict the ability of IMS Health and its restricted subsidiaries to:
| • | incur additional debt and issue certain capital stock; |
| • | pay dividends on, redeem or repurchase capital stock; |
| • | prepay subordinated debt; |
| • | make certain investments, loans, advances and acquisitions; |
| • | enter into certain types of transactions with affiliates; |
| • | incur certain liens; |
| • | consolidate, merge or transfer all or substantially all of IMS Health’s assets and the assets of IMS Health’s restricted subsidiaries; and |
| • | enter into agreements restricting IMS Health’s restricted subsidiaries’ ability to pay dividends. |
153
Table of Contents
The indenture governing the Old 12.5% Senior Notes also contains certain customary affirmative covenants and events of default.
New 12.5% Senior Notes
Overview
In connection with the Exchange Offer, on October 24, 2012 IMS Health entered into an indenture under which it issued an aggregate principal amount of $999.6 million of 12.5% Senior Notes, which we refer to as the “New 12.5% Senior Notes.” The New 12.5% Senior Notes bear interest in cash at the rate of 12.5% per annum. Interest on the New 12.5% Senior Notes is payable quarterly on March 1, June 1, September 1 and December 1 of each year. The following is a description of the New 12.5% Senior Notes.
Optional redemption
On and after March 1, 2015, IMS Health may redeem the New 12.5% Senior Notes, in whole or in part, at a price equal to 100% of the principal amount thereof, plus an applicable premium declining ratably to par, plus accrued and unpaid interest and special interest, if any.
Prior to March 1, 2015, IMS Health may redeem the New 12.5% Senior Notes, in whole or in part, at a price equal to 100% of the principal amount thereof, plus a “make-whole” premium, plus accrued and unpaid interest and special interest, if any.
Additionally, at any time prior to March 1, 2015, IMS Health may redeem, subject to certain conditions and limitations, up to 65% of our New 12.5% Senior Notes at a redemption price equal to the sum of (a) 112.50% of the aggregate principal amount thereof, plus (b) accrued and unpaid interest and special interest, if any, to the redemption date, with the net cash proceeds raised in one or more public equity offerings of any of its direct or indirect parent companies and contributed to IMS Health.
Change of control offer
If a change of control occurs, IMS Health must give holders of the New 12.5% Senior Notes an opportunity to sell their notes to IMS Health at a purchase price equal to 101% of the principal amount thereof, plus accrued and unpaid interest and special interest, if any.
Mandatory offer to purchase following certain asset sales
If IMS Health or its restricted subsidiaries engage in certain asset sales, IMS Health generally must invest the net proceeds from such sales in our business within a period of time, prepay certain debt or make an offer to purchase a principal amount of the outstanding New 12.5% Senior Notes equal to the excess net proceeds, subject to certain exceptions. The purchase price of the New 12.5% Senior Notes in any asset sale offer would be 100% of their principal amount, plus accrued and unpaid interest and special interest, if any.
Guarantees
IMS Health’s obligations under the New 12.5% Senior Notes are guaranteed by Healthcare Technology Intermediate Holdings, Inc. and all of IMS Health’s existing and subsequently acquired or organized restricted subsidiaries that guarantee the Senior Secured Credit Facilities or other indebtedness of the IMS Health or any guarantor of the New 12.5% Senior Notes.
154
Table of Contents
Certain covenants and events of default
The indenture governing the New 12.5% Senior Notes contains a number of covenants that, among other things and subject to certain exceptions, restrict the ability of IMS Health and its restricted subsidiaries to:
| • | incur additional debt and issue certain capital stock; |
| • | pay dividends on, redeem or repurchase capital stock; |
| • | prepay subordinated debt; |
| • | make certain investments, loans, advances and acquisitions; |
| • | enter into certain types of transactions with affiliates; |
| • | incur certain liens; |
| • | consolidate, merge or transfer all or substantially all of IMS Health’s assets and the assets of IMS Health’s restricted subsidiaries; and |
| • | enter into agreements restricting IMS Health’s restricted subsidiaries’ ability to pay dividends. |
The indenture governing our New 12.5% Senior Notes also contains certain customary affirmative covenants and events of default.
6% Senior Notes
Overview
On October 24, 2012 IMS Health entered into an indenture under which IMS Health issued an aggregate principal amount of $500.0 million of 6% Senior Notes. The 6% Senior Notes bear interest in cash at the rate of 6.0% per annum. Interest on the 6% Senior Notes is payable semi-annually on May 1 and November 1 of each year.
Optional redemption
On and after November 1, 2015, IMS Health may redeem the 6% Senior Notes, in whole or in part, at a price equal to 100% of the principal amount thereof, plus an applicable premium declining ratably to par, plus accrued and unpaid interest if any.
Prior to November 1, 2015, IMS Health may redeem the 6% Senior Notes, in whole or in part, at a price equal to 100% of the principal amount thereof, plus a “make-whole” premium, plus accrued and unpaid interest, if any.
Additionally, at any time prior to November 1, 2015, IMS Health may redeem, subject to certain conditions and limitations, up to 40% of our 6% Senior Notes at a redemption price equal to the sum of (a) 106.000% of the aggregate principal amount thereof, plus (b) accrued and unpaid interest, if any, to the redemption date, subject to certain exceptions, with net cash proceeds raised in one or more equity offerings or a contribution to IMS Health’s common equity capital made with the net cash proceeds of a concurrent equity offering.
155
Table of Contents
Change of control offer
If a change of control occurs, IMS Health must give holders of the 6% Senior Notes an opportunity to sell their notes to IMS Health at a purchase price equal to 101% of the principal amount thereof, plus accrued and unpaid interest, if any.
Mandatory offer to purchase following certain asset sales
If IMS Health or its restricted subsidiaries engage in certain asset sales, IMS Health generally must invest the net proceeds from such sales in our business within a period of time, prepay certain debt or make an offer to purchase a principal amount of the outstanding 6% Senior Notes equal to the excess net proceeds, subject to certain exceptions. The purchase price of the 6% Senior Notes in any asset sale offer would be 100% of their principal amount, plus accrued and unpaid interest, if any.
Guarantees
IMS Health’s obligations under the 6% Senior Notes are guaranteed by all of IMS Health’s material existing and subsequently acquired or organized wholly-owned domestic restricted subsidiaries and, subject to certain exceptions, each of IMS Health’s existing and subsequently acquired or organized domestic restricted subsidiaries that guarantee the Senior Secured Credit Facilities or other indebtedness of IMS Health or any guarantor of the 6% Senior Notes.
Certain covenants and events of default
The indenture governing the 6% Senior Notes contains a number of covenants that, among other things and subject to certain exceptions, restricts the ability of IMS Health and its restricted subsidiaries to:
| • | incur additional debt and issue certain capital stock; |
| • | pay dividends on, redeem or repurchase capital stock; |
| • | prepay subordinated debt; |
| • | make certain investments, loans, advances and acquisitions; |
| • | enter into certain types of transactions with affiliates; |
| • | incur certain liens; |
| • | consolidate, merge or transfer all or substantially all of IMS Health’s assets and the assets of IMS Health’s restricted subsidiaries; and |
| • | enter into agreements restricting IMS Health’s restricted subsidiaries’ ability to pay dividends. |
These negative covenants restrict IMS Health’s ability to pay dividends and make certain payments by imposing caps on the aggregate amount thereof as well as certain other conditions, including in some cases, financial incurrence tests, to declare dividends and distributions.
The indenture governing our 6% Senior Notes also contains certain customary affirmative covenants and events of default.
156
Table of Contents
Senior PIK Notes
Overview
On August 6, 2013, Healthcare Technology Intermediate, Inc., a Delaware corporation and an indirect parent company of IMS Health, entered into an indenture under which Healthcare Technology issued an aggregate principal amount of $750.0 million of Senior PIK Notes. The Senior PIK Notes due 2018 bear interest that (i) may be paid in cash at the rate of 7.375% per annum or (ii) subject to certain requirements, may be “paid in kind” with additional indebtedness at the rate of 8.125% per annum. The amount of interest payable in kind on any interest payment date is determined by reference to a scale based on (i) IMS Health’s and its affiliates’ contractual ability to dividend or distribute funds to Healthcare Technology and (ii) Healthcare Technology’s cash and cash equivalents on hand (subject, in each case, to certain adjustments). Interest on the Senior PIK Notes is payable semi-annually on March 1 and September 1 of each year, beginning March 1, 2014.
Optional redemption
On and after September 1, 2014, Healthcare Technology may redeem the Senior PIK Notes, in whole or in part, at a price equal to 100% of the principal amount thereof, plus an applicable premium declining ratably to par, plus accrued and unpaid interest, if any.
Prior to September 1, 2014, Healthcare Technology may redeem the Senior PIK Notes, in whole or in part, at a price equal to 100% of the principal amount thereof, plus a “make-whole” premium, plus accrued and unpaid interest, if any.
Additionally, at any time prior to September 1, 2015, Healthcare Technology may redeem, subject to certain conditions and limitations, up to 100% of the Senior PIK Notes at a redemption price equal to the sum of (a) (i) prior to September 1, 2014, 102.0% of the aggregate principal amount thereof and (ii) from September 1, 2014 to September 1, 2015, 101.0% of the aggregate principal amount thereof, plus (b) accrued and unpaid interest, if any, to the redemption date, so long as such redemption occurs within 180 days of the closing date of an equity offering (subject to certain exceptions) and that an amount equal to at least the applicable equity offering redemption amount is received or contributed to the capital of Healthcare Technology or any of its restricted subsidiaries.
Change of control offer
If a change of control occurs, Healthcare Technology must give holders of the Senior PIK Notes an opportunity to sell their notes to Healthcare Technology at a purchase price equal to 101% of the principal amount thereof, plus accrued and unpaid interest, if any. Subject to exceptions, if holders of not less than 90% of the aggregate principal amount of Senior PIK Notes outstanding tender and sell such notes in a change of control offer, Healthcare Technology has the right to purchase all remaining Senior PIK Notes at a purchase price equal to 101% of the principal amount thereof, plus accrued and unpaid interest, if any.
Mandatory offer to purchase following certain asset sales
If Healthcare Technology or its restricted subsidiaries (including IMS Health and its restricted subsidiaries) engage in certain asset sales, the applicable entity generally must invest the net
157
Table of Contents
proceeds from such sales in our business within a period of time or prepay certain debt or Healthcare Technology must make an offer to purchase a principal amount of the outstanding Senior PIK Notes equal to the excess net proceeds from the applicable sales. Healthcare Technology’s responsibility to make such asset sale offers is subject to certain exceptions, including the ability of Healthcare Technology’s subsidiaries and affiliates to dividend or distribute the excess proceeds of such asset sales to Healthcare Technology under the terms of such subsidiaries’ indebtedness. The purchase price of the Senior PIK Notes in any asset sale offer would be 100% of their principal amount, plus accrued and unpaid interest, if any.
Guarantees
Healthcare Technology’s obligations under the Senior PIK Notes are not guaranteed by IMS Health or any of its subsidiaries. Subject to certain exceptions, subsidiaries of Healthcare Technology that guarantee the payment of other indebtedness of Healthcare Technology must thereafter guarantee the Senior PIK Notes.
Certain covenants and events of default
The indenture governing the Senior PIK Notes contains a number of covenants that, among other things and subject to certain exceptions, restricts the ability of Healthcare Technology and its restricted subsidiaries to:
| • | incur additional debt and issue certain capital stock; |
| • | pay dividends on, redeem or repurchase capital stock; |
| • | prepay subordinated debt; |
| • | make certain investments, loans, advances and acquisitions; |
| • | enter into certain types of transactions with affiliates; |
| • | incur certain liens; |
| • | consolidate, merge or transfer all or substantially all of Healthcare Technology’s assets and the assets of Healthcare Technology’s restricted subsidiaries; and |
| • | enter into agreements restricting Healthcare Technology’s restricted subsidiaries’ ability to pay dividends. |
The indenture governing the Senior PIK Notes also contains certain customary affirmative covenants and events of default.
158
Table of Contents
General
Upon completion of this offering, our authorized capital stock will consist of shares of common stock, par value $0.001 per share, and shares of preferred stock, par value $0.001 per share. As of December 31, 2013, we had 2,800,047,284 shares of common stock outstanding held by 105 shareholders of record and no shares of preferred stock outstanding. After consummation of this offering and the use of proceeds therefrom, we expect to have shares of our common stock outstanding and shares of our preferred stock outstanding. The following description of our capital stock is intended as a summary only and is qualified in its entirety by reference to our certificate of incorporation and bylaws to be in effect at the closing of this offering, which are filed as exhibits to the registration statement of which this prospectus forms a part, and to the applicable provisions of the DGCL.
Common stock
Dividend rights. Subject to preferences that may apply to shares of preferred stock outstanding at the time, holders of outstanding shares of common stock will be entitled to receive dividends out of assets legally available at the times and in the amounts as the board of directors may determine from time to time. See “Dividend policy.”
Voting rights. Each outstanding share of common stock will be entitled to one vote on all matters submitted to a vote of stockholders. Holders of shares of our common stock will have no cumulative voting rights.
Preemptive rights. Our common stock will not be entitled to preemptive or other similar subscription rights to purchase any of our securities.
Conversion or redemption rights. Our common stock will be neither convertible nor redeemable.
Liquidation rights. Upon our liquidation, the holders of our common stock will be entitled to receive pro rata our assets that are legally available for distribution, after payment of all debts and other liabilities and subject to the prior rights of any holders of preferred stock then outstanding.
Preferred stock
Our board of directors may, without further action by our stockholders, from time to time, direct the issuance of shares of preferred stock in series and may, at the time of issuance, determine the designations, powers, preferences, privileges and relative participating, optional or special rights, as well as the qualifications, limitations or restrictions thereof, including dividend rights, conversion rights, voting rights, terms of redemption and liquidation preferences, any or all of which may be greater than the rights of the common stock. Satisfaction of any dividend preferences of outstanding shares of preferred stock would reduce the amount of funds available for the payment of dividends on shares of our common stock. Holders of shares of preferred stock may be entitled to receive a preference payment in the event of our liquidation before any payment is made to the holders of shares of our common stock. Under certain circumstances, the issuance of shares of preferred stock may render more difficult or tend to discourage a merger, tender offer or proxy contest, the assumption of control by a holder of a large block of our securities or the removal of incumbent management. Upon the affirmative vote of a majority of the total number of directors then in office, our board of directors, without stockholder
159
Table of Contents
approval, may issue shares of preferred stock with voting and conversion rights which could adversely affect the holders of shares of our common stock and the market value of our common stock. Upon consummation of this offering, there will be no shares of preferred stock outstanding, and we have no present intention to issue any shares of preferred stock.
Anti-takeover effects of our certificate of incorporation and our bylaws
Our certificate of incorporation and our bylaws contain provisions that may delay, defer or discourage another party from acquiring control of us. We expect that these provisions will discourage coercive takeover practices or inadequate takeover bids. These provisions are also designed to encourage persons seeking to acquire control of us to first negotiate with the board of directors, which we believe may result in an improvement of the terms of any such acquisition in favor of our stockholders. However, they may also discourage acquisitions that some stockholders may favor.
These provisions include:
| • | Classified board. Our certificate of incorporation provides that our board of directors will be divided into three classes of directors. As a result, approximately one-third of our board of directors will be elected each year. The classification of directors will have the effect of making it more difficult for stockholders to change the composition of our board. The board of directors will initially be composed of 10 members, but will be expanded to add additional independent directors to comply with audit committee phase-in rules. The size of our board of directors will be increased to the extent necessary to comply with applicable law and NYSE rules at such time as we no longer satisfy the “controlled company” exemption. |
| • | Requirements for removal of directors. Until the Trigger Date (as defined above), any director of the Company may be removed with or without cause by holders of a majority of our outstanding shares of common stock. Following the Trigger Date, directors may only be removed for cause by the affirmative vote of the holders of at least 75% of the voting power of our outstanding shares of capital stock. |
| • | Advance notice procedures. Our bylaws establish an advance notice procedure for stockholder proposals to be brought before an annual meeting of our stockholders, including proposed nominations of persons for election to the board of directors. Stockholders at an annual meeting will only be able to consider proposals or nominations specified in the notice of meeting or brought before the meeting by or at the direction of the board of directors or by a stockholder who was a stockholder of record on the record date for the meeting, who is entitled to vote at the meeting and who has given our secretary timely written notice, in proper form, of the stockholder’s intention to bring that business before the meeting. Although the bylaws do not give the board of directors the power to approve or disapprove stockholder nominations of candidates or proposals regarding other business to be conducted at a special or annual meeting, the bylaws may have the effect of precluding the conduct of certain business at a meeting if the proper procedures are not followed or may discourage or deter a potential acquiror from conducting a solicitation of proxies to elect its own slate of directors or otherwise attempting to obtain control of our company. |
| • | Actions by written consent; special meetings of stockholders. Our certificate of incorporation provides that, following the Trigger Date, stockholder action can be taken only at an annual or special meeting of stockholders and cannot be taken by written consent in lieu of a meeting. Our certificate of incorporation also provides that, except as otherwise require by law, special |
160
Table of Contents
| meetings of the stockholders can only be called by the chairman or vice-chairman of the board, the chief executive officer, a majority of the board of directors, or, until the Trigger Date, a majority of shareholders. |
| • | Supermajority approval requirements. The DGCL generally provides that the affirmative vote of a majority of the shares entitled to vote on any matter is required to amend a corporation’s certificate of incorporation or bylaws, unless either the corporation’s certificate of incorporation or bylaws provide otherwise. Until the Trigger Date, any amendment to our certificate of incorporation or shareholder amendment to our bylaws will require majority shareholder approval, provided that such majority must include at least 65% of the shares then held by the Sponsors. Following the Trigger Date, certain amendments to our certificate of incorporation and shareholder amendments to our bylaws will require a 75% shareholder vote. |
| • | Authorized but unissued shares. Our authorized but unissued shares of preferred stock will be available for future issuance without stockholder approval. The existence of authorized but unissued shares of preferred stock could render more difficult or discourage an attempt to obtain control of a majority of our common stock by means of a proxy contest, tender offer, merger or otherwise. |
| • | Business combinations with interested stockholders. We have elected in our certificate of incorporation not to be subject to Section 203 of the DGCL, an antitakeover law. In general, Section 203 prohibits a publicly held Delaware corporation from engaging in a business combination, such as a merger, with a person or group owning 15% or more of the corporation’s voting stock for a period of three years following the date the person became an interested stockholder, unless (with certain exceptions) the business combination or the transaction in which the person became an interested stockholder is approved in a prescribed manner. Accordingly, we will not be subject to any anti-takeover effects of Section 203. Nevertheless, our certificate of incorporation contains provisions that have the same effect as Section 203, except that they provide that the Sponsors and their transferees will not be deemed to be “interested stockholders,” regardless of the percentage of our voting stock owned by them, and accordingly will not be subject to such restrictions. |
Exclusive jurisdiction of certain actions
Our certificate of incorporation requires, to the fullest extent permitted by law, that derivative actions brought in the name of the Company, actions against directors, officers and employees for breach of fiduciary duty and other similar actions, may be brought only in the Court of Chancery in the State of Delaware. Although we believe this provision benefits us by providing increased consistency in the application of Delaware law in the types of lawsuits to which it applies, the provision may have the effect of discouraging lawsuits against our directors and officers.
Corporate opportunities
Our certificate of incorporation provides that we renounce any interest or expectancy in the business opportunities of the Sponsors and of their officers, directors, agents, stockholders, members, partners, affiliates and subsidiaries and each such party shall not have any obligation to offer us those opportunities unless presented to one of our directors or officers in his or her capacity as a director or officer.
161
Table of Contents
Limitations on liability and indemnification of directors and officers
Our certificate of incorporation limits the liability of our directors to the fullest extent permitted by the DGCL and requires us to provide them with customary indemnification. We expect to enter into customary indemnification agreements with each of our executive officers and directors that provide them, in general, with customary indemnification in connection with their service to us or on our behalf. We also maintain officers’ and directors’ liability insurance that insures against liabilities that our officers and directors may incur in such capacities.
Transfer agent and registrar
The transfer agent and registrar for our common stock is American Stock Transfer & Trust Company, LLC.
Listing
We have applied to list our common stock on the NYSE under the symbol “IMS.”
162
Table of Contents
Shares eligible for future sale
Before this offering, there has been no public market for our common stock. As described below, only a limited number of shares currently outstanding will be available for sale immediately after this offering due to contractual and legal restrictions on resale. Nevertheless, future sales of substantial amounts of our common stock, including shares issued upon the exercise of outstanding options or warrants, in the public market after this offering, or the perception that those sales may occur, could cause the prevailing market price for our common stock to fall or impair our ability to raise capital through sales of our equity securities.
Upon the closing of this offering, we will have outstanding shares of our common stock, after giving effect to the issuance of shares of our common stock in this offering, assuming no exercise by the underwriters of their option to purchase additional shares and no exercise of options outstanding as of , 2014.
Of the shares that will be outstanding immediately after the closing of this offering, we expect that the shares to be sold in this offering will be freely tradable without restriction under the Securities Act unless purchased by our “affiliates,” as that term is defined in Rule 144 under the Securities Act. Shares purchased by our affiliates may not be resold except pursuant to an effective registration statement or an exemption from registration, including the safe harbor under Rule 144 of the Securities Act described below. In addition, following this offering, shares of common stock issuable pursuant to awards granted under certain of our equity plans that are covered by a registration statement on Form S-8 will be freely tradable in the public market, subject to certain contractual and legal restrictions described below.
The remaining shares of our common stock outstanding after this offering will be “restricted securities,” as that term is defined in Rule 144 of the Securities Act, and we expect that substantially all of these restricted securities will be subject to the lock-up agreements described below. These restricted securities may be sold in the public market only if the sale is registered or pursuant to an exemption from registration, such as the safe harbor provided by Rule 144.
Lock-up agreements
We, the selling stockholders, and each of our directors and executive officers and certain other stockholders, who collectively own shares of our common stock following this offering, have agreed that, without the prior written consent of certain of the underwriters, we and they will not, subject to limited exceptions, directly or indirectly sell or dispose of any shares of common stock or any securities convertible into or exchangeable or exercisable for shares of common stock for a period of 180 days after the date of this prospectus, unless extended pursuant to its terms. The lock-up restrictions and specified exceptions are described in more detail under “Underwriting.”
Rule 144
In general, under Rule 144, beginning 90 days after the date of this prospectus, any person who is not our affiliate and has held their shares for at least six months, including the holding period of any prior owner other than one of our affiliates, may sell shares without restriction, subject to the availability of current public information about us. In addition, under Rule 144, any person
163
Table of Contents
who is not our affiliate and has not been our affiliate at any time during the preceding three months and has held their shares for at least one year, including the holding period of any prior owner other than one of our affiliates, would be entitled to sell an unlimited number of shares immediately upon the closing of this offering without regard to whether current public information about us is available.
Beginning 90 days after the date of this prospectus, a person who is our affiliate or who was our affiliate at any time during the preceding three months and who has beneficially owned restricted securities for at least six months, including the holding period of any prior owner other than one of our affiliates, is entitled to sell a number of shares within any three-month period that does not exceed the greater of: (i) 1% of the number of shares of our common stock outstanding, which will equal approximately shares immediately after this offering; and (ii) the average weekly trading volume of our common stock on the NYSE during the four calendar weeks preceding the filing of a notice on Form 144 with respect to the sale.
Sales under Rule 144 by our affiliates are also subject to certain manner of sale provisions, notice requirements and the availability of current public information about us.
Rule 701
In general, under Rule 701 under the Securities Act, beginning 90 days after we become subject to the public company reporting requirements of the Exchange Act, any of our employees, directors, officers, consultants or advisors who acquired ordinary shares from us in connection with a written compensatory stock or option plan or other written agreement in compliance with Rule 701 is entitled to sell such shares in reliance on Rule 144 but without compliance with certain of the requirements contained in Rule 144. Accordingly, subject to any applicable lock-up agreements, beginning 90 days after we become subject to the public company reporting requirements of the Exchange Act, under Rule 701 persons who are not our affiliates may resell those shares without complying with the minimum holding period or public information requirements of Rule 144, and persons who are our affiliates may resell those shares without compliance with Rule 144’s minimum holding period requirements.
Equity incentive plans
Following this offering, we intend to file with the SEC a registration statement on Form S-8 under the Securities Act covering the shares of common stock that are subject to outstanding options and other awards issuable pursuant to our equity incentive plans. Shares covered by such registration statement will be available for sale in the open market following its effective date, subject to certain Rule 144 limitations applicable to affiliates and the terms of lock-up agreements applicable to those shares.
Registration rights
Subject to the lock-up agreements described above, certain holders of our common stock may demand that we register the sale of their shares under the Securities Act or, if we file another registration statement under the Securities Act other than a Form S-8 covering securities issuable under our equity plans or on Form S-4, may elect to include their shares of common stock in such registration. See “Certain relationships and related party transactions—Stockholders’ agreement” and “—Management stockholders and registration rights agreement.” Following such registered sales, the shares will be freely tradable without restriction under the Securities Act, unless held by our affiliates.
164
Table of Contents
Material United States federal income tax considerations for Non-U.S. Holders
The following is a summary of material U.S. federal income and estate tax considerations relating to the purchase, ownership and disposition of shares of our common stock issued pursuant to this offering by Non-U.S. Holders (defined below). This summary does not purport to be a complete analysis of all the potential tax considerations relevant to Non-U.S. Holders of shares of our common stock. This summary is based upon the Internal Revenue Code of 1986, as amended (the “Internal Revenue Code”), the Treasury regulations promulgated or proposed thereunder and administrative and judicial interpretations thereof, all as of the date hereof and all of which are subject to change or differing interpretations at any time, possibly with retroactive effect.
This summary assumes that shares of our common stock are held by a Non-U.S. Holder as “capital assets” within the meaning of Section 1221 of the Internal Revenue Code. This summary does not purport to deal with all aspects of U.S. federal income and estate taxation that might be relevant to particular Non-U.S. Holders in light of their particular investment circumstances or status, nor does it address specific tax considerations that may be relevant to particular persons who are subject to special treatment under U.S. federal income tax laws (including, for example, financial institutions, broker-dealers, insurance companies, partnerships or other pass-through entities, certain U.S. expatriates or former long-term residents of the United States, tax-exempt organizations, pension plans, “controlled foreign corporations,” “passive foreign investment companies,” corporations that accumulate earnings to avoid U.S. federal income tax, persons in special situations, such as those who have elected to mark securities to market or those who hold shares of our common stock as part of a straddle, hedge, conversion transaction, synthetic security or other integrated investment, persons that have a “functional currency” other than the U.S. dollar, or holders subject to the alternative minimum or the 3.8% Medicare tax on net investment income). In addition, except as explicitly addressed herein with respect to estate tax, this summary does not address certain estate and any gift tax considerations or considerations arising under the tax laws of any state, local or non-U.S. jurisdiction.
For purposes of this summary, a “Non-U.S. Holder” means a beneficial owner of shares of our common stock that for U.S. federal income tax purposes, is an individual, corporation, estate or trust other than:
| • | an individual who is a citizen or resident of the United States; |
| • | a corporation, or any other organization taxable as a corporation for U.S. federal income tax purposes, that is created or organized in or under the laws of the United States, any state thereof or the District of Columbia; |
| • | an estate, the income of which is included in gross income for U.S. federal income tax purposes regardless of its source; or |
| • | a trust if (1) a U.S. court is able to exercise primary supervision over the trust’s administration and one or more United States persons (as define in the Internal Revenue Code) have the authority to control all of the trust’s substantial decisions or (2) the trust has a valid election in effect under applicable U.S. Treasury regulations to be treated as a United States person. |
A modified definition of Non-U.S. Holder applies for U.S. federal estate tax purposes (as discussed below).
165
Table of Contents
If an entity that is classified as a partnership for U.S. federal income tax purposes holds shares of our common stock, the tax treatment of persons treated as its partners for U.S. federal income tax purposes will generally depend upon the status of the partner and the activities of the partnership. Partnerships and other entities that are classified as partnerships for U.S. federal income tax purposes and persons holding our common stock through a partnership or other entity classified as a partnership for U.S. federal income tax purposes are urged to consult their own tax advisors.
There can be no assurance that the Internal Revenue Service (“IRS”) will not challenge one or more of the tax consequences described herein, and we have not obtained, nor do we intend to obtain, a ruling from the IRS or an opinion of counsel with respect to the U.S. federal income or estate tax consequences to a Non-U.S. Holder of the purchase, ownership or disposition of shares of our common stock.
THIS SUMMARY IS FOR GENERAL INFORMATION ONLY AND IS NOT INTENDED TO BE TAX ADVICE. PROSPECTIVE INVESTORS ARE URGED TO CONSULT THEIR OWN TAX ADVISORS CONCERNING THE U.S. FEDERAL INCOME AND ESTATE TAXATION, STATE, LOCAL AND NON-U.S. TAXATION AND OTHER TAX CONSEQUENCES TO THEM OF THE PURCHASE, OWNERSHIP AND DISPOSITION OF SHARES OF OUR COMMON STOCK, AS WELL AS THE APPLICATION OF STATE, LOCAL AND NON-U.S. INCOME AND OTHER TAX LAWS.
Distributions on shares of our common stock
As discussed under “Dividend policy” above, we do not currently anticipate paying cash dividends on shares of our common stock in the foreseeable future. In the event that we do make a distribution of cash or property with respect to shares of our common stock, any such distributions generally will constitute dividends for U.S. federal income tax purposes to the extent of our current or accumulated earnings and profits as determined under U.S. federal income tax principles, and will be subject to withholding as described in the next paragraph below. If a distribution exceeds our current or accumulated earnings and profits, the excess will be treated as a tax-free return of the Non-U.S. Holder’s investment, up to such holder’s adjusted tax basis in its shares of our common stock. Any remaining excess will be treated as capital gain, subject to the tax treatment described below in “—Gain on sale, exchange or other taxable disposition of our common stock.” Any distribution described in this paragraph would also be subject to the discussion below in “—Additional withholding and information reporting requirements for shares of our common stock held by or through non-U.S. entities.”
Any dividends paid to a Non-U.S. Holder with respect to shares of our common stock generally will be subject to a 30% U.S. federal withholding tax unless such Non-U.S. Holder provides us or our agent, as the case may be, with an appropriate IRS Form W-8, such as:
| • | IRS Form W-8BEN (or successor form) certifying, under penalties of perjury, that such Non-U.S. Holder is entitled to a reduction in withholding under an applicable income tax treaty; or |
| • | IRS Form W-8ECI (or successor form) certifying, under penalties of perjury, that a dividend paid on shares of our common stock is not subject to withholding tax because it is effectively connected with conduct of a trade or business in the United States of the Non-U.S. Holder (in which case such dividend generally will be subject to regular graduated U.S. federal income tax rates on a net income basis as described below). |
The certifications described above must be provided to us or our agent prior to the payment of dividends and must be updated periodically. The certification also may require a Non-U.S. Holder
166
Table of Contents
that provides an IRS form or that claims treaty benefits to provide its U.S. taxpayer identification number. Special certification and other requirements apply in the case of certain Non-U.S. Holders that are intermediaries or pass-through entities for U.S. federal income tax purposes.
Each Non-U.S. Holder is urged to consult its own tax advisor about the specific methods for satisfying these requirements. A claim for exemption will not be valid if the person receiving the applicable form has actual knowledge or reason to know that the statements on the form are false.
If dividends are effectively connected with the conduct of a trade or business in the United States of the Non-U.S. Holder (and, if required by an applicable income tax treaty, are attributable to a permanent establishment or fixed base maintained by such Non-U.S. Holder in the United States), the Non-U.S. Holder, although exempt from the withholding tax described above (provided that the certifications described above are satisfied), will generally be subject to U.S. federal income tax on such dividends on a net income basis in the same manner as if it were a resident of the United States. In addition, if such Non-U.S. Holder is taxable as a corporation for U.S. federal income tax purposes, such Non-U.S. Holder may be subject to an additional “branch profits tax” equal to 30% of its effectively connected earnings and profits for the taxable year, unless an applicable income tax treaty provides otherwise.
If a Non-U.S. Holder is eligible for a reduced rate of U.S. federal withholding tax pursuant to an applicable income tax treaty, such Holder may obtain a refund or credit of any excess amount withheld by timely filing an appropriate claim for refund with the IRS.
Gain on sale, exchange or other taxable disposition of shares of our common stock
Subject to the discussion below under “—Additional withholding and information reporting requirements for shares of our common stock held by or through non-U.S. entities,” in general, a Non-U.S. Holder will not be subject to U.S. federal income tax or withholding tax on any gain realized upon such holder’s sale, exchange or other disposition of shares of our common stock unless (i) such Non-U.S. Holder is an individual who is present in the United States for 183 days or more in the taxable year of disposition, and certain other conditions are met, (ii) we are or have been a “United States real property holding corporation,” as defined in the Internal Revenue Code (a “USRPHC”), at any time within the shorter of the five-year period preceding the disposition and the Non-U.S. Holder’s holding period with respect to the applicable shares of our common stock (the “relevant period”), or (iii) such gain is effectively connected with the conduct by such Non-U.S. Holder of a trade or business in the United States (and, if required by an applicable income tax treaty, is attributable to a permanent establishment or fixed base maintained by such Non-U.S. Holder in the United States).
If the first exception applies, the Non-U.S. Holder generally will be subject to U.S. federal income tax at a rate of 30% (unless an applicable income tax treaty provides otherwise) on the amount by which such Non-U.S. Holder’s capital gains allocable to U.S. sources exceed capital losses allocable to U.S. sources during the taxable year of the disposition.
With respect to the second exception above, although there can be no assurance, we believe we are not, and we do not currently anticipate becoming, a USRPHC. However, because the determination of whether we are a USRPHC depends on the fair market value of our U.S. real property relative to the fair market value of other business assets, there can be no assurance that
167
Table of Contents
we are not currently or will not become a USRPHC in the future. Generally, a corporation is a USRPHC only if the fair market value of its United States real property interests (as defined in the Internal Revenue Code) equals or exceeds 50% of the sum of the fair market value of its worldwide real property interests plus certain other assets used or held for use in a trade or business. Even if we are or become a USRPHC, a Non-U.S. Holder would not be subject to U.S. federal income tax on a sale, exchange or other taxable disposition of our common stock by reason of our status as a USRPHC so long as (a) our common stock is regularly traded on an established securities market (within the meaning of Internal Revenue Code Section 897(c)(3)) during the calendar year in which such sale, exchange or other taxable disposition of our common stock occurs and (b) such Non-U.S. Holder does not own and is not deemed to own (directly, indirectly or constructively) more than 5% of our common stock at any time during the relevant period. If we are a USRPHC and the requirements of (a) or (b) are not met, gain on the disposition of shares of our common stock generally will be taxed in the same manner as gain that is effectively connected with the conduct of a U.S. trade or business, except that the “branch profits tax” will not apply.
If the third exception applies, the Non-U.S. Holder generally will be subject to U.S federal income tax on a net income basis with respect to such gain in the same manner as if such holder were a resident of the United States, unless otherwise provided in an applicable income tax treaty, and a Non-U.S. Holder that is a corporation for U.S federal income tax purposes may also be subject to a “branch profits tax” on its effectively connected earnings and profits at a rate of 30%, unless an applicable income tax treaty provides otherwise.
Additional withholding and information reporting requirements for shares of our common stock held by or through non-U.S. entities
Legislation enacted in March 2010 and related Treasury guidance (commonly referred to as “FATCA”) generally will impose a U.S. federal withholding tax of 30% on payments to certain non-U.S. entities (including certain intermediaries), including dividends on and the gross proceeds from a sale or other disposition of our common stock unless such persons comply with a complicated U.S. information reporting, disclosures and certification regime. This new regime requires, among other things, a broad class of persons to enter into agreements with the IRS to obtain, disclose and report information about their investors and account holders. This new regime and its requirements are different from and in addition to the certification requirements described elsewhere in this discussion. As currently proposed, the FATCA withholding rules would apply to certain payments, including dividend payments on our common stock, if any, paid after June 30, 2014, and gross proceeds from the sale or other dispositions of our common stock paid after December 31, 2016. Prospective investors should consult their own tax advisors regarding the possible impact of these rules on their investment in our common stock, and the entities through which they hold our common stock, including, without limitation, the process and deadlines for meeting the applicable requirements to prevent the imposition of this 30% withholding tax under FATCA.
Backup withholding and information reporting
We must report annually to the IRS and to each Non-U.S. Holder the gross amount of the distributions on shares of our common stock paid to such holder and the tax withheld, if any, with respect to such distributions. These information reporting requirements apply even if withholding was not required. Subject to the discussion above under “—Additional withholding
168
Table of Contents
and information reporting requirements for shares of our common stock held by or through non-U.S. entities,” a Non-U.S. Holder may have to comply with specific certification procedures to establish that the holder is not a United States person (as defined in the Internal Revenue Code) or otherwise establish an exemption in order to avoid backup withholding at the applicable rate with respect to dividends on our common stock. Dividends paid to Non-U.S. Holders subject to the U.S. federal withholding tax, as described above In “—Distributions on shares of our common stock,” generally will be exempt from U.S. backup withholding.
Information reporting and backup withholding will generally apply to the payment of the proceeds of a disposition of shares of our common stock by a Non-U.S. Holder effected by or through the U.S. office of any broker, U.S. or non-U.S., unless the holder certifies that it is not a United States person (as defined in the Internal Revenue Code) and satisfies certain other requirements, or otherwise establishes an exemption. For information reporting purposes, dispositions effected through a non-U.S. office of a broker with substantial U.S. ownership or operations generally will be treated in a manner similar to dispositions effected through a U.S. office of a broker, and dispositions otherwise effected through a non-U.S. office generally will not be subject to information reporting. Generally, backup withholding will not apply to a payment of disposition proceeds to a Non-U.S. Holder where the transaction is effected through a non-U.S. office of a U.S. broker or non-U.S. office of a non-U.S broker. Prospective investors are urged to consult their own tax advisors regarding the application of the information reporting and backup withholding rules to them.
Copies of information returns may be made available to the tax authorities of the country in which the Non-U.S. Holder resides or is incorporated, under the provisions of a specific treaty or agreement.
Backup withholding is not an additional tax. Any amounts withheld under the backup withholding rules from a payment made to a Non-U.S. Holder can be refunded or credited against such Non-U.S. Holder’s U.S. federal income tax liability, if any, provided that an appropriate claim is timely filed with the IRS.
Federal estate tax
Shares of our common stock held (or treated as held) by an individual who is not a U.S. citizen or resident (as defined for U.S. federal estate tax purposes) at the time of such individual’s death will be included in such individual’s gross estate for U.S. federal estate tax purposes, unless an applicable estate tax treaty provides otherwise.
169
Table of Contents
We are offering the shares of common stock described in this prospectus through a number of underwriters. J.P. Morgan Securities LLC, Goldman, Sachs & Co. and Morgan Stanley & Co. LLC are acting as joint book-running managers of the offering and as representatives of the underwriters. In addition, Merrill Lynch, Pierce, Fenner & Smith Incorporated, Barclays Capital Inc., Deutsche Bank Securities Inc. and Wells Fargo Securities, LLC are joint book-running managers in the offering. We have entered into an underwriting agreement with the underwriters. Subject to the terms and conditions of the underwriting agreement, we and the selling stockholders have agreed to sell to the underwriters, and each underwriter has severally agreed to purchase, at the public offering price less the underwriting discounts and commissions set forth on the cover page of this prospectus, the number of shares of common stock listed next to its name in the following table:
| Name | Number of shares | |
|
| ||
| J.P. Morgan Securities LLC |
||
| Goldman, Sachs & Co. |
||
| Morgan Stanley & Co. LLC |
||
| Merrill Lynch, Pierce, Fenner & Smith Incorporated |
||
| Barclays Capital Inc. |
||
| Deutsche Bank Securities Inc. |
||
| Wells Fargo Securities, LLC |
||
| TPG Capital BD, LLC |
||
| HSBC Securities (USA) Inc. SunTrust Robinson Humphrey, Inc. |
||
| Mizuho Securities USA Inc. |
||
| RBC Capital Markets, LLC |
||
| Piper Jaffray & Co. |
||
| William Blair & Company, L.L.C. |
||
| Drexel Hamilton, LLC |
||
| Leerink Partners LLC |
||
| Stifel, Nicolaus & Company, Incorporated |
||
| Total |
||
|
| ||
The underwriters are committed to purchase all the common shares offered by us and the selling stockholders if they purchase any shares. The underwriting agreement also provides that if an underwriter defaults, the purchase commitments of non-defaulting underwriters may also be increased or the offering may be terminated.
The underwriters propose to offer the common shares directly to the public at the initial public offering price set forth on the cover page of this prospectus and to certain dealers at that price less a concession not in excess of $ per share. Any such dealers may resell shares to certain other brokers or dealers at a discount of up to $ per share from the initial public offering price. After the initial public offering of the shares, the offering price and other selling terms may be changed by the underwriters. Sales of shares made outside of the United States may be made by affiliates of the underwriters.
The underwriters have an option to buy up to additional shares of common stock to cover sales of shares by the underwriters which exceed the number of shares specified in the table
170
Table of Contents
above. The underwriters have 30 days from the date of this prospectus to exercise this over-allotment option. If any shares are purchased with this over-allotment option, the underwriters will purchase shares in approximately the same proportion as shown in the table above. If any additional shares of common stock are purchased, the underwriters will offer the additional shares on the same terms as those on which the shares are being offered.
The underwriting fee is equal to the public offering price per share of common stock less the amount paid by the underwriters to us per share of common stock. The underwriting fee is $ per share. The following table shows the per share and total underwriting discounts and commissions to be paid to the underwriters assuming both no exercise and full exercise of the underwriters’ option to purchase additional shares.
| Paid by the company | Paid by the selling stockholders | |||||||||||||||
| No exercise | Full exercise | No exercise | Full exercise | |||||||||||||
|
|
||||||||||||||||
| Per share |
$ | $ | $ | $ | ||||||||||||
| Total |
$ | $ | $ | $ | ||||||||||||
|
|
||||||||||||||||
We estimate that the total expenses of this offering, including registration, filing and listing fees, printing fees and legal and accounting expenses, but excluding the underwriting discounts and commissions, will be approximately $ .
A prospectus in electronic format may be made available on the websites maintained by one or more underwriters, or selling group members, if any, participating in the offering. The underwriters may agree to allocate a number of shares to underwriters and selling group members for sale to their online brokerage account holders. Internet distributions will be allocated by the representatives to underwriters and selling group members that may make Internet distributions on the same basis as other allocations.
We have agreed that we will not (i) offer, pledge, sell, contract to sell, sell any option or contract to purchase, purchase any option or contract to sell, grant any option, right or warrant to purchase or otherwise transfer or dispose of, directly or indirectly, or file with the SEC a registration statement under the Securities Act relating to, any shares of our common stock or securities convertible into or exchangeable or exercisable for any shares of our common stock, or publicly disclose the intention to make any offer, sale, pledge or disposition, or (ii) enter into any swap or other arrangement that transfers all or a portion of the economic consequences associated with the ownership of any shares of common stock or any such other securities (regardless of whether any of these transactions are to be settled by the delivery of shares of common stock or such other securities, in cash or otherwise), in each case without the prior written consent of certain of the underwriters for a period of 180 days after the date of this prospectus, other than the shares of our common stock to be sold hereunder and subject to certain other limited exceptions. Notwithstanding the foregoing, if (1) during the last 17 days of the 180-day restricted period, we issue an earnings release or material news or a material event relating to our company occurs; or (2) prior to the expiration of the 180-day restricted period, we announce that we will release earnings results during the 16-day period beginning on the last day of the 180-day period, the restrictions described above shall continue to apply until the expiration of the 18-day period beginning on the issuance of the earnings release or the occurrence of the material news or material event
Our directors and executive officers, the selling stockholders, and certain of our other significant stockholders have entered into lock-up agreements with the underwriters prior to the
171
Table of Contents
commencement of this offering pursuant to which each of these persons or entities, with limited exceptions, for a period of 180 days after the date of this prospectus, may not, without the prior written consent of certain of the underwriters, (1) offer, pledge, sell, contract to sell, sell any option or contract to purchase, purchase any option or contract to sell, grant any option, right or warrant to purchase, or otherwise transfer or dispose of, directly or indirectly, any shares of our common stock or any securities convertible into or exercisable or exchangeable for our common stock (including, without limitation, common stock or such other securities which may be deemed to be beneficially owned by such directors, executive officers, managers and members in accordance with the rules and regulations of the SEC and securities which may be issued upon exercise of a stock option or warrant), (2) enter into any swap or other agreement that transfers, in whole or in part, any of the economic consequences of ownership of the common stock or such other securities, whether any such transaction described in clause (1) or (2) above is to be settled by delivery of common stock or such other securities, in cash or otherwise, or (3) make any demand for or exercise any right with respect to the registration of any shares of our common stock or any security convertible into or exercisable or exchangeable for our common stock. Notwithstanding the foregoing, if (1) during the last 17 days of the 180-day restricted period, we issue an earnings release or material news or a material event relating to our company occurs; or (2) prior to the expiration of the 180-day restricted period, we announce that we will release earnings results during the 16-day period beginning on the last day of the 180-day period, the restrictions described above shall continue to apply until the expiration of the 18-day period beginning on the issuance of the earnings release or the occurrence of the material news or material event.
We have agreed to indemnify the underwriters against certain liabilities, including liabilities under the Securities Act of 1933, as amended.
We have applied to have our common stock approved for listing on the NYSE under the symbol “IMS.”
In connection with this offering, the underwriters may engage in stabilizing transactions, which involves making bids for, purchasing and selling shares of common stock in the open market for the purpose of preventing or retarding a decline in the market price of the common stock while this offering is in progress. These stabilizing transactions may include making short sales of the common stock, which involves the sale by the underwriters of a greater number of shares of common stock than they are required to purchase in this offering, and purchasing shares of common stock on the open market to cover positions created by short sales. Short sales may be “covered” shorts, which are short positions in an amount not greater than the underwriters’ over-allotment option referred to above, or may be “naked” shorts, which are short positions in excess of that amount. The underwriters may close out any covered short position either by exercising their over-allotment option, in whole or in part, or by purchasing shares in the open market. In making this determination, the underwriters will consider, among other things, the price of shares available for purchase in the open market compared to the price at which the underwriters may purchase shares through the over-allotment option. A naked short position is more likely to be created if the underwriters are concerned that there may be downward pressure on the price of the common stock in the open market that could adversely affect investors who purchase in this offering. To the extent that the underwriters create a naked short position, they will purchase shares in the open market to cover the position.
The underwriters have advised us that, pursuant to Regulation M of the Securities Act of 1933, they may also engage in other activities that stabilize, maintain or otherwise affect the price of
172
Table of Contents
the common stock, including the imposition of penalty bids. This means that if the representatives of the underwriters purchase common stock in the open market in stabilizing transactions or to cover short sales, the representatives can require the underwriters that sold those shares as part of this offering to repay the underwriting discount received by them.
These activities may have the effect of raising or maintaining the market price of the common stock or preventing or retarding a decline in the market price of the common stock, and, as a result, the price of the common stock may be higher than the price that otherwise might exist in the open market. If the underwriters commence these activities, they may discontinue them at any time. The underwriters may carry out these transactions on the NYSE, in the over-the-counter market or otherwise.
Prior to this offering, there has been no public market for our common stock. The initial public offering price will be determined by negotiations between us and the representatives of the underwriters. In determining the initial public offering price, we and the representatives of the underwriters expect to consider a number of factors including:
| • | the information set forth in this prospectus and otherwise available to the representatives; |
| • | our prospects and the history and prospects for the industry in which we compete; |
| • | an assessment of our management; |
| • | our prospects for future earnings; |
| • | the general condition of the securities markets at the time of this offering; |
| • | the recent market prices of, and demand for, publicly traded common stock of generally comparable companies; and |
| • | other factors deemed relevant by the underwriters and us. |
Neither we nor the underwriters can assure investors that an active trading market will develop for our common shares, or that the shares will trade in the public market at or above the initial public offering price.
Selling Restrictions
General
Other than in the United States, no action has been taken by us or the underwriters that would permit a public offering of the securities offered by this prospectus in any jurisdiction where action for that purpose is required. The securities offered by this prospectus may not be offered or sold, directly or indirectly, nor may this prospectus or any other offering material or advertisements in connection with the offer and sale of any such securities be distributed or published in any jurisdiction, except under circumstances that will result in compliance with the applicable rules and regulations of that jurisdiction. Persons into whose possession this prospectus comes are advised to inform themselves about and to observe any restrictions relating to the offering and the distribution of this prospectus. This prospectus does not constitute an offer to sell or a solicitation of an offer to buy any securities offered by this prospectus in any jurisdiction in which such an offer or a solicitation is unlawful.
173
Table of Contents
United Kingdom
This document is only being distributed to and is only directed at (i) persons who are outside the United Kingdom or (ii) to investment professionals falling within Article 19(5) of the Financial Services and Markets Act 2000 (Financial Promotion) Order 2005 (the “Order”) or (iii) high net worth entities, and other persons to whom it may lawfully be communicated, falling with Article 49(2)(a) to (d) of the Order (all such persons together being referred to as “relevant persons”). The securities are only available to, and any invitation, offer or agreement to subscribe, purchase or otherwise acquire such securities will be engaged in only with, relevant persons. Any person who is not a relevant person should not act or rely on this document or any of its contents.
European Economic Area
In relation to each Member State of the European Economic Area which has implemented the Prospectus Directive (each, a “Relevant Member State”), from and including the date on which the European Union Prospectus Directive (the “EU Prospectus Directive”) was implemented in that Relevant Member State (the “Relevant Implementation Date”) an offer of securities described in this prospectus may not be made to the public in that Relevant Member State prior to the publication of a prospectus in relation to the shares which has been approved by the competent authority in that Relevant Member State or, where appropriate, approved in another Relevant Member State and notified to the competent authority in that Relevant Member State, all in accordance with the EU Prospectus Directive, except that, with effect from and including the Relevant Implementation Date, an offer of securities described in this prospectus may be made to the public in that Relevant Member State at any time:
| • | to any legal entity which is a qualified investor as defined under the EU Prospectus Directive; |
| • | to fewer than 100 or, if the Relevant Member State has implemented the relevant provision of the 2010 PD Amending Directive, 150 natural or legal persons (other than qualified investors as defined in the EU Prospectus Directive); or |
| • | in any other circumstances falling within Article 3(2) of the EU Prospectus Directive, provided that no such offer of securities described in this prospectus shall result in a requirement for the publication by us of a prospectus pursuant to Article 3 of the EU Prospectus Directive. |
For the purposes of this provision, the expression an “offer of securities to the public” in relation to any securities in any Relevant Member State means the communication in any form and by any means of sufficient information on the terms of the offer and the securities to be offered so as to enable an investor to decide to purchase or subscribe for the securities, as the same may be varied in that Member State by any measure implementing the EU Prospectus Directive in that Member State. The expression “EU Prospectus Directive” means Directive 2003/71/EC (and any amendments thereto, including the 2010 PD Amending Directive, to the extent implemented in the Relevant Member State) and includes any relevant implementing measure in each Relevant Member State, and the expression “2010 PD Amending Directive” means Directive 2010/73/EU.
Switzerland
The shares may not be publicly offered in Switzerland and will not be listed on the SIX Swiss Exchange (“SIX”) or on any other stock exchange or regulated trading facility in Switzerland. This document has been prepared without regard to the disclosure standards for issuance prospectuses under art. 652a or art. 1156 of the Swiss Code of Obligations or the disclosure
174
Table of Contents
standards for listing prospectuses under art. 27 ff. of the SIX Listing Rules or the listing rules of any other stock exchange or regulated trading facility in Switzerland. Neither this document nor any other offering or marketing material relating to the shares or the offering may be publicly distributed or otherwise made publicly available in Switzerland.
Neither this document nor any other offering or marketing material relating to the offering, us, the shares have been or will be filed with or approved by any Swiss regulatory authority. In particular, this document will not be filed with, and the offer of shares will not be supervised by, the Swiss Financial Market Supervisory Authority FINMA (FINMA), and the offer of shares has not been and will not be authorized under the Swiss Federal Act on Collective Investment Schemes (“CISA”). The investor protection afforded to acquirers of interests in collective investment schemes under the CISA does not extend to acquirers of shares.
Dubai International Financial Centre
This prospectus relates to an Exempt Offer in accordance with the Offered Securities Rules of the Dubai Financial Services Authority (“DFSA”). This prospectus is intended for distribution only to persons of a type specified in the Offered Securities Rules of the DFSA. It must not be delivered to, or relied on by, any other person. The DFSA has no responsibility for reviewing or verifying any documents in connection with Exempt Offers. The DFSA has not approved this prospectus nor taken steps to verify the information set forth herein and has no responsibility for the prospectus. The shares to which this prospectus relates may be illiquid and/or subject to restrictions on their resale. Prospective purchasers of the shares offered should conduct their own due diligence on the shares. If you do not understand the contents of this prospectus you should consult an authorized financial advisor.
Australia
No placement document, prospectus, product disclosure statement or other disclosure document has been lodged with the Australian Securities and Investments Commission (“ASIC”), in relation to the offering. This prospectus does not constitute a prospectus, product disclosure statement or other disclosure document under the Corporations Act 2001 (the “Corporations Act”), and does not purport to include the information required for a prospectus, product disclosure statement or other disclosure document under the Corporations Act.
Any offer in Australia of the shares may only be made to persons (the “Exempt Investors”) who are “sophisticated investors” (within the meaning of section 708(8) of the Corporations Act), “professional investors” (within the meaning of section 708(11) of the Corporations Act) or otherwise pursuant to one or more exemptions contained in section 708 of the Corporations Act so that it is lawful to offer the shares without disclosure to investors under Chapter 6D of the Corporations Act.
The shares applied for by Exempt Investors in Australia must not be offered for sale in Australia in the period of 12 months after the date of allotment under the offering, except in circumstances where disclosure to investors under Chapter 6D of the Corporations Act would not be required pursuant to an exemption under section 708 of the Corporations Act or otherwise or where the offer is pursuant to a disclosure document which complies with Chapter 6D of the Corporations Act. Any person acquiring shares must observe such Australian on-sale restrictions.
This prospectus contains general information only and does not take account of the investment objectives, financial situation or particular needs of any particular person. It does not contain any
175
Table of Contents
securities recommendations or financial product advice. Before making an investment decision, investors need to consider whether the information in this prospectus is appropriate to their needs, objectives and circumstances, and, if necessary, seek expert advice on those matters.
Hong Kong
The securities have not been offered or sold and will not be offered or sold in Hong Kong, by means of any document, other than (a) to “professional investors” as defined in the Securities and Futures Ordinance (Cap. 571) of Hong Kong and any rules made under that Ordinance; or (b) in other circumstances which do not result in the document being a “prospectus” as defined in the Companies Ordinance (Cap. 32) of Hong Kong or which do not constitute an offer to the public within the meaning of that Ordinance. No advertisement, invitation or document relating to the securities has been or may be issued or has been or may be in the possession of any person for the purposes of issue, whether in Hong Kong or elsewhere, which is directed at, or the contents of which are likely to be accessed or read by, the public of Hong Kong (except if permitted to do so under the securities laws of Hong Kong) other than with respect to securities which are or are intended to be disposed of only to persons outside Hong Kong or only to “professional investors” as defined in the Securities and Futures Ordinance and any rules made under that Ordinance.
Japan
The securities have not been and will not be registered under the Financial Instruments and Exchange Law of Japan (Law No. 25 of 1948, as amended) and, accordingly, will not be offered or sold, directly or indirectly, in Japan, or for the benefit of any Japanese Person or to others for re-offering or resale, directly or indirectly, in Japan or to any Japanese Person, except in compliance with all applicable laws, regulations and ministerial guidelines promulgated by relevant Japanese governmental or regulatory authorities in effect at the relevant time. For the purposes of this paragraph, “Japanese Person” shall mean any person resident in Japan, including any corporation or other entity organized under the laws of Japan.
Singapore
This prospectus has not been registered as a prospectus with the Monetary Authority of Singapore. Accordingly, this prospectus and any other document or material in connection with the offer or sale, or invitation for subscription or purchase, of the shares may not be circulated or distributed, nor may the shares be offered or sold, or be made the subject of an invitation for subscription or purchase, whether directly or indirectly, to persons in Singapore other than (i) to an institutional investor under Section 274 of the Securities and Futures Act, Chapter 289 of Singapore (the “SFA”), (ii) to a relevant person pursuant to Section 275(1), or any person pursuant to Section 275(1A), and in accordance with the conditions specified in Section 275, of the SFA, or (iii) otherwise pursuant to, and in accordance with the conditions of, any other applicable provision of the SFA.
Where the shares are subscribed or purchased under Section 275 of the SFA by a relevant person which is: (a) a corporation (which is not an accredited investor (as defined in Section 4A of the SFA)) the sole business of which is to hold investments and the entire share capital of which is owned by one or more individuals, each of whom is an accredited investor; or (b) a trust (where the trustee is not an accredited investor) whose sole purpose is to hold investments and each
176
Table of Contents
beneficiary of the trust is an individual who is an accredited investor, securities (as defined in Section 239(1) of the SFA) of that corporation or the beneficiaries’ rights and interest (howsoever described) in that trust shall not be transferred within six months after that corporation or that trust has acquired the shares pursuant to an offer made under Section 275 of the SFA except: (1) to an institutional investor or to a relevant person defined in Section 275(2) of the SFA, or to any person arising from an offer referred to in Section 275(1A) or Section 276(4)(i)(B) of the SFA; (2) where no consideration is or will be given for the transfer; (3) where the transfer is by operation of law; (4) as specified in Section 276(7) of the SFA; or (5) as specified in Regulation 32 of the Securities and Futures (Offers of Investments) (Shares and Debentures) Regulations 2005 of Singapore.
Certain affiliates of Goldman, Sachs & Co., an underwriter of this offering, hold a portion of our 12.5% Senior Notes, and it is expected that as a result of the Refinancing, these affiliates of Goldman, Sachs & Co. will receive more than 5% of the net proceeds of the offering. See “Use of proceeds.” In addition, affiliates of TPG Capital BD, LLC, an underwriter of this offering, own in excess of 10% of our issued and outstanding common stock. As a result of the foregoing relationships, each of Goldman, Sachs & Co. and TPG Capital BD, LLC is deemed to have a “conflict of interest” within the meaning of FINRA Rule 5121, and this offering will be conducted in accordance with such rule. FINRA Rule 5121 requires that neither Goldman, Sachs & Co. nor TPG Capital BD, LLC make sales to discretionary accounts without the prior written approval of the account holder and that a qualified independent underwriter (“QIU”), as defined in FINRA Rule 5121, participate in the preparation of the registration statement and this prospectus and exercise its usual standards of due diligence with respect thereto. J.P. Morgan Securities LLC has agreed to act as QIU for this offering. J.P. Morgan Securities LLC will not receive any additional fees for serving as QIU in connection with this offering. We have agreed to indemnify J.P. Morgan Securities LLC against certain liabilities incurred in connection with acting as QIU, including liabilities under the Securities Act or contribute to payments that the underwriters may be required to make in that respect.
Other relationships
The underwriters and their respective affiliates are full service financial institutions engaged in various activities, which may include securities trading, commercial and investment banking, financial advisory, investment management, investment research, principal investment, hedging, financing and brokerage activities.
Certain of the underwriters and their affiliates have provided in the past to us and our affiliates and may provide from time to time in the future certain commercial banking, financial advisory, investment banking and other services for us and such affiliates in the ordinary course of their business, for which they have received and may continue to receive customary fees and commissions. Certain of the underwriters and/or their affiliates are lenders under our Senior Secured Credit Facilities. TPG Capital BD, LLC participated as an initial purchaser in connection with the offering by our wholly-owned direct subsidiary, Healthcare Technology Intermediate, Inc., of $750 million Senior PIK Notes in August 2013. See “Certain relationships and related party transactions—Certain other relationships.” In addition, affiliates of certain of the underwriters own, directly or indirectly, equity interests in us. Further, from time to time, certain of the underwriters and their affiliates may effect transactions for their own account or the account of customers, and hold on behalf of themselves or their customers, long or short positions in our
177
Table of Contents
debt or equity securities or loans, and may do so in the future. In the ordinary course of their various business activities, the underwriters and their respective affiliates may make or hold a broad array of investments and actively trade debt and equity securities (or related derivative securities) and financial instruments (including bank loans) for their own account and for the accounts of their customers, and such investment and securities activities may involve securities and/or instruments of the issuer. The underwriters and their respective affiliates may also make investment recommendations and/or publish or express independent research views in respect of such securities or instruments and may at any time hold, or recommend to clients that they acquire, long and/or short positions in such securities and instruments.
178
Table of Contents
The validity of the issuance of our common stock offered in this prospectus will be passed upon for us by Ropes & Gray LLP, Boston, Massachusetts. Ropes & Gray LLP and some of its attorneys are limited partners of RGIP, LP, which is an investor in certain investment funds affiliated with TPG. RGIP, LP indirectly owns less than 1% of our outstanding shares of common stock. Cleary Gottlieb Steen & Hamilton LLP, New York, New York will act as counsel to the underwriters.
The financial statements as of December 31, 2013 and December 31, 2012 and for each of the three years in the period ended December 31, 2013 included in this Prospectus have been so included in reliance on the reports of PricewaterhouseCoopers LLP, an independent registered public accounting firm, given on the authority of said firm as experts in auditing and accounting.
Where you can find more information
We have filed with the SEC a registration statement on Form S-1 under the Securities Act with respect to the shares of common stock offered hereby. This prospectus, which constitutes a part of the registration statement, does not contain all of the information set forth in the registration statement or the exhibits and schedules filed therewith. For further information with respect to us and the common stock offered hereby, please refer to the registration statement and the exhibits and schedules filed therewith. Statements contained in this prospectus regarding the contents of any contract or any other document that is filed as an exhibit to the registration statement are not necessarily complete, and each such statement is qualified in all respects by reference to the full text of such contract or other document filed as an exhibit to the registration statement. A copy of the registration statement and the exhibits and schedules filed therewith may be inspected without charge at the public reference room maintained by the SEC, located at 100 F Street N.E., Washington, D.C. 20549, and copies of all or any part of the registration statement may be obtained from such offices upon the payment of the fees prescribed by the SEC. Please call the SEC at 1-800-SEC-0330 for further information about the public reference room. The SEC also maintains a website that contains reports, proxy and information statements and other information regarding registrants that file electronically with the SEC. The SEC’s website address is www.sec.gov.
Upon completion of this offering, we will become subject to the information and periodic reporting requirements of the Exchange Act and, in accordance therewith, we will file periodic reports, proxy statements and other information with the SEC. Such periodic reports, proxy statements and other information will be available for inspection and copying at the public reference room and website of the SEC referred to above.
179
Table of Contents
Index to consolidated financial statements and
| Page | ||||
| Audited Consolidated Financial Statements |
||||
| F-2 | ||||
| Financial Statements: |
||||
| As of December 31, 2013 and 2012: |
||||
| F-3 | ||||
| For years ended December 31, 2013, 2012 and 2011: |
||||
| F-4 | ||||
| F-5 | ||||
| F-7 | ||||
| F-9 | ||||
| Other Financial Information: |
||||
| F-56 | ||||
| F-57 | ||||
| Schedule II. Valuation and Qualifying Accounts for the years ended December 31, 2013, 2012 and 2011 |
F-61 | |||
F-1
Table of Contents
Report of independent registered public accounting firm
To the Board of Directors and Shareholders of IMS Health Holdings, Inc.:
In our opinion, the consolidated financial statements listed in the accompanying index present fairly, in all material respects, the financial position of IMS Health Holdings, Inc. and its subsidiaries at December 31, 2013 and December 31, 2012, and the results of their operations and their cash flows for each of the three years in the period ended December 31, 2013 in conformity with accounting principles generally accepted in the United States of America. In addition, in our opinion, the financial statement schedules listed in the accompanying index present fairly, in all material respects, the information set forth therein when read in conjunction with the related consolidated financial statements. These financial statements and financial statement schedules are the responsibility of the Company’s management. Our responsibility is to express an opinion on these financial statements and financial statement schedules based on our audits. We conducted our audits of these statements in accordance with the standards of the Public Company Accounting Oversight Board (United States). Those standards require that we plan and perform the audit to obtain reasonable assurance about whether the financial statements are free of material misstatement. An audit includes examining, on a test basis, evidence supporting the amounts and disclosures in the financial statements, assessing the accounting principles used and significant estimates made by management, and evaluating the overall financial statement presentation. We believe that our audits provide a reasonable basis for our opinion.
/s/ PricewaterhouseCoopers LLP
New York, New York
February 13, 2014
F-2
Table of Contents
Consolidated statements of financial position
| December 31, | ||||||||
| (Dollars and shares in millions, except per share data) | 2013 | 2012 | ||||||
|
|
||||||||
| Assets: |
||||||||
| Current Assets: |
||||||||
| Cash and cash equivalents |
$ | 725 | $ | 580 | ||||
| Restricted cash |
27 | 25 | ||||||
| Short-term investments |
4 | 61 | ||||||
| Accounts receivable, net |
313 | 308 | ||||||
| Other current assets |
258 | 263 | ||||||
|
|
|
|||||||
| Total Current Assets |
1,327 | 1,237 | ||||||
|
|
|
|||||||
| Property, plant and equipment, net of accumulated depreciation of $145 and $115 in 2013 and 2012, respectively |
117 | 117 | ||||||
| Computer software |
263 | 254 | ||||||
| Goodwill |
3,573 | 3,583 | ||||||
| Other intangibles, net of accumulated amortization of $1,071 and $802 in 2013 and 2012, respectively |
2,517 | 2,873 | ||||||
| Other assets |
202 | 151 | ||||||
|
|
|
|||||||
| Total Assets |
$ | 7,999 | $ | 8,215 | ||||
|
|
|
|||||||
| Liabilities and Shareholders’ Equity: |
||||||||
| Current Liabilities: |
||||||||
| Accounts payable |
$ | 103 | $ | 109 | ||||
| Accrued and other current liabilities |
583 | 533 | ||||||
| Short-term debt |
66 | 28 | ||||||
| Deferred revenues |
180 | 173 | ||||||
|
|
|
|||||||
| Total Current Liabilities |
932 | 843 | ||||||
|
|
|
|||||||
| Postretirement and postemployment benefits |
77 | 116 | ||||||
| Long-term debt |
4,894 | 4,149 | ||||||
| Deferred tax liability |
1,102 | 1,317 | ||||||
| Other liabilities |
111 | 107 | ||||||
|
|
|
|||||||
| Total Liabilities |
7,116 | 6,532 | ||||||
|
|
|
|||||||
| Commitments and Contingencies (Notes 11 and 12) |
||||||||
| Shareholders’ Equity: |
||||||||
| Common Stock, $.001 par value, 3,075 and 3,075 shares authorized, 2,805 and 2,804 issued and outstanding in 2013 and 2012, respectively. |
3 | 3 | ||||||
| Capital in excess of par |
913 | 1,634 | ||||||
| Accumulated deficit |
(20 | ) | (102 | ) | ||||
| Treasury stock, at cost, 5 and 4 shares in 2013 and 2012, respectively |
(6 | ) | (4 | ) | ||||
| Accumulated other comprehensive (loss) income |
(7 | ) | 152 | |||||
|
|
|
|||||||
| Total Shareholders’ Equity |
883 | 1,683 | ||||||
|
|
|
|||||||
| Total Liabilities and Shareholders’ Equity |
$ | 7,999 | $ | 8,215 | ||||
|
|
||||||||
The accompanying notes are an integral part of the Consolidated Financial Statements.
F-3
Table of Contents
Consolidated statements of comprehensive (loss) income
| Year ended December 31, | ||||||||||||
| (Dollars and shares in millions, except per share data) | 2013 | 2012 | 2011 | |||||||||
|
|
||||||||||||
| Revenue |
$ | 2,544 | $ | 2,443 | $ | 2,364 | ||||||
|
|
|
|||||||||||
| Information |
1,525 | 1,521 | 1,532 | |||||||||
| Technology services |
1,019 | 922 | 832 | |||||||||
|
|
|
|||||||||||
| Operating costs of information, exclusive of depreciation and amortization |
648 | 675 | 698 | |||||||||
| Direct and incremental costs of technology services, exclusive of depreciation and amortization |
520 | 476 | 396 | |||||||||
| Selling and administrative expenses, exclusive of depreciation and amortization |
596 | 579 | 604 | |||||||||
| Depreciation and amortization |
410 | 424 | 393 | |||||||||
| Severance, impairment and other charges |
16 | 48 | 31 | |||||||||
| Merger costs |
— | 2 | 23 | |||||||||
|
|
|
|||||||||||
| Operating Income |
354 | 239 | 219 | |||||||||
|
|
|
|||||||||||
| Interest income |
4 | 4 | 3 | |||||||||
| Interest expense |
(332 | ) | (275 | ) | (277 | ) | ||||||
| Other loss, net |
(74 | ) | (29 | ) | (7 | ) | ||||||
|
|
|
|||||||||||
| Non-Operating Loss, net |
(402 | ) | (300 | ) | (281 | ) | ||||||
|
|
|
|||||||||||
| Loss before benefit from income taxes |
(48 | ) | (61 | ) | (62 | ) | ||||||
| Benefit from income taxes |
130 | 19 | 173 | |||||||||
|
|
|
|||||||||||
| Net Income (Loss) |
$ | 82 | $ | (42 | ) | $ | 111 | |||||
|
|
|
|||||||||||
| Income (loss) per share attributable to common shareholders: |
||||||||||||
| Basic |
$ | 0.03 | $ | (0.02 | ) | $ | 0.04 | |||||
| Diluted |
$ | 0.03 | $ | (0.02 | ) | $ | 0.04 | |||||
| Weighted-average common shares outstanding: |
||||||||||||
| Basic |
2,800 | 2,795 | 2,788 | |||||||||
| Diluted |
2,870 | 2,795 | 2,793 | |||||||||
| Unaudited pro forma net income (loss) per share: |
||||||||||||
| Basic |
||||||||||||
| Diluted |
||||||||||||
| Unaudited pro forma weighted-average common shares outstanding: |
||||||||||||
| Basic |
||||||||||||
| Diluted |
||||||||||||
| Other Comprehensive (Loss) Income: |
||||||||||||
| Net Income (Loss) |
$ | 82 | $ | (42 | ) | $ | 111 | |||||
|
|
|
|||||||||||
| Cumulative translation adjustments (net of taxes of $–, $7 and $(3), respectively) |
(183 | ) | (49 | ) | 51 | |||||||
| Change in derivatives in OCI (net of taxes of $(4), $(2) and $3, respectively) |
9 | 3 | (6 | ) | ||||||||
| Change in derivatives from OCI to earnings (net of taxes of $5, $2 and $(7), respectively) |
(9 | ) | (4 | ) | 13 | |||||||
| Postretirement and postemployment adjustments (net of taxes of $(16), $5 and $9, respectively) |
24 | (17 | ) | (22 | ) | |||||||
|
|
|
|||||||||||
| Other Comprehensive (Loss) Income |
(159 | ) | (67 | ) | 36 | |||||||
|
|
|
|||||||||||
| Total Comprehensive (Loss) Income |
$ | (77 | ) | $ | (109 | ) | $ | 147 | ||||
|
|
||||||||||||
The accompanying notes are an integral part of the Consolidated Financial Statements.
F-4
Table of Contents
Consolidated statements of cash flows
| Year ended December 31, | ||||||||||||
| (Dollars in millions) | 2013 | 2012 | 2011 | |||||||||
|
|
||||||||||||
| Cash Flows from Operating Activities: |
||||||||||||
| Net income (loss) |
$ | 82 | $ | (42 | ) | $ | 111 | |||||
| Adjustments to reconcile net income (loss) to net cash provided by operating activities: |
||||||||||||
| Depreciation and amortization |
410 | 424 | 393 | |||||||||
| Bad debt expense |
1 | 2 | 1 | |||||||||
| Loss on extinguishment of debt |
9 | — | — | |||||||||
| Deferred income taxes |
(206 | ) | (109 | ) | (199 | ) | ||||||
| Loss on investments and sale of assets, net |
3 | 2 | 1 | |||||||||
| Non-cash stock-based compensation charges |
22 | 19 | 18 | |||||||||
| Non-cash portion of severance, impairment and other charges |
— | 25 | 2 | |||||||||
| FX loss on revaluation of foreign denominated debt |
40 | 18 | 3 | |||||||||
| Non-cash (gains) losses on derivatives |
(10 | ) | (2 | ) | 17 | |||||||
| Non-cash amortization of debt original issue discount |
17 | 18 | 18 | |||||||||
| Change in assets and liabilities, excluding effects from acquisitions and dispositions: |
||||||||||||
| Net decrease in accounts receivable |
4 | 7 | 11 | |||||||||
| Net (increase) decrease in other current assets |
(9 | ) | 5 | (6 | ) | |||||||
| Net (decrease) increase in accounts payable |
(5 | ) | 24 | (19 | ) | |||||||
| Net increase (decrease) in accrued and other current liabilities |
70 | 10 | (10 | ) | ||||||||
| Net increase (decrease) in deferred revenues |
5 | (7 | ) | 12 | ||||||||
| Net increase in pension assets (net of liabilities) |
(38 | ) | (8 | ) | (29 | ) | ||||||
| Net decrease in other long-term assets (net of long term liabilities) |
5 | 13 | 10 | |||||||||
|
|
|
|||||||||||
| Net Cash Provided by Operating Activities |
$ | 400 | $ | 399 | $ | 334 | ||||||
|
|
||||||||||||
The accompanying notes are an integral part of the Consolidated Financial Statements.
F-5
Table of Contents
IMS Health Holdings, Inc.
Consolidated statements of cash flows (continued)
| Year ended December 31, | ||||||||||||
| (Dollars in millions) | 2013 | 2012 | 2011 | |||||||||
|
|
||||||||||||
| Cash Flows Used in Investing Activities: |
||||||||||||
| Capital expenditures |
$ | (41 | ) | $ | (44 | ) | $ | (30 | ) | |||
| Additions to computer software |
(81 | ) | (64 | ) | (74 | ) | ||||||
| Proceeds from sale of assets |
— | 25 | — | |||||||||
| Purchases of short-term investments |
(22 | ) | (55 | ) | — | |||||||
| Proceeds from short-term investments |
85 | — | — | |||||||||
| Payments for acquisitions of businesses, net of cash acquired |
(118 | ) | (72 | ) | (380 | ) | ||||||
| Other investing activities, net |
(3 | ) | 1 | (1 | ) | |||||||
|
|
|
|||||||||||
| Net Cash Used in Investing Activities |
(180 | ) | (209 | ) | (485 | ) | ||||||
|
|
|
|||||||||||
| Cash Flows (Used in) Provided by Financing Activities: |
||||||||||||
| Net borrowings under revolving credit facility |
135 | 116 | 57 | |||||||||
| Net repayments of revolving credit facility |
(135 | ) | (169 | ) | (4 | ) | ||||||
| Proceeds from issuance of debt |
750 | 1,233 | 70 | |||||||||
| Repayment of term loans |
(28 | ) | (22 | ) | (16 | ) | ||||||
| Debt issuance costs |
(17 | ) | (24 | ) | (3 | ) | ||||||
| Dividends paid |
(753 | ) | (1,202 | ) | — | |||||||
| Proceeds from equity plan activity |
1 | 7 | 5 | |||||||||
| Payments for treasury stock |
(1 | ) | (2 | ) | (3 | ) | ||||||
| Other financing activities, net |
(4 | ) | — | — | ||||||||
|
|
|
|||||||||||
| Net Cash (Used in) Provided by Financing Activities |
(52 | ) | (63 | ) | 106 | |||||||
|
|
|
|||||||||||
| Effect of Exchange Rate Changes on Cash and Cash Equivalents |
(23 | ) | — | 2 | ||||||||
|
|
|
|||||||||||
| Increase (Decrease) in Cash and Cash Equivalents |
145 | 127 | (43 | ) | ||||||||
| Cash and Cash Equivalents, Beginning of Period |
580 | 453 | 496 | |||||||||
|
|
|
|||||||||||
| Cash and Cash Equivalents, End of Period |
$ | 725 | $ | 580 | $ | 453 | ||||||
|
|
|
|||||||||||
| Supplemental Disclosure of Cash Flow Information: |
||||||||||||
| Cash paid during the period for interest |
$ | 278 | $ | 230 | $ | 228 | ||||||
| Cash paid during the period for income taxes |
$ | 71 | $ | 93 | $ | 70 | ||||||
| Cash received from income tax refunds |
$ | 63 | $ | 12 | $ | 9 | ||||||
|
|
||||||||||||
The accompanying notes are an integral part of the Consolidated Financial Statements.
F-6
Table of Contents
Consolidated statements of shareholders’ equity
| (Dollars and shares in millions) |
Shares common |
Shares treasury |
Common stock |
Treasury stock |
Capital in excess of par |
Retained deficit) |
Cumulative translation adjustment |
Unamortized postretirement and postemployment adjustment |
Change in derivatives in OCI |
Change in derivatives from OCI into earnings |
Accumulated other comprehensive (loss) income |
Total shareholders’ equity |
||||||||||||||||||||||||||||||||||||
|
|
||||||||||||||||||||||||||||||||||||||||||||||||
| Balance, December 31, 2010 |
2,785 | — | $ | 3 | $ | — | $ | 2,798 | $ | (171 | ) | $ | 190 | $ | (2 | ) | $ | (5 | ) | $ | — | $ | 183 | $ | 2,813 | |||||||||||||||||||||||
|
|
|
|||||||||||||||||||||||||||||||||||||||||||||||
| Net income |
111 | 111 | ||||||||||||||||||||||||||||||||||||||||||||||
| Issuances under stock plans and management investments |
6 | 4 | 4 | |||||||||||||||||||||||||||||||||||||||||||||
| Repurchases of common stock |
3 | (3 | ) | (3 | ) | |||||||||||||||||||||||||||||||||||||||||||
| Stock-based compensation expense |
18 | 18 | ||||||||||||||||||||||||||||||||||||||||||||||
| Other equity transactions |
(8 | ) | (8 | ) | ||||||||||||||||||||||||||||||||||||||||||||
| Cumulative translation adjustments |
51 | 51 | 51 | |||||||||||||||||||||||||||||||||||||||||||||
| Postretirement & postemployment adjustments, net of tax |
(22 | ) | (22 | ) | (22 | ) | ||||||||||||||||||||||||||||||||||||||||||
| Change in derivatives in OCI , net of tax |
(6 | ) | (6 | ) | (6 | ) | ||||||||||||||||||||||||||||||||||||||||||
| Change in derivatives from OCI into earnings, net of tax |
13 | 13 | 13 | |||||||||||||||||||||||||||||||||||||||||||||
|
|
|
|||||||||||||||||||||||||||||||||||||||||||||||
| Balance, December 31, 2011 |
2,791 | 3 | $ | 3 | $ | (3 | ) | $ | 2,812 | $ | (60 | ) | $ | 241 | $ | (24 | ) | $ | (11 | ) | $ | 13 | $ | 219 | $ | 2,971 | ||||||||||||||||||||||
|
|
|
|||||||||||||||||||||||||||||||||||||||||||||||
| Net loss |
(42 | ) | (42 | ) | ||||||||||||||||||||||||||||||||||||||||||||
| Issuances under stock plans and management investments |
13 | (3 | ) | (3 | ) | |||||||||||||||||||||||||||||||||||||||||||
| Repurchases of common stock |
1 | (1 | ) | (1 | ) | |||||||||||||||||||||||||||||||||||||||||||
| Stock-based compensation expense |
19 | 19 | ||||||||||||||||||||||||||||||||||||||||||||||
| Dividends paid to shareholders, net of tax |
(1,194 | ) | (1,194 | ) | ||||||||||||||||||||||||||||||||||||||||||||
| Cumulative translation adjustments |
(49 | ) | (49 | ) | (49 | ) | ||||||||||||||||||||||||||||||||||||||||||
| Postretirement and postemployment adjustments, net of tax |
(17 | ) | (17 | ) | (17 | ) | ||||||||||||||||||||||||||||||||||||||||||
| Change in derivatives in OCI , net of tax |
3 | 3 | 3 | |||||||||||||||||||||||||||||||||||||||||||||
| Change in derivatives from OCI into earnings, net of tax |
(4 | ) | (4 | ) | (4 | ) | ||||||||||||||||||||||||||||||||||||||||||
|
|
|
|||||||||||||||||||||||||||||||||||||||||||||||
| Balance, December 31, 2012 |
2,804 | 4 | $ | 3 | $ | (4 | ) | $ | 1,634 | $ | (102 | ) | $ | 192 | $ | (41 | ) | $ | (8 | ) | $ | 9 | $ | 152 | $ | 1,683 | ||||||||||||||||||||||
|
|
||||||||||||||||||||||||||||||||||||||||||||||||
The accompanying notes are an integral part of the Consolidated Financial Statements.
F-7
Table of Contents
IMS Health Holdings, Inc.
Consolidated statements of shareholders’ equity (continued)
| (Dollars and shares in millions) |
Shares common |
Shares treasury |
Common stock |
Treasury stock |
Capital in excess of par |
Retained deficit) |
Cumulative translation adjustment |
Unamortized postretirement and postemployment adjustment |
Change in derivatives in OCI |
Change in derivatives from OCI into earnings |
Accumulated other comprehensive (loss) income |
Total shareholders’ equity |
||||||||||||||||||||||||||||||||||||
|
|
||||||||||||||||||||||||||||||||||||||||||||||||
| Balance, December 31, 2012 |
2,804 | 4 | $ | 3 | $ | (4 | ) | $ | 1,634 | $ | (102 | ) | $ | 192 | $ | (41 | ) | $ | (8 | ) | $ | 9 | $ | 152 | $ | 1,683 | ||||||||||||||||||||||
|
|
|
|||||||||||||||||||||||||||||||||||||||||||||||
| Net income |
82 | 82 | ||||||||||||||||||||||||||||||||||||||||||||||
| Issuances under stock plans and management investments |
1 | 2 | 2 | |||||||||||||||||||||||||||||||||||||||||||||
| Repurchases of common stock |
1 | (2 | ) | (2 | ) | |||||||||||||||||||||||||||||||||||||||||||
| Stock-based compensation expense |
22 | 22 | ||||||||||||||||||||||||||||||||||||||||||||||
| Dividends paid to shareholders, net of tax |
(745 | ) | (745 | ) | ||||||||||||||||||||||||||||||||||||||||||||
| Cumulative translation adjustments |
(183 | ) | (183 | ) | (183 | ) | ||||||||||||||||||||||||||||||||||||||||||
| Postretirement and postemployment adjustments, net of tax |
24 | 24 | 24 | |||||||||||||||||||||||||||||||||||||||||||||
| Change in derivatives in OCI , net of tax |
9 | 9 | 9 | |||||||||||||||||||||||||||||||||||||||||||||
| Change in derivatives from OCI into earnings, net of tax |
(9 | ) | (9 | ) | (9 | ) | ||||||||||||||||||||||||||||||||||||||||||
|
|
|
|||||||||||||||||||||||||||||||||||||||||||||||
| Balance, December 31, 2013 |
2,805 | 5 | $ | 3 | $ | (6 | ) | $ | 913 | $ | (20 | ) | $ | 9 | $ | (17 | ) | $ | 1 | $ | — | $ | (7 | ) | $ | 883 | ||||||||||||||||||||||
|
|
||||||||||||||||||||||||||||||||||||||||||||||||
The accompanying notes are an integral part of the Consolidated Financial Statements.
F-8
Table of Contents
Notes to consolidated financial statements
Note 1. Basis of presentation
IMS Health Holdings, Inc. (the “Company”) is a leading global information and technology services company providing clients in the healthcare industry with comprehensive solutions to measure and improve their performance. The Company has one of the largest and most comprehensive collections of healthcare information in the world, spanning sales, prescription and promotional data, medical claims, electronic medical records and social media data. The Company standardizes, organizes, structures and integrates this data by applying its sophisticated analytics and leveraging its global technology infrastructure to help its clients run their organizations more efficiently and make better decisions to improve their operational and financial performance. The Company has a presence in over 100 countries, and generated 63% of its 2013 revenue from outside the United States.
The Company serves key healthcare organizations and decision makers around the world, spanning the breadth of life science companies, including pharmaceutical, biotechnology, consumer health and medical device manufacturers, as well as distributors, providers, payers, government agencies, policymakers, researchers and the financial community. The Company’s information and technology services offerings, which it has developed with significant investment over its 60-year history, are deeply integrated into its clients’ workflow.
On October 23, 2009, the Company was formed as Healthcare Technology Holdings, Inc. by investment entities affiliated with TPG Capital, L.P., CPP Investment Board Private Holdings Inc. and Leonard Green & Partners, L.P (collectively, the “Sponsors”). On December 20, 2013, the Company changed its name to IMS Health Holdings, Inc. On February 26, 2010, the Company acquired 100% of the outstanding shares of IMS Health Incorporated (“IMS Health” or “predecessor entity”) through its wholly owned subsidiary Healthcare Technology Acquisition, Inc. (the “Merger”). The Company was formed for the purpose of consummating the Merger with IMS Health and had no operations from inception other than its investment in IMS Health and its subsidiaries and costs incurred associated with its formation and the Merger.
The Consolidated Financial Statements have been prepared in conformity with generally accepted accounting principles in the United States of America (“GAAP”). All material intercompany balances and transactions have been eliminated in the Consolidated Financial Statements.
Note 2. Summary of significant accounting policies
Consolidation. The Consolidated Financial Statements of the Company include the accounts of the Company, its subsidiaries and investments in which the Company has control. Intercompany accounts and transactions are eliminated in consolidation. The Company recognizes in the income statement any gains or losses related to investments accounted for under the equity method.
Cash and cash equivalents and restricted cash. Cash and cash equivalents include primarily time and demand deposits in the Company’s operating bank accounts. The Company considers all highly liquid investments with an original maturity of 90 days or less at the time of purchase to be cash equivalents. Restricted cash consists of amounts not immediately available.
F-9
Table of Contents
Property, plant and equipment. Buildings, machinery and equipment are recorded at cost and depreciated over their estimated useful lives to their salvage values using the straight-line method. Leasehold improvements are recorded at cost and amortized on a straight-line basis over the shorter of the term of the lease or the estimated useful life of the improvement. See Note 13.
Computer software. Direct costs incurred in the development of the Company’s internal-use computer software are capitalized. Costs are capitalized from completion of the preliminary project stage and when it is considered probable that the software will be used to perform its intended function, up until the time the software is placed into service. Once placed into service, the software is amortized generally over a period of three to seven years. The Company periodically reviews the unamortized capitalized costs of its computer software to assess for any potential impairment. The Company recognizes immediately any impairment losses on software as a result of its review. Research and development costs are expensed in the periods in which they are incurred.
Business combinations. Business combinations are accounted for using the acquisition method, and accordingly, the identifiable assets acquired, the liabilities assumed, and any non-controlling interest in the acquiree are recorded at their estimated fair values on the date of acquisition.
Goodwill. Goodwill represents the excess purchase price over the fair value of identifiable net assets of businesses acquired, and is not amortized. The Company reviews the recoverability of goodwill annually (or based on any triggering event) by comparing the estimated fair values (based on discounted cash flow analysis) of reporting units with their respective net book values. If the carrying amount of the reporting unit exceeds its fair value, the goodwill impairment loss is measured as the excess of the carrying value of goodwill over its fair value. The Company completed its annual impairment tests in 2013, 2012 and 2011 and no goodwill impairment charges were recorded. See Note 5.
Other long-lived assets. The Company reviews the recoverability of its long-lived assets and identifiable intangibles held and used whenever events or changes in circumstances indicate that the carrying amount of an asset may not be recoverable. In general, the assessment of possible impairment is based on the Company’s ability to recover the carrying value of the asset from the undiscounted expected future cash flows of the asset. If the future cash flows are less than the carrying value of such asset, an impairment charge is recognized for the difference between the estimated fair value and the carrying value. In addition, the Company also reviews its indefinite-lived intangible assets on an annual basis.
Revenue recognition. The Company recognizes revenue when the following criteria have been met: 1) persuasive evidence of an arrangement exists; 2) delivery has occurred or services have been rendered; 3) the seller’s price to the buyer is fixed or determinable; and 4) collectibility is reasonably assured.
The Company offers various information offerings developed to meet its clients’ needs by using data secured from a worldwide network of suppliers. The Company’s revenue arrangements may include multiple elements. A typical information offerings arrangement (primarily under fixed-price contracts) may include an ongoing subscription-based deliverable for which revenue is recognized ratably as earned over the contract period, and/or a one-time delivery of data offerings for which revenue is recognized upon delivery, assuming all other criteria are met. These deliverables qualify as separate units of accounting as each has value on a standalone basis
F-10
Table of Contents
to the client, objective and reliable evidence of fair value for any undelivered item(s) exists, and where the arrangement includes a general right of return relative to the delivered item(s), delivery of the undelivered item(s) is probable and within the Company’s control. The Company allocates revenue to each element within its arrangements based upon their respective relative selling price. Fair values for these elements are based upon the normal pricing practices for these offerings when sold separately. The Company defers revenue for any undelivered elements, and recognizes revenue when the product is delivered or over the term of the agreement, in accordance with its revenue recognition policy for such element as noted above. The Company’s subscription arrangements typically have terms ranging from one to three years and are generally non-cancelable and do not contain refund-type provisions.
The Company also offers technology services offerings that enable its clients to make informed business decisions. Technology services offerings consist of a mix of small and large-scale services and consulting projects, multi-year outsourcing contracts and software licenses. These arrangements typically have terms ranging from several weeks to three years, with a majority having terms of one year or less. Revenues for services engagements where deliverables occur ratably over time are recognized on a straight-line basis over the term of the arrangement. Revenue from time and material contracts are recognized as the services are provided. Revenues from fixed price ad hoc services and consulting contracts are recognized either over the contract term based on the ratio of the number of hours incurred for services provided during the period compared to the total estimated hours to be incurred over the entire arrangement (efforts based), or upon delivery (completed contract).
The Company presents its revenues net of taxes assessed by government authorities.
Payment terms vary by client, but are typically stipulated in the contract and are generally invoiced with 30 day payment terms. The Company generally does not offer extended payment terms. Advance payments from clients are credited to Deferred revenues and reflected in Revenue as earned over the contract term. Unbilled receivables are included in Accounts receivable, net in the Consolidated Statements of Financial Position and represent revenues for products delivered or services performed that have not yet been invoiced to the client. Unbilled receivables are generally invoiced within the following month.
Operating costs of information. Operating costs of information includes costs attributable to personnel involved in production, data management and delivery, and the costs of acquiring and processing data for the Company’s information offerings.
One of the Company’s major expenditures is the cost for the data it receives from suppliers. After receipt of the raw data and prior to the data being available for use in any part of the business, the Company is required to transform the raw data into useful information through a series of comprehensive processes. These processes involve significant employee costs and data processing costs.
Costs associated with purchases are deferred within work-in-process inventory and recognized as expense as the corresponding data product revenue is recognized, generally over a thirty to sixty day period.
Direct and incremental costs of technology services. Direct and incremental costs of technology services include costs of staff directly involved with delivering technology-related, consulting and services generating offerings and engagements, related accommodations and the costs of data purchased specifically for technology services engagements. Direct and incremental costs of
F-11
Table of Contents
technology services do not include an allocation of direct costs of data that are included in operating costs of information. Although the Company’s data, the costs of which are included in Operating costs of information, is used in multiple client solutions across different offerings within both information and technology services, the Company does not have a meaningful way to allocate the direct cost of the data between information and technology services. As such, the direct and incremental costs of technology services do not reflect the total costs incurred to deliver technology services engagements.
Pensions and other post retirement benefits. The Company provides a number of retirement benefits to its employees, including defined benefit pension plans and postretirement medical plans. The determination of benefit obligations and expense is based on actuarial models. In order to measure benefit costs and obligations using these models, critical assumptions are made with regard to the discount rate, expected return on plan assets, cash balance crediting rate, lump sum conversion rate and the assumed rate of compensation increases. In addition, retiree medical care cost trend rates are a key assumption used exclusively in determining costs for the Company’s postretirement health care and life insurance benefit plans. Management reviews these critical assumptions at least annually. Other assumptions involve demographic factors such as the turnover, retirement and mortality rates. Management reviews these assumptions periodically and updates them when its experience deems it appropriate to do so.
The discount rate is the rate at which the benefit obligations could be effectively settled and is determined annually by management. For U.S. plans, the discount rate is based on results of a modeling process in which the plans’ expected cash flow (determined on a projected benefit obligation basis) is matched with spot rates developed from a yield curve comprised of high-grade (Moody’s Aa and above, or Standard and Poor’s AA and above) non-callable corporate bonds to develop the present value of the expected cash flow, and then determining the single rate (discount rate) which when applied to the expected cash flow derives that same present value. In the U.K. specifically, the discount rate is set based on the yields on a universe of approximately 120 high quality (Aa rated) non-callable corporate bonds denominated in U.K. Sterling, appropriate to the duration of Plan liabilities. For the other non-U.S. plans, the discount rate is based on the current yield of an index of high quality corporate bonds. At December 31, 2013, the discount rate ranged from 2.9%—4.7% compared to 3.8% at December 31, 2012 for its U.S. pension plans and postretirement benefit plan. The discount rate for its U.K. pension plan was decreased to 4.6% from 4.7% at December 31, 2012. The U.S. and U.K. plans represent 96% of the consolidated benefit obligation as of December 31, 2013. The discount rate in other non-U.S. countries decreased, where the range of applicable discount rates at December 31, 2013 was 0.9%—6.2%.
Under the U.S. qualified retirement plan, participants have a notional retirement account that increases with pay and investment credits. The rate used to determine the investment credit (cash balance crediting rate) varies monthly and is equal to 1/12th of the yield on 30-year U.S. Government Treasury Bonds, with a minimum of 0.25%. At retirement, the account is converted to a monthly retirement benefit.
In selecting an expected return on plan asset assumption, the Company considers the returns being earned by each plan investment category in the fund, the rates of return expected to be available for reinvestment and long-term economic forecasts for the type of investments held by the plan. The expected return on plan assets for the U.S. pension plans was 8.0% at January 1, 2014 and January 1, 2013. Outside the U.S., the range of applicable expected rates of return was 1.0%—6.5% as of January 1, 2014 and January 1, 2013. The actual return on plan assets will vary
F-12
Table of Contents
from year to year versus this assumption. The Company believes it is appropriate to use long-term expected forecasts in selecting the expected return on plan assets. As such, there can be no assurance that the Company’s actual return on plan assets will approximate the long-term expected forecasts. The expected return on assets (“EROA”) was $29 million and $27 million and the actual return on assets was $68 million and $44 million for the years ended December 31, 2013 and 2012, respectively. While the Company believes that the assumptions used are reasonable, differences in actual experience or changes in assumptions may materially affect its pension and postretirement obligations and future expense.
The Company utilizes a corridor approach to amortizing unrecognized gains and losses in the pension and postretirement plans. Amortization occurs when the accumulated unrecognized net gain or loss balance exceeds the criterion of 10% of the larger of the beginning balances of the projected benefit obligation or the market-related value of the plan assets. The excess unrecognized gain or loss balance is then amortized using the straight-line method over the average remaining service-life of active employees expected to receive benefits. At December 31, 2013, the weighted-average remaining service-life of active employees was 22.15 years.
At December 31, 2013, the fair value of assets exceeded the projected benefit obligation of the Company’s pension plans by $12 million.
Additional information on pension and other postretirement benefit plans is contained in Note 8.
Foreign currency. The Company has significant investments in non-U.S. countries. Therefore, changes in the value of foreign currencies affect the Company’s Consolidated Financial Statements when translated into U.S. dollars. For all operations outside the U.S. where the Company has designated the local currency as the functional currency, assets and liabilities are translated using end-of-period exchange rates; revenues, expenses and cash flows are translated using average rates of exchange prevailing during the period the transactions occurred. Translation gains and losses are included as an adjustment to the accumulated other comprehensive income (loss) (“AOCI”) component of Shareholders’ Equity. In addition, gains and losses from foreign currency transactions, such as those resulting from the settlement and revaluation of third-party and intercompany foreign receivables and payables, are included in the determination of net (loss) income.
For operations in countries that are considered to be highly inflationary or where the U.S. dollar is designated as the functional currency, monetary assets and liabilities are remeasured using end-of-period exchange rates, whereas non-monetary accounts are remeasured using historical exchange rates, and all remeasurement and transaction adjustments are recognized in Other loss, net.
Income taxes. The Company operates in more than 100 countries around the world and its earnings are taxed at the applicable income tax rate in each of those countries. The Company provides for income taxes utilizing the asset and liability method of accounting for income taxes. Under this method, deferred income taxes are recorded to reflect the tax consequences in future years of differences between the tax basis of assets and liabilities and their financial reporting amounts at each balance sheet date, based on enacted tax laws and statutory tax rates applicable to the periods in which the differences are expected to affect taxable income. If it is determined that it is more likely than not that future tax benefits associated with a deferred tax asset will not be realized, a valuation allowance is provided. In the event the Company was to determine that it would be able to realize its deferred tax assets in the future in excess of its net recorded
F-13
Table of Contents
amount, an adjustment to the deferred tax asset would increase income in the period such determination was made. Likewise, should the Company determine that it would not be able to realize all or part of its net deferred tax asset in the future, an adjustment to the deferred tax asset would be charged to income in the period such determination was made. The effect on deferred tax assets and liabilities of a change in the tax rates is recognized in income in the period that includes the enactment date. The Company recognizes interest and penalties related to unrecognized tax benefits in income tax expense.
Stock-based compensation. The Company maintains a stock incentive plan, which provides for the grant of stock options, stock appreciation rights, restricted stock, unrestricted stock, restricted stock units, and/or performance awards to key employees and directors, consultants, and advisors to the Company as determined by the plan administrator. The Company is required to estimate the fair value of share-based payment awards on the date of grant using an option-pricing model. For performance-based awards, stock-based compensation expense is adjusted over time based on the Company’s assessment of the probability of achieving the financial targets. The value of the portion of the award that is ultimately expected to vest is recognized as expense either on a straight-line basis over the requisite service period of the award or on a graded vesting basis (performance-based awards) in the Company’s Consolidated Statements of Comprehensive Income. As the stock-based compensation is based on awards ultimately expected to vest, it has been reduced for estimated forfeitures. The Company is required to estimate the forfeitures at the time of grant and revise, if necessary, in subsequent periods if actual forfeitures differ from those estimates. See Note 9 for additional information.
Computation of net income (loss) per share. Basic net income (loss) per share is computed using the weighted-average number of common shares outstanding during the period. Diluted net income (loss) per share is computed, when the result is dilutive, using the weighted-average number of common shares and dilutive potential common shares outstanding during the period. Dilutive potential common shares primarily consist of employee stock options and restricted stock units.
Employee equity share options, restricted stock units and similar equity instruments granted by the Company are treated as potential common shares outstanding in computing diluted earnings per share. Diluted shares outstanding include restricted stock units and the dilutive effect of in-the-money options which is calculated based on the average share price for each fiscal period using the treasury stock method. Under the treasury stock method, the amount the employee must pay for exercising stock options, the amount of compensation cost for future service that the Company has not yet recognized, and the amount of benefits that would be recorded in additional paid-in capital when the award becomes deductible for tax purposes are assumed to be used to repurchase shares.
Treasury stock. The Company records treasury stock purchases under the cost method. Upon reissuance of treasury stock, amounts in excess of the acquisition cost are credited to additional paid in capital. If the Company reissues treasury stock at an amount below its acquisition cost and additional paid in capital associated with prior treasury stock transactions is insufficient to cover the difference between the acquisition cost and the reissue price, this difference is recorded against retained earnings.
Legal costs. Legal costs are expensed as incurred.
Reportable segments. The Company’s operations consist of one reportable segment, which represents management’s view of the Company’s operations based on its management and internal reporting structure.
F-14
Table of Contents
Use of estimates. The preparation of financial statements and related disclosures in accordance with generally accepted accounting principles in the U.S. requires management to make estimates and assumptions that affect the reported amounts of assets and liabilities, revenues and expenses and the related disclosure of contingent assets and liabilities. On an ongoing basis, the Company evaluates its estimates. The most significant estimates relate to allowances, depreciation of fixed assets including salvage values, carrying value of goodwill and intangible assets, provision for income taxes and tax assets and liabilities, reserves for severance, pensions and reserves for employee benefits, stock-based compensation, contingencies and litigation. The Company bases its estimates on historical experience and on various other assumptions that are believed to be reasonable under the circumstances, the results of which form the basis for making judgments about the carrying values of assets and liabilities that are not readily apparent from other sources. The accounting estimates used in the preparation of the Company’s Consolidated Financial Statements will change as new events occur, as more experience is acquired, as additional information is obtained and as the Company’s operating environment changes. Actual results could vary from the estimates and assumptions used in the preparation of the Consolidated Financial Statements.
Reclassifications. In 2013, the Company made some changes to its geographic reporting classifications to move some functions from corporate and other to the geographic regions and as a result, reclassifications of prior years’ geographic financial information were made to conform to the current year presentation. The reclassifications did not change previously reported consolidated results of operations or financial position. See Note 15.
Subsequent events. The Company has evaluated transactions that occurred through the issuance of these financial statements, February 13, 2014, for purposes of disclosure of subsequent events.
Note 3. Summary of recent accounting pronouncements
In July 2013, the Financial Accounting Standards Board (“FASB”) determined that an unrecognized tax benefit should be presented as a reduction to a deferred tax asset for a net operating loss (“NOL”) carryforward or other tax credit carryforward, excluding certain exceptions. The guidance is consistent with the Company’s existing practices and is effective for the Company’s interim and annual periods beginning January 1, 2014. The Company does not believe the adoption of this guidance will have a material impact on its financial results.
In March 2013, the FASB issued amendments to address the accounting for the cumulative translation adjustment when a parent either sells a part or all of its investment in a foreign entity or no longer holds a controlling financial interest in a subsidiary or group of assets that is a nonprofit activity or a business within a foreign entity. The amendments are effective for the Company prospectively for fiscal years beginning after December 15, 2013, with early adoption permitted. The adoption of this guidance is not expected to have a material impact on the Company’s financial results.
In February 2013, the FASB amended existing guidance by requiring companies to present information about reclassification adjustments from AOCI in their financial statements in a single note or on the face of the financial statements. The amendments are effective for the Company prospectively for reporting periods beginning after December 15, 2012, with early adoption permitted. As these amendments required only additional disclosure, adoption did not have a material impact on the Company’s financial results.
F-15
Table of Contents
Note 4. Acquisitions and dispositions
The Merger
On February 26, 2010 (the “Merger Date”), the Company completed its acquisitions of 100% of the outstanding shares of IMS Health for $22.00 in cash, without interest and less any applicable withholding taxes. The aggregate purchase price paid for all equity securities of IMS Health was approximately $4.2 billion. The purchase price was funded by the incurrence of new debt, equity financing from the Sponsors, members of the Company’s management and certain other indirect investors and cash of IMS Health.
Merger-related costs
The Company incurred approximately $214 million of original issue discount and fees and expenses related to the issuance of debt in order to fund the merger. Approximately $140 million was reflected as a reduction to long-term debt and approximately $74 million was included in Other assets in the Consolidated Statements of Financial Position and is being amortized over the term of the debt to which they relate (see Note 7).
The Company incurred additional merger-related costs which were recorded in Merger costs in the Consolidated Statements of Comprehensive (Loss) Income of $2 million and $23 million for the years ended December 31, 2012 and 2011, which were for employment contract related payments. There were no merger-related costs incurred in 2013.
Acquisitions
The Company makes acquisitions in order to expand its products, services and geographic reach. During the year ended December 31, 2013, the Company completed ten acquisitions; Vedere Group Limited (Australia), Appature, Inc. (U.S.), Semantelli, LLC (U.S.), 360 Vantage, LLC (U.S.), Incential Software, Inc. (U.S.), Diversinet Corp. (Canada), the consumer health business of Nielsen Holdings N.V. (Europe), HCM-BIOS (France), Pygargus AB (Sweden) and Amundsen Group, Inc. (U.S.) to strengthen our product offerings. The total cost for these acquisitions was approximately $129 million. The Company incurred approximately $10 million of acquisition-related costs, which are expensed as incurred and recorded in Selling and administrative expense, exclusive of depreciation and amortization. These business combinations were accounted for under the acquisition method of accounting, and as such, the aggregate purchase prices were allocated on a preliminary basis to the assets acquired and liabilities assumed based on estimated fair values as of the closing dates. The purchase price allocations will be finalized after the completion of the valuation of certain intangible assets and any adjustments to the preliminary purchase price allocations are not expected to have a material impact on the Company’s results of operations. The Condensed Consolidated Financial Statements include the results of the acquisitions subsequent to each of their closings. Had these acquisitions occurred as of January 1, 2012, the impact on the Company’s results of operations would not have been material. In connection with these acquisitions, the Company recorded goodwill of approximately $124 million, of which approximately $46 million is deductible for tax purposes, computer software of $16 million (weighted-average amortization period of 4.4 years), and intangible assets of approximately $37 million. The intangible assets acquired were comprised of client relationships of $20 million (weighted-average amortization period of 10.0 years), databases of $1 million (weighted-average amortization period of 2.0 years) and trade names and other of $16 million (weighted-average amortization period of 3.7 years).
F-16
Table of Contents
During the year ended December 31, 2012, the Company completed nine acquisitions; PharmARC Analytical Solutions Private Limited (India), Pharmadata s.r.o. (Europe), Suomen Lääkedata Oy (Europe), DecisionView, Inc. (U.S.), Pharma Ventures Limited (Europe), Tar Heel Trading Company, LLC (U.S.), Life Science Partners Pty Limited (Australia), Pharmexpert Group (Europe) and Marina Consulting, LLC (U.S.) to strengthen our product offerings. The total cost for these acquisitions was approximately $77 million. The Company incurred approximately $11 million of acquisition-related costs, which are expensed as incurred and recorded in selling and administrative expense, exclusive of depreciation and amortization. All of the business combinations were accounted for under the acquisition method of accounting, and as such, the aggregate purchase price was allocated to the assets acquired based on estimated fair values as of the closing date. The Consolidated Financial Statements include the results of the acquisitions subsequent to each of their closings. Had these acquisitions occurred as of January 1, 2011, the impact on the Company’s results of operations would not have been material. In connection with these acquisitions, the Company recorded goodwill of approximately $30 million, of which approximately $10 million is deductible for tax purposes, computer software of $15 million (weighted-average amortization period of 4.9 years) and intangible assets of approximately $29 million. The intangible assets acquired were comprised of client relationships of $24 million (weighted-average amortization period of 10 years) and databases of $5 million (weighted-average amortization period of 4.2 years).
During the year ended December 31, 2011, the Company completed three acquisitions; Med-Vantage, Inc. in the U.S., Ardentia Limited in Europe and SDI Health LLC in the U.S. The total cost for the three acquisitions was approximately $380 million. The Company incurred approximately $13 million of acquisition-related costs, which are expensed as incurred and recorded in selling and administrative expense, exclusive of depreciation and amortization. The acquisitions were accounted for under the purchase method of accounting, and as such, the aggregate purchase price was allocated to the assets acquired based on fair values. The Consolidated Financial Statements include the results of the acquisitions subsequent to each of their closings. Had these acquisitions occurred as of January 1, 2010, the impact on the Company’s results of operations would not have been material. In connection with these acquisitions, the Company recorded goodwill of approximately $203 million, of which approximately $199 million is deductible for tax purposes, computer software of $21 million (weighted-average amortization period of 5 years) and intangible assets of approximately $136 million. The intangible assets acquired were comprised of client relationships of $87 million (weighted-average amortization period of 16 years), databases of $35 million (weighted-average amortization period of 5 years) and trade names and other of $14 million (weighted-average amortization period of 9.5 years).
Under the terms of certain acquisition-related purchase agreements, the Company may be required to pay additional amounts as contingent consideration based on the achievement of certain financial performance related metrics, ranging from $0 to $100 million through 2017. The Company’s contingent consideration recorded on the balance sheet was approximately $65 million and $23 million at December 31, 2013 and 2012, respectively. The fair value measurement of this contingent consideration is classified within Level 3 of the fair value hierarchy (see Note 7) and reflects the Company’s own assumptions in measuring fair values using the income approach. In developing these estimates, the Company considered certain performance projections, historical results and industry trends.
F-17
Table of Contents
Dispositions
In connection with the acquisition of SDI Health LLC (“SDI”) in 2011, the Federal Trade Commission (“FTC”) required the Company to divest a portion of the acquired business. As a result, the Company sold a portion of the business to a third party and received $16 million in 2012. In connection with this divestiture, the Company also received approximately $9 million due from the former SDI shareholders.
In 2011, the Company classified a building in the U.S. as held for sale. As a result of this classification, the Company recorded a $2 million impairment loss based on the then estimated fair value of the building. The sale of the facility was completed in January 2012 and the Company received net proceeds of approximately $9 million.
Note 5. Goodwill and intangible assets
Goodwill and intangible assets that have indefinite useful lives are not amortized and are tested at least annually (or based on any triggering event) for impairment.
The following table sets forth changes in the Company’s goodwill for the years ended December 31, 2013 and 2012.
| (Dollars in millions) | Goodwill | |||
|
|
||||
| Balance at December 31, 2011 |
$ | 3,591 | ||
| Goodwill assigned in acquisition purchase price allocations (see Note 4) |
30 | |||
| Foreign currency translation adjustments |
(38 | ) | ||
|
|
|
|||
| Balance at December 31, 2012 |
$ | 3,583 | ||
| Goodwill assigned in acquisition purchase price allocations (see Note 4) |
124 | |||
| Foreign currency translation adjustments and other |
(134 | ) | ||
|
|
|
|||
| Balance at December 31, 2013 |
$ | 3,573 | ||
|
|
||||
Intangible assets that have finite useful lives are amortized using the straight-line method over periods ranging from five to twenty years. Intangible asset amortization expense was $287 million, $291 million and $287 million during the years ended December 31, 2013, 2012 and 2011, respectively. At December 31, 2013 and 2012, intangible assets were primarily comprised of databases, client relationships and trade names. The gross carrying amounts and related accumulated amortization of these intangibles are listed in the following table:
| December 31, 2013 | December 31, 2012 | |||||||||||||||||||
| (Dollars in millions) | Gross carrying amount |
Accumulated amortization |
Weighted avg. amortization period (years) |
Gross carrying |
Accumulated amortization |
|||||||||||||||
|
|
||||||||||||||||||||
| Databases |
$ | 725 | $ | 549 | 1.3 | $ | 727 | $ | 405 | |||||||||||
| Client Relationships |
2,152 | 491 | 14.3 | 2,225 | 375 | |||||||||||||||
| Trade Names and Other (Finite-Lived) |
151 | 31 | 14.6 | 149 | 22 | |||||||||||||||
| Trade Names (Indefinite-Lived) |
560 | — | N/A | 574 | — | |||||||||||||||
|
|
|
|||||||||||||||||||
| Total Intangible Assets |
$ | 3,588 | $ | 1,071 | 11.1 | $ | 3,675 | $ | 802 | |||||||||||
|
|
||||||||||||||||||||
F-18
Table of Contents
Based on current estimated useful lives, amortization expense associated with intangible assets at December 31, 2013 is estimated to be as follows:
| (Dollars in millions) Year ended December 31, |
Amortization expense |
|||
|
|
||||
| 2014 |
$ | 283 | ||
| 2015 |
168 | |||
| 2016 |
146 | |||
| 2017 |
129 | |||
| 2018 |
100 | |||
| Thereafter |
1,131 | |||
|
|
||||
Note 6. Severance, impairment and other charges
The Company records a liability for significant costs associated with restructuring activities, including employee severance and related benefits, lease termination costs, asset impairments and other qualifying exit costs, when such costs are deemed probable and estimable. Employee severance benefits are calculated pursuant to the terms of established employee protection plans, in accordance with local statutory minimum requirements or individual employee contracts, as applicable. These charges are included in Severance, impairment and other charges, a component of operating income, on the Consolidated Statements of Comprehensive (Loss) Income.
Estimated future funding requirements for the Company related to severance, impairment and other charges are $22 million in fiscal 2014, $1 million in fiscal 2015 and $1 million after 2018.
2013
In December 2013, as a result of ongoing cost reduction efforts, the Company recorded a pre-tax severance charge of $12 million consisting of global workforce reductions to streamline the Company’s organization (the “2013 Plan”). Cash outlays related to the 2013 Plan were de minimis through December 31, 2013. The Company expects that cash outlays related to the 2013 Plan will be substantially complete by the end of 2014.
Also in 2013, the Company recorded charges of $10 million, $3 million of which was recorded in the fourth quarter of 2013, related to impaired leases for properties in the U.S. and contract-related charges for which the Company will not realize any future economic benefits.
F-19
Table of Contents
2012
In December 2012, as a result of ongoing cost reduction efforts, the Company implemented a restructuring plan (the “2012 Plan”) and recorded a pre-tax severance charge of $23 million consisting of global workforce reductions to streamline the Company’s organization. In 2013, $6 million of severance accruals were reversed due to the favorable settlement of required termination benefits and strategic business changes. The Company expects that cash outlays related to the 2012 Plan will be substantially complete by the end of the second quarter of 2014.
| (Dollars in millions) | Severance related reserves |
|||
|
|
||||
| Balance at December 31, 2012 |
$ | 23 | ||
| 2013 utilization |
(11 | ) | ||
| 2013 reversal |
(6 | ) | ||
|
|
|
|||
| Balance at December 31, 2013 |
$ | 6 | ||
|
|
||||
During the fourth quarter of 2012, the Company recorded impairment charges of $2 million related to the write-down of certain assets to their net realizable values, $3 million for contract-related charges for which the Company will not realize any future economic benefits and $1 million related to a lease impairment for property in the U.S.
Also in 2012, the Company recorded $8 million of impairment charges related to leased facilities in the U.S. and Europe and $21 million of impairment charges related to the write-down of certain assets to their net realizable values and $1 million of contract-related charges for which the Company will not realize any future economic benefits.
2011
In the fourth quarter of 2011, as a result of classifying a building in the U.S. as held for sale, the Company recorded an impairment charge of $2 million. Also in 2011, the Company recorded $10 million in contract-related charges related to a cash payment made to a vendor for which the Company did not realize any future economic benefits.
F-20
Table of Contents
2010
In December 2010, the Company implemented a multi-year restructuring plan and recorded a pre-tax severance, impairment and other charge totaling approximately $50 million related to ongoing cost reduction efforts, including workforce reductions to streamline the Company’s organization, the elimination of certain regional headquarter functions and asset impairments (the “2010 Plan”). During December 2011, the Company recorded an incremental charge of $19 million; bringing the total charge under the 2010 Plan to $69 million. Also during 2011, the Company reversed the facility exit portion of the 2010 Plan as the Company was able to successfully assign the related lease to a third party. During the fourth quarter of 2012, the Company reversed approximately $10 million of severance accruals for the 2010 Plan due to the favorable settlement of required termination benefits and strategic business changes. Cash outlays related to severance benefits for the 2010 Plan were substantially complete by the end of 2013.
| (Dollars in millions) | Severance related reserves |
Facility exit charges |
Total | |||||||||
|
|
||||||||||||
| Balance at December 31, 2010 |
$ | 48 | $ | 1 | $ | 49 | ||||||
| 2011 utilization |
(26 | ) | — | (26 | ) | |||||||
| 2011 reversal |
— | (1 | ) | (1 | ) | |||||||
| Q4 2011 charge |
19 | — | 19 | |||||||||
| Currency translation adjustments |
1 | — | 1 | |||||||||
|
|
|
|||||||||||
| Balance at December 31, 2011 |
$ | 42 | $ | — | $ | 42 | ||||||
| 2012 utilization |
(26 | ) | — | (26 | ) | |||||||
| Q4 2012 reversal |
(10 | ) | — | (10 | ) | |||||||
|
|
|
|||||||||||
| Balance at December 31, 2012 |
$ | 6 | $ | — | $ | 6 | ||||||
| 2013 utilization |
(5 | ) | — | (5 | ) | |||||||
|
|
|
|||||||||||
| Balance at December 31, 2013 |
$ | 1 | $ | — | $ | 1 | ||||||
|
|
||||||||||||
Additionally, during the fourth quarter of 2012, the Company reversed $1 million of a severance charge related to an acquisition recorded in 2010 as a result of the favorable settlement of termination benefits.
Note 7. Financial instruments
Foreign exchange risk management
The Company transacts business in more than 100 countries and is subject to risks associated with changing foreign exchange rates. The Company’s objective is to reduce earnings and cash flow volatility associated with foreign exchange rate changes. Accordingly, the Company enters into foreign currency forward contracts to minimize the impact of foreign exchange movements on EBITDA, and to hedge non-U.S. Dollar anticipated royalties. It is the Company’s policy to enter into foreign currency transactions only to the extent necessary to meet its objectives as stated above. The Company does not enter into foreign currency transactions for investment or speculative purposes. The principal currencies hedged are the Euro, the Japanese Yen, the British Pound, the Swiss Franc and the Canadian Dollar.
For derivatives designated as hedges, the Company assesses, both at the inception of the hedge and on an ongoing basis, whether the derivatives are highly effective in offsetting changes in fair
F-21
Table of Contents
values or cash flows of hedged items. If it is determined that a derivative ceases to be highly effective as a hedge, the Company will discontinue hedge accounting with respect to that derivative prospectively. When it is probable that a hedged forecasted transaction will not occur, the Company discontinues hedge accounting for the affected portion of the forecasted transaction, and reclassifies gains or losses that were accumulated in AOCI to earnings in Other loss, net on the Consolidated Statements of Comprehensive (Loss) Income.
The impact of foreign exchange on pre-tax losses was net losses of $59 million, $26 million and $6 million for the years ended December 31, 2013, 2012 and 2011, respectively. These losses included foreign exchange (losses) gains of $(40) million, $(18) million and $3 million, respectively, related to the translation of non-functional currency debt. These foreign exchange losses were recorded in Other loss, net, in the Consolidated Statements of Comprehensive (Loss) Income. Additionally, Other loss, net included (losses) gains of $(28) million, $(13) million and $16 million related to the revaluation of other non-functional currency assets and liabilities for the years ended December 31, 2013, 2012 and 2011, respectively. Included in the $28 million revaluation loss in 2013 was a $14 million charge resulting from the devaluation of the Venezuelan Bolívars, as further described below.
At December 31, 2013, the Company’s notional amount of forward contacts designated as cash flow and EBITDA hedges was $202 million and $219 million, respectively. These foreign exchange forward contracts outstanding have various expiration dates through December 2014 relating to non-U.S. Dollar anticipated royalties and EBITDA. Foreign exchange forward contracts are recorded at estimated fair value. The estimated fair values of the forward contracts are based on quoted market prices.
Unrealized and realized gains and losses on the contracts hedging EBITDA do not qualify for hedge accounting, and therefore are not deferred and are included in the Consolidated Statements of Comprehensive (Loss) Income in Other loss, net.
Unrealized gains and losses on the contracts hedging non-U.S. Dollar anticipated royalties qualify for hedge accounting, and are therefore deferred and included in AOCI.
| Fair value of derivative instruments | ||||||||||||||||
| Asset derivatives | Liability derivatives | |||||||||||||||
| As of December 31, | ||||||||||||||||
| (Dollars in millions) | 2013 | 2012 | 2013 | 2012 | ||||||||||||
|
|
||||||||||||||||
| Derivatives designated as hedging instruments |
||||||||||||||||
| Foreign Exchange Contracts(1) |
$ | 6 | $ | 5 | $ | 4 | $ | 2 | ||||||||
| Derivatives not designated as hedging instruments |
||||||||||||||||
| Foreign Exchange Contracts(1) |
3 | 3 | 11 | 9 | ||||||||||||
| Interest Rate Swaps(2) |
— | — | 12 | 21 | ||||||||||||
|
|
|
|||||||||||||||
| Total Derivatives |
$ | 9 | $ | 8 | $ | 27 | $ | 32 | ||||||||
|
|
||||||||||||||||
| (1) | Included in Current Assets and Current Liabilities in the Consolidated Statements of Financial Position. |
| (2) | Included in Other liabilities in the Consolidated Statements of Financial Position. |
F-22
Table of Contents
| (Dollars in millions) | Effect of derivatives on financial performance | |||||||||||||||||||||||||||
|
|
||||||||||||||||||||||||||||
| Derivatives in cash flow hedging relationships |
Amount of gain/(loss) on derivatives |
Location of gain/(loss) reclassified from AOCI into earnings |
Amount of gain/(loss) from AOCI into earnings |
|||||||||||||||||||||||||
|
|
||||||||||||||||||||||||||||
| Year ended December 31, | Year ended December 31, | |||||||||||||||||||||||||||
| 2013 | 2012 | 2011 | 2013 | 2012 | 2011 | |||||||||||||||||||||||
|
|
||||||||||||||||||||||||||||
| Foreign Exchange Contracts |
$ | 13 | $ | 5 | $ | (9 | ) | Other Loss, net | $ | 14 | $ | 6 | $ | (20 | ) | |||||||||||||
|
|
||||||||||||||||||||||||||||
The pre-tax gain (loss) recognized in earnings on derivatives not designated as hedging instruments was as follows:
| Year Ended December 31, | ||||||||||||
| (Dollars in millions) | 2013 | 2012 | 2011 | |||||||||
|
|
||||||||||||
| Foreign Exchange Contracts(1) |
$ | (5 | ) | $ | (4 | ) | $ | (5 | ) | |||
| Interest Rate Swaps and Caps(2) |
(1 | ) | (5 | ) | (17 | ) | ||||||
|
|
|
|||||||||||
| Total Derivatives not Designated as Hedging Instruments |
$ | (6 | ) | $ | (9 | ) | $ | (22 | ) | |||
|
|
||||||||||||
| (1) | Included in Other loss, net. |
| (2) | Included in Interest expense. |
Changes in the fair value of derivatives that are designated as a cash flow hedges are recorded in AOCI to the extent effective and reclassified into earnings in the same period or periods during which the transaction hedged by that derivative also affects earnings. The Company expects approximately $2 million of pre-tax unrealized gain related to our foreign exchange contracts included in AOCI at December 31, 2013 to be reclassified into earnings within the next twelve months.
Fair value disclosures
At December 31, 2013, the Company’s financial instruments included cash, cash equivalents, restricted cash, short-term investments, receivables, accounts payable and debt. At December 31, 2013, the fair values of cash, cash equivalents, restricted cash, short-term investments, receivables and accounts payable approximated carrying values due to the short-term nature of these instruments. Short-term investments consist of government bond funds in 2013 and 2012 and time deposits in 2012 with maturities greater than ninety days, but less than one year. At December 31, 2013 and 2012, the fair value of total debt approximated $5,280 million and $4,498 million, respectively, as determined under Level 2 measurements based on quoted prices for these financial instruments.
The Company is subject to authoritative guidance which requires a three-level hierarchy for disclosure of fair value measurements as follows:
| Level 1 — | Quoted prices in active markets for identical assets or liabilities. | |
| Level 2 — | Quoted prices for similar assets or liabilities in active markets or quoted prices for identical assets or liabilities in inactive markets; and model-derived valuations in which all significant inputs are observable in active markets. | |
| Level 3 — | Unobservable inputs reflecting management’s own assumptions about the inputs used in pricing the asset or liability. | |
F-23
Table of Contents
Recurring measurements
The following table summarizes assets and liabilities measured at fair value on a recurring basis at the dates indicated:
| Basis of fair value measurements | ||||||||||||||||
| December 31, 2013 | ||||||||||||||||
| (Dollars in millions) | Level 1 | Level 2 | Level 3 | Total | ||||||||||||
|
|
||||||||||||||||
| Assets |
||||||||||||||||
| Short-term investments |
$ | — | $ | 4 | $ | — | $ | 4 | ||||||||
| Derivatives |
— | 9 | — | 9 | ||||||||||||
|
|
|
|||||||||||||||
| Total |
$ | $ | 13 | $ | — | $ | 13 | |||||||||
|
|
|
|||||||||||||||
| Liabilities |
||||||||||||||||
| Contingent consideration |
$ | — | $ | — | $ | 65 | $ | 65 | ||||||||
| Derivatives |
— | 27 | — | 27 | ||||||||||||
|
|
|
|||||||||||||||
| Total |
$ | — | $ | 27 | $ | 65 | $ | 92 | ||||||||
|
|
||||||||||||||||
| December 31, 2012 | ||||||||||||||||
|
|
||||||||||||||||
| Assets |
||||||||||||||||
| Short-term investments |
$ | 56 | $ | 5 | $ | — | $ | 61 | ||||||||
| Derivatives |
— | 8 | — | 8 | ||||||||||||
|
|
|
|||||||||||||||
| Total |
$ | 56 | $ | 13 | $ | — | $ | 69 | ||||||||
|
|
|
|||||||||||||||
| Liabilities |
||||||||||||||||
| Contingent consideration |
$ | — | $ | — | $ | 23 | $ | 23 | ||||||||
| Derivatives |
— | 32 | — | 32 | ||||||||||||
|
|
|
|||||||||||||||
| Total |
$ | — | $ | 32 | $ | 23 | $ | 55 | ||||||||
|
|
||||||||||||||||
Derivatives consist of foreign exchange contracts and interest rate caps and swaps. The fair value of foreign exchange contracts is based on observable market inputs of spot and forward rates. See below in this Note for the fair value determination of interest rate caps and swaps.
The following table summarizes Level 3 acquisition-related contingent consideration liabilities (see Note 4) carried at fair value on a recurring basis with the use of unobservable inputs for the period indicated.
| (Dollars in millions) | Contingent consideration liabilities |
|||
|
|
||||
| Balance at 12/31/11 |
$ | 15 | ||
| New acquisitions |
9 | |||
| Changes in fair value estimates included in Selling and administrative expenses |
(1 | ) | ||
|
|
|
|||
| Balance at 12/31/12 |
$ | 23 | ||
| New acquisitions |
49 | |||
| Cash payments |
(3 | ) | ||
| Changes in fair value estimates included in Selling and administrative expenses |
(4 | ) | ||
|
|
|
|||
| Balance at 12/31/13 |
$ | 65 | ||
|
|
||||
F-24
Table of Contents
Non-recurring measurements
In 2013, the Company wrote-off the value of a cost method investment and an associated asset that was no longer in use to zero and recorded charges of $5 million, $3 million of which were recorded in Severance, impairment and other charges and $2 million of which were recorded in Other loss, net. The fair value reflects an internal review of the net realizable value of the assets and thus is a Level 3 measurement. Also, in 2013, the Company recorded an additional $3 million impairment charge for a leased facility, resulting in a fair value measurement of the liability of $9 million at December 31, 2013. The fair value was based on a third party market assessment, a Level 2 measurement.
In 2012, the Company wrote-off the value of computer software that was no longer in use to zero and recorded an impairment charge of $22 million. The fair value reflects an internal review of the net realizable value of the software and thus is a Level 3 measurement.
Devaluation of Venezuelan Bolívars
In February 2013, the Venezuelan government announced the devaluation of its currency. The official exchange rate was adjusted from 4.30 Bolívars to each U.S. Dollar to 6.30. The Company’s Swiss operating subsidiary, IMS AG, maintains certain account balances in Bolívars (mainly cash and cash equivalents). As these balances are held in a non-functional currency of IMS AG, the Company is required to mark-to-market these balances at each reporting date and reflect these movements as gains or losses in income. Additionally, since January 2010, Venezuela has been designated as hyper-inflationary, and as such, all foreign currency fluctuations are recorded in income for certain account balances at the Company’s local Venezuelan operating subsidiary. The Company recorded a pre-tax charge of approximately $14 million to Other loss, net, in 2013 related to the remeasurement of the IMS AG Venezuelan Bolívar account balances and the remeasurement of certain local Bolívar account balances.
Credit concentrations
The Company continually monitors its positions with, and the credit quality of, the financial institutions which are counterparties to its financial instruments and does not anticipate non-performance by the counterparties. In general, the Company enters into transactions only with financial institution counterparties that are large banks and financial institutions. In addition, the Company attempts to limit the amount of credit exposure with any one institution. The Company would not have realized a material loss during the year ended of December 31, 2013 in the event of non-performance by any one counterparty.
The Company maintains accounts receivable balances ($313 million and $308 million, net of allowances, at December 31, 2013 and 2012, respectively), principally from clients in the pharmaceutical industry. The Company’s trade receivables do not represent significant concentrations of credit risk at December 31, 2013 due to the credit worthiness of its clients and their dispersion across many geographic areas.
F-25
Table of Contents
Debt
The following table summarizes the Company’s debt at the dates indicated:
| December 31, | ||||||||
| (Dollars in millions) | 2013 | 2012 | ||||||
|
|
||||||||
| Senior Secured Term Loan due 2017—USD LIBOR at average floating rates of 3.75% |
$ | 1,747 | $ | 1,766 | ||||
| Senior Secured Term Loan due 2017—EUR LIBOR at average floating rates of 4.25% |
1,030 | 999 | ||||||
| 12.50% Senior Notes due 2018 |
1,000 | 1,000 | ||||||
| 7.375%/8.125% Senior PIK Toggle Notes due 2018 |
750 | — | ||||||
| Revolving Credit Facility due 2017—USD LIBOR at average floating rates |
— | — | ||||||
| 6.00% Senior Notes due 2020 |
500 | 500 | ||||||
|
|
|
|||||||
| Principal Amount of Debt |
5,027 | 4,265 | ||||||
| Less: Unamortized Discounts |
(67 | ) | (88 | ) | ||||
|
|
|
|||||||
| Total Debt |
$ | 4,960 | $ | 4,177 | ||||
|
|
||||||||
Scheduled principal payments due on our debt as of December 31, 2013 were as follows:
| Year | ||||||||||||||||||||||||||||
| (Dollars in millions) | 2014 | 2015 | 2016 | 2017 | 2018 | Thereafter | Total | |||||||||||||||||||||
|
|
||||||||||||||||||||||||||||
| Debt |
$ | 66 | $ | 29 | $ | 29 | $ | 2,653 | $ | 1,750 | $ | 500 | $ | 5,027 | ||||||||||||||
|
|
||||||||||||||||||||||||||||
In August 2013, the Company issued $750 million of 7.375% cash interest and 8.125% Senior Payment-in-Kind (“PIK”) Toggle Notes due 2018 (the “Senior PIK Notes”). The Senior PIK Notes are unsecured obligations of Healthcare Technology Intermediate, Inc. and mature on September 1, 2018. Interest is paid semi-annually in March and September of each year, commencing March 1, 2014. Subject to certain restrictions, the Company may elect to pay a portion of the interest due on the outstanding principal amount of the Senior PIK Notes by issuing PIK Notes in a principal amount equal to the interest due. The proceeds, along with cash provided by the Company, were used to pay an approximate $753 million dividend to shareholders of the Company and for the payment of fees and expenses of the transaction of approximately $17 million.
In February 2013, the Company entered into an amendment of its existing Senior Secured Term Loans due 2017 (“Term Loan Amendment”) to reduce the interest rate paid by the Company. The Company reduced the borrowing margins and LIBOR floors by 50 basis points and 25 basis points, respectively, for both the USD and EUR tranches of debt. As a result of the Term Loan Amendment, the Company recorded $9 million of debt extinguishment losses and $3 million of third party fees in Other loss, net during the year ended December 31, 2013.
On October 24, 2012, the Company completed a recapitalization (the “Recapitalization”). The Recapitalization included an amendment (the “Amendment”) to the New Term Loan Agreement (see below) for additional term loans in the aggregate U.S. dollar equivalent of approximately $760 million, which included 200 million Euros. Among other modifications, the Amendment: (a) extended the maturity date of the Revolving Credit Facility to August 2017; and (b) increased the maximum leverage ratio.
F-26
Table of Contents
The Recapitalization also included a new offering of $500 million aggregate principal amount of 6% Senior Notes due 2020 (the “6% Senior Notes”). The 6% Senior Notes are guaranteed on a senior unsecured basis by the Company’s wholly-owned domestic subsidiaries. The 6% Senior Notes have terms substantially similar to the existing $1,000 million 12.5% Senior Notes due 2018 (“Existing 2018 Notes”), except that, most notably, the 6% Senior Notes have a three-year no call redemption period.
In order to effect the Recapitalization, the Company conducted an exchange offer and consent solicitation to exchange the Existing 2018 Notes for new 12.5% Senior Notes due 2018 (“New 12.5% Senior Notes”), and to solicit consents to proposed amendments to the indenture governing the Existing 2018 Notes to permit the recapitalization. The requisite consents were obtained and 99.96% of the holders of the Existing 2018 Notes agreed to participate in the exchange and received New 12.5% Senior Notes in an equal principal amount.
The proceeds from the Recapitalization were used to pay a $1,202 million dividend to shareholders of the Company and for payment of fees and expense of the transaction of approximately $48 million, which were capitalized.
In March 2011, the Company entered into an Amended and Restated Credit and Guaranty Agreement (“New Term Loan Agreement”) replacing its Credit and Guaranty Agreement dated February 2010. Under the New Term Loan Agreement, the Company increased its borrowings by $52 million and EUR 21 million. The terms of the New Term Loan Agreement extended the maturity date of the term loan and revolver by eighteen months to August 2017 and one year to February 2016, respectively, reduced the borrowing margins and LIBOR floor, expanded the revolver borrowing capacity by $100 million, and eliminated the interest coverage ratio covenant.
At December 31, 2013, short-term and long-term debt was $66 million and $4,894 million respectively, in the Consolidated Statements of Financial Position. At December 31, 2013, the Company had $375 million of unused debt capacity under our existing Senior Secured Credit Facilities. The Company’s senior secured credit facilities are secured by a security interest in substantially all of our tangible and intangible assets, including the stock and the assets of certain of its current and certain future wholly-owned U.S. subsidiaries and a portion of the stock of certain of its non-U.S. subsidiaries. In addition, certain of the assets of the Company’s Swiss subsidiaries have been pledged to secure any borrowings under the Senior Term Loan by IMS AG. There have been no such borrowings to date.
Costs incurred to issue debt are generally deferred and amortized as a component of interest expense over the estimated term of the related debt using the effective interest rate method. As of December 31, 2013, the unamortized balance of original issue discount reflected as a reduction to long term debt and fees and expenses related to the issuance of the debt included in Other assets was $67 million and $74 million, respectively. During the year ended December 31, 2013, the Company recorded interest expense of $35 million related to the amortization of these balances.
The Company’s financing arrangements provide for certain covenants and events of default customary for similar instruments, including in the case of the Company’s New Term Loan Agreement (as amended), a covenant to maintain a specific ratio of consolidated total indebtedness to adjusted EBITDA, as defined in the Credit Agreement. If an event of default occurs under any of the Company’s financing arrangements, the creditors under such financing arrangements will be entitled to take various actions, including the acceleration of amounts due
F-27
Table of Contents
under such arrangements, and in the case of the lenders under the Company’s New Term Loan Agreement (as amended), other actions permitted to be taken by a secured creditor. At December 31, 2013, the Company was in compliance with the financial covenant under the Company’s New Term Loan Agreement (as amended).
In May 2010, the Company purchased interest rate caps and entered into interest rate swap agreements for purposes of managing our risk in interest rate fluctuations. The Company purchased U.S. Dollar and Euro denominated interest rate caps for a total nominal value of approximately $1,675 million at strike rates ranging from 3% to 4%. These caps cover different periods between May 2010 and January 2015. The total premiums paid were $5 million. Most of these caps have expired and the nominal value of caps outstanding at December 31, 2013 was approximately $365 million, of which $250 million expired in January 2014.
The Company also entered into interest rate swap agreements to hedge notional amounts of $375 million of its borrowings. All were effective January 2012, and expire at various times from January 2014 through January 2016. On these agreements, the Company pays a fixed rate ranging from 2.6% to 3.3% and receives a variable rate of interest equal to the three-month London Interbank Offered Rate (“LIBOR”).
The fair value of the interest rate caps and swaps is the estimated amount that it would receive or pay to terminate such agreements, taking into account market interest rates and the remaining time to maturities. As of December 31, 2013 and 2012, based upon mark-to-market valuation, the Company recorded on the Consolidated Statements of Financial Position a long-term liability of $12 million and $21 million, respectively.
Note 8. Pension and postretirement benefits
The Company sponsors both funded and unfunded defined benefit pension plans. These plans provide benefits based on various criteria, including, but not limited to, years of service and salary. The Company also sponsors an unfunded postretirement benefit plan in the U.S. that provides health and prescription drug benefits to retirees who meet the eligibility requirements. The Company uses a December 31 measurement date for all pension and postretirement benefit plans.
In connection with the Merger on February 26, 2010, pension liability, AOCI and pension expense were re-measured for the acquired U.S. and U.K. pension plans. Due to the U.S. and U.K. plans accounting for 98% of the Company’s total pension obligation at the time of the merger, the remaining plans were considered immaterial and were not re-measured. Consistent with purchase accounting rules, the Company chose to adopt a 3-year smoothing of investment gains and losses to determine market related value of assets and to continue amortizing gains and losses using the 10% corridor method, amortizing over the average remaining service for active plan participants.
The U.K. Defined Benefit Plan closed to future accrual at June 30, 2011, giving rise to a curtailment under U.S. GAAP accounting. At June 30, 2011, the Plan was re-measured to recalculate the liability and determine the U.S. GAAP funding level based on market conditions and asset values at June 30, 2011.
Effective July 1, 2013, the Company amended its postretirement benefit plan to provide participants over the age of 65 retiree health benefits through a Health Reimbursement Arrangement (“HRA”) account. Covered retirees will be provided funds to be able to purchase
F-28
Table of Contents
their own health care coverage from private insurance companies and receive reimbursement of eligible health care expenses through the account. This amendment resulted in a net decrease of $5 million in the benefit obligation and is reflected as a plan amendment in the Other benefits table below. The $5 million plan amendment will be amortized over approximately five years, the average remaining life expectancy of the plan participants, defined as the average expected years until the HRA account is depleted.
The following tables summarize changes in the benefit obligation, the plan assets and the funded status of the Company’s pension and postretirement benefit plans as well as the components of net periodic benefit costs, including key assumptions.
| Pension benefits | ||||||||||||||||
| U.S. plans | Non-U.S. plans | |||||||||||||||
| Year ended December 31, | Year ended December 31, | |||||||||||||||
| (Dollars in millions) | 2013 | 2012 | 2013 | 2012 | ||||||||||||
|
|
||||||||||||||||
| Obligation and Funded Status |
||||||||||||||||
| Change in benefit obligation |
||||||||||||||||
| Benefit obligation at beginning of year |
$ | 251 | $ | 218 | $ | 224 | $ | 198 | ||||||||
| Service cost |
10 | 7 | 5 | 5 | ||||||||||||
| Interest cost |
9 | 10 | 9 | 10 | ||||||||||||
| Foreign currency exchange adjustment |
— | — | 2 | 6 | ||||||||||||
| Actuarial (gain) loss |
(14 | ) | 23 | 19 | 17 | |||||||||||
| Benefits paid |
(7 | ) | (7 | ) | (9 | ) | (10 | ) | ||||||||
| Settlements |
— | — | (3 | ) | (2 | ) | ||||||||||
|
|
|
|||||||||||||||
| Benefit obligation at end of year |
$ | 249 | $ | 251 | $ | 247 | $ | 224 | ||||||||
|
|
|
|||||||||||||||
| Change in plan assets |
||||||||||||||||
| Fair value of plan assets at beginning of year |
$ | 232 | $ | 204 | $ | 180 | $ | 163 | ||||||||
| Actual return on assets |
45 | 31 | 22 | 13 | ||||||||||||
| Foreign currency exchange adjustment |
— | — | 3 | 5 | ||||||||||||
| Employer contributions |
4 | 4 | 41 | 11 | ||||||||||||
| Benefits paid |
(7 | ) | (7 | ) | (9 | ) | (10 | ) | ||||||||
| Settlements |
— | — | (3 | ) | (2 | ) | ||||||||||
|
|
|
|||||||||||||||
| Fair value of plan assets at end of year |
$ | 274 | $ | 232 | $ | 234 | $ | 180 | ||||||||
|
|
|
|||||||||||||||
| Funded status |
$ | 25 | $ | (19 | ) | $ | (13 | ) | $ | (44 | ) | |||||
|
|
|
|||||||||||||||
| Amounts recognized in the Consolidated Statements of Financial Position consist of: |
||||||||||||||||
| Other assets |
$ | 64 | $ | 26 | $ | 4 | 1 | |||||||||
| Accrued and other current liabilities |
(2 | ) | (3 | ) | (1 | ) | (1 | ) | ||||||||
| Postretirement and postemployment benefits liability |
(37 | ) | (42 | ) | (16 | ) | (44 | ) | ||||||||
|
|
|
|||||||||||||||
| Net amount recognized |
$ | 25 | $ | (19 | ) | $ | (13 | ) | $ | (44 | ) | |||||
|
|
||||||||||||||||
F-29
Table of Contents
| Other benefits | ||||||||
| Year ended December 31, | ||||||||
| (Dollars in millions) | 2013 | 2012 | ||||||
|
|
||||||||
| Obligation and Funded Status |
||||||||
| Change in benefit obligation |
||||||||
| Benefit obligation at beginning of year |
$ | 13 | $ | 13 | ||||
| Plan participants’ contributions |
— | 1 | ||||||
| Actuarial gain |
(1 | ) | — | |||||
| Amendment |
(5 | ) | — | |||||
| Benefits paid (net of Medicare subsidy) |
(1 | ) | (1 | ) | ||||
|
|
|
|||||||
| Benefit obligation at end of year |
$ | 6 | $ | 13 | ||||
|
|
|
|||||||
| Change in plan assets |
||||||||
| Fair value of plan assets at beginning of year |
$ | — | $ | — | ||||
| Employer contributions |
1 | — | ||||||
| Plan participants’ contributions |
— | 1 | ||||||
| Benefits paid (net of Medicare subsidy) |
(1 | ) | (1 | ) | ||||
|
|
|
|||||||
| Fair value of plan assets at end of year |
$ | — | $ | — | ||||
|
|
|
|||||||
| Funded status |
$ | (6 | ) | $ | (13 | ) | ||
|
|
|
|||||||
| Amounts recognized in the Consolidated Statements of Financial Position consist of: |
||||||||
| Accrued and other current liabilities |
$ | (1 | ) | $ | (1 | ) | ||
| Postretirement and postemployment benefits liability |
(5 | ) | (12 | ) | ||||
|
|
|
|||||||
| Net amount recognized |
$ | (6 | ) | $ | (13 | ) | ||
|
|
||||||||
At December 31, 2013, the accumulated benefit obligation for all defined benefit pension plans was $490 million, of which $244 million related to our non-U.S. plans. At December 31, 2012, the accumulated benefit obligation for all defined benefit pension plans was $467 million, of which $221 million related to our non-U.S. plans.
| (Dollars in millions) Information for pension plans with an accumulated benefit obligation in excess of plan assets as of December 31, |
2013 | 2012 | ||||||
|
|
||||||||
| U.S. Plans |
||||||||
| Projected benefit obligation(1) |
$ | 40 | $ | 45 | ||||
| Accumulated benefit obligation |
$ | 40 | $ | 44 | ||||
| Fair value of plan assets(1) |
$ | 1 | $ | 1 | ||||
|
|
|
|||||||
| Non-U.S. Plans |
||||||||
| Projected benefit obligation(1) |
$ | 20 | $ | 223 | ||||
| Accumulated benefit obligation |
$ | 16 | $ | 221 | ||||
| Fair value of plan assets(1) |
$ | 6 | $ | 177 | ||||
|
|
||||||||
| (1) | The values are the equivalent for pension plans with projected benefit obligation in excess of plan assets. |
F-30
Table of Contents
The amounts recognized in AOCI for pension benefits consisted of net actuarial losses of $22 million and $55 million for the years ended December 31, 2013 and 2012, respectively. Of those amounts, $32 million and $23 million, respectively, related to the Company’s non-U.S. plans. The following table includes the amounts in AOCI for other benefits:
| Other benefits Year ended December 31, |
||||||||
| (Dollars in millions) | 2013 | 2012 | ||||||
|
|
||||||||
| Net actuarial loss |
$ | 1 | $ | 2 | ||||
| Prior service credit |
(5 | ) | — | |||||
|
|
|
|||||||
| Total |
$ | (4 | ) | $ | 2 | |||
|
|
||||||||
| Pension benefits—U.S. plans | ||||||||||||
| (Dollars in millions) | Year ended December 31, | |||||||||||
| Components of net periodic benefit cost | 2013 | 2012 | 2011 | |||||||||
|
|
||||||||||||
| Service cost |
$ | 10 | $ | 7 | $ | 7 | ||||||
| Interest cost |
9 | 10 | 11 | |||||||||
| Expected return on plan assets |
(18 | ) | (16 | ) | (16 | ) | ||||||
| Amortization of net loss |
1 | — | — | |||||||||
|
|
|
|||||||||||
| Net periodic benefit cost |
$ | 2 | $ | 1 | $ | 2 | ||||||
|
|
|
|||||||||||
| Other Changes in Plan Assets and Benefit Obligations Recognized in Other Comprehensive (Loss) Income |
||||||||||||
| Actuarial (gain) loss—current years |
$ | (41 | ) | $ | 8 | $ | 22 | |||||
| Amortization of actuarial loss |
(1 | ) | — | — | ||||||||
|
|
|
|||||||||||
| Total recognized in other comprehensive (loss) income |
$ | (42 | ) | $ | 8 | $ | 22 | |||||
|
|
|
|||||||||||
| Total recognized in net periodic benefit cost and other comprehensive (loss) income |
$ | (40 | ) | $ | 9 | $ | 24 | |||||
|
|
||||||||||||
| (Dollars in millions) | Pension benefits—Non-U.S.
plans Year ended December 31, |
|||||||||||
| Components of net periodic benefit cost for years | 2013 | 2012 | 2011 | |||||||||
|
|
||||||||||||
| Service cost |
$ | 5 | $ | 5 | $ | 7 | ||||||
| Interest cost |
10 | 10 | 10 | |||||||||
| Expected return on plan assets |
(11 | ) | (11 | ) | (10 | ) | ||||||
| Curtailment gain |
— | — | (7 | ) | ||||||||
|
|
|
|||||||||||
| Net periodic benefit cost |
$ | 4 | $ | 4 | $ | — | ||||||
|
|
|
|||||||||||
| Other Changes in Plan Assets and Benefit Obligations Recognized in Other Comprehensive (Loss) Income |
||||||||||||
| Actuarial loss—current years |
$ | 8 | $ | 14 | $ | 9 | ||||||
|
|
|
|||||||||||
| Total recognized in other comprehensive (loss) income |
$ | 8 | $ | 14 | $ | 9 | ||||||
|
|
|
|||||||||||
| Total recognized in net periodic benefit cost and other comprehensive (loss) income |
$ | 12 | $ | 18 | $ | 9 | ||||||
|
|
||||||||||||
F-31
Table of Contents
| Other benefits | ||||||||||||
| (Dollars in millions) | Year ended December 31, | |||||||||||
| Components of net periodic benefit cost for years | 2013 | 2012 | 2011 | |||||||||
|
|
||||||||||||
| Interest cost |
$ | — | $ | 1 | $ | 1 | ||||||
|
|
|
|||||||||||
| Net periodic benefit cost |
$ | — | $ | 1 | $ | 1 | ||||||
|
|
|
|||||||||||
| Other Changes in Plan Assets and Benefit Obligations Recognized in Other Comprehensive (Loss) Income |
||||||||||||
| Actuarial gain—current years |
$ | (1 | ) | $ | — | $ | — | |||||
| Prior service credit—current years |
(5 | ) | — | — | ||||||||
|
|
|
|||||||||||
| Total recognized in other comprehensive (loss) income |
$ | (6 | ) | $ | — | $ | — | |||||
|
|
|
|||||||||||
| Total recognized in net periodic benefit cost and other comprehensive (loss) income |
$ | (6 | ) | $ | 1 | $ | 1 | |||||
|
|
||||||||||||
The amounts in AOCI that are expected to be recognized as components of net periodic benefit cost (credit) during the next fiscal year are as follows:
| Pension benefits | ||||||||||||||||
| (Dollars in millions) | U.S. plans | Non- U.S. plans |
Other benefits |
Total | ||||||||||||
|
|
||||||||||||||||
| Net actuarial loss |
$ | — | $ | 1 | $ | — | $ | 1 | ||||||||
| Prior service credit |
— | — | (1 | ) | (1 | ) | ||||||||||
|
|
|
|||||||||||||||
| Total |
$ | — | $ | 1 | $ | (1 | ) | $ | — | |||||||
|
|
||||||||||||||||
Assumptions
| Pension benefits | Other benefits | |||||||||||||||||||||||
| U.S. plans | Non-U.S. plans | |||||||||||||||||||||||
| Weighted average assumptions used to determine benefit obligations at December 31, |
2013 | 2012 | 2013 | 2012 | 2013 | 2012 | ||||||||||||||||||
|
|
||||||||||||||||||||||||
| Discount rate |
4.66% | 3.80% | 4.37% | 4.44% | 2.90% | 3.80% | ||||||||||||||||||
| Rate of compensation increase |
3.00% | 3.00% | 1.98% | 1.85% | N/A | N/A | ||||||||||||||||||
|
|
||||||||||||||||||||||||
| Pension benefits | Other benefits | |||||||||||||||||||||||||||||||||||
| U.S. plans | Non-U.S. plans | |||||||||||||||||||||||||||||||||||
| Weighted average assumptions used to determine net periodic benefit cost for years ended December 31, |
2013 | 2012 | 2011 | 2013 | 2012 | 2011 | 2013 | 2012 | 2011 | |||||||||||||||||||||||||||
|
|
||||||||||||||||||||||||||||||||||||
| Discount rate |
3.80% | 4.60% | 5.25% | 4.44% | 5.02% | 5.17% | 3.80% | 4.60% | 5.25% | |||||||||||||||||||||||||||
| Expected long-term return on plan assets |
8.00% | 8.00% | 8.00% | 6.30% | 6.28% | 6.75% | N/A | N/A | N/A | |||||||||||||||||||||||||||
| Rate of compensation increase |
3.00% | 3.00% | 3.00% | 1.85% | 1.62% | 2.61% | N/A | N/A | N/A | |||||||||||||||||||||||||||
|
|
||||||||||||||||||||||||||||||||||||
| Assumed health care cost trend rates at December 31, | 2013 | 2012 | 2011 | |||||||||
|
|
||||||||||||
| Health care cost trend rate assumed for next year |
7.50% | 8.50% | 8.50% | |||||||||
| Rate to which the cost trend rate is assumed to decline (the ultimate trend rate) |
5.0% | 5.0% | 5.0% | |||||||||
| Year that the rate reaches the ultimate trend rate |
2019 | 2019 | 2019 | |||||||||
|
|
||||||||||||
F-32
Table of Contents
Assumed health care cost trend rates could have a significant effect on the amounts reported for the health care plans. A one-percentage-point change in assumed health care cost trend rates would have the following effects:
| (Dollars in millions) | 1-percentage- point increase |
1-percentage- point decrease |
||||||
|
|
||||||||
| Effect on total of service and interest cost |
$ | — | $ | — | ||||
| Effect on accumulated postretirement benefit obligation |
$ | — | $ | — | ||||
|
|
||||||||
Plan assets
The Company’s pension plan weighted average asset allocations at December 31, 2013 and 2012, by asset category, follows:
| Plan assets at December 31, | ||||||||||||||||||||||||
| U.S. plans | Non-U.S. plans | Total | ||||||||||||||||||||||
| Asset category | 2013 | 2012 | 2013 | 2012 | 2013 | 2012 | ||||||||||||||||||
|
|
||||||||||||||||||||||||
| Equity securities |
70 | % | 70 | % | 39 | % | 49 | % | 56 | % | 60 | % | ||||||||||||
| Debt securities |
24 | 25 | 48 | 38 | 35 | 31 | ||||||||||||||||||
| Real estate |
5 | 5 | 9 | 9 | 7 | 7 | ||||||||||||||||||
| Other |
1 | — | 4 | 4 | 2 | 2 | ||||||||||||||||||
|
|
|
|||||||||||||||||||||||
| Total |
100 | % | 100 | % | 100 | % | 100 | % | 100 | % | 100 | % | ||||||||||||
|
|
||||||||||||||||||||||||
The target asset allocation for the Company’s pension plans is as follows:
| Asset category | U.S. plans | Non-U.S. plans |
Total | |||||||||
|
|
||||||||||||
| Equity securities |
60—80% | 35—50% | 50—70% | |||||||||
| Debt securities |
20—30% | 35—55% | 25—35% | |||||||||
| Real estate |
0—10% | 0—10% | 0—10% | |||||||||
| Other |
0—1% | 0—5% | 0—1% | |||||||||
|
|
||||||||||||
The Company adopted authoritative guidance which established a three-level hierarchy for disclosure of fair value measurements as follows:
| Level 1 — | Quoted prices in active markets for identical assets or liabilities. | |
| Level 2 — | Quoted prices for similar assets or liabilities in active markets or quoted prices for identical assets or liabilities in inactive markets; and model-derived valuations in which all significant inputs are observable in active markets. | |
| Level 3 — | Unobservable inputs reflecting management’s own assumptions about the inputs used in pricing the asset or liability. | |
F-33
Table of Contents
The following tables summarize plan assets measured at fair value on the dates indicated:
| Fair value measurements at December 31, 2013 |
||||||||||||||||
| (Dollars in millions) | Total | Level 1 | Level 2 | Level 3 | ||||||||||||
|
|
||||||||||||||||
| Asset Category—U.S Plans |
||||||||||||||||
| Investment Funds |
||||||||||||||||
| Domestic Equities(1) |
$ | 149 | $ | 28 | $ | 121 | $ | — | ||||||||
| International Equities(2) |
45 | 18 | 27 | — | ||||||||||||
| Debt issued by national, state or local govt.(3) |
11 | — | 11 | — | ||||||||||||
| Corporate Bonds(4) |
55 | 40 | 15 | — | ||||||||||||
| Real Estate(5) |
14 | 14 | — | — | ||||||||||||
|
|
|
|||||||||||||||
| Total Assets |
$ | 274 | $ | 100 | $ | 174 | $ | — | ||||||||
|
|
||||||||||||||||
| Fair value measurements at December 31, 2013 |
||||||||||||||||
| (Dollars in millions) | Total | Level 1 | Level 2 | Level 3 | ||||||||||||
|
|
||||||||||||||||
| Asset Category—Non-U.S. Plans |
||||||||||||||||
| Investment Funds |
||||||||||||||||
| Cash |
$ | 4 | $ | 3 | $ | 1 | $ | — | ||||||||
| International Equities(2) |
91 | — | 91 | — | ||||||||||||
| Debt issued by national, state or local govt.(3) |
68 | 1 | 67 | — | ||||||||||||
| Corporate Bonds(4) |
45 | — | 45 | — | ||||||||||||
| Real Estate(5) |
20 | — | — | 20 | ||||||||||||
| Investment fund(6) |
6 | — | 6 | — | ||||||||||||
|
|
|
|||||||||||||||
| Total Assets |
$ | 234 | $ | 4 | $ | 210 | $ | 20 | ||||||||
|
|
||||||||||||||||
| Fair value measurements at December 31, 2012 |
||||||||||||||||
| (Dollars in millions) | Total | Level 1 | Level 2 | Level 3 | ||||||||||||
|
|
||||||||||||||||
| Asset Category—U.S. Plans |
||||||||||||||||
| Investment Funds |
||||||||||||||||
| Domestic Equities(1) |
$ | 125 | $ | 27 | $ | 98 | $ | — | ||||||||
| International Equities(2) |
37 | 15 | 22 | — | ||||||||||||
| Debt issued by national, state or local govt.(3) |
10 | — | 10 | — | ||||||||||||
| Corporate Bonds(4) |
48 | 35 | 13 | — | ||||||||||||
| Real Estate(5) |
12 | 12 | — | — | ||||||||||||
|
|
|
|||||||||||||||
| Total Assets |
$ | 232 | $ | 89 | $ | 143 | $ | — | ||||||||
|
|
||||||||||||||||
F-34
Table of Contents
| Fair value measurements at December 31, 2012 |
||||||||||||||||
| (Dollars in millions) | Total | Level 1 | Level 2 | Level 3 | ||||||||||||
|
|
||||||||||||||||
| Asset Category—Non-U.S. Plans |
||||||||||||||||
| Investment Funds |
||||||||||||||||
| Cash |
$ | 1 | $ | — | $ | 1 | $ | — | ||||||||
| International Equities(2) |
88 | — | 88 | — | ||||||||||||
| Debt issued by national, state or local govt.(3) |
41 | 1 | 40 | — | ||||||||||||
| Corporate Bonds(4) |
28 | — | 28 | — | ||||||||||||
| Real Estate(5) |
15 | — | — | 15 | ||||||||||||
| Investment Fund(6) |
7 | — | 7 | — | ||||||||||||
|
|
|
|||||||||||||||
| Total Assets |
$ | 180 | $ | 1 | $ | 164 | $ | 15 | ||||||||
|
|
||||||||||||||||
Notes:
| (1) | Comprises actively managed mutual funds, passively managed collective trusts and pooled funds investing primarily in companies with market capitalizations similar to that of the S&P 500, S&P Small Cap 600, Russell 1000 and Russell 2000 indexes. The collective trusts do not participate in securities lending. |
| (2) | Comprises actively managed mutual funds, passively managed collective trust fund and pooled funds investing primarily in companies in non-U.S. countries and non-U.S. developed market countries similar to that of the Morgan Stanley Capital International EAFE index. The collective trust does not participate in securities lending. |
| (3) | Comprises passively managed pooled funds primarily invested in debt instruments from non-U.S. national state or local Governments. |
| (4) | Comprises actively managed mutual funds, passively managed collective trust fund and pooled funds investing primarily in a diversified portfolio of investment grade U.S. and non-U.S. fixed income securities. The collective trust does not participate in securities lending. |
| (5) | Comprises an actively managed mutual fund and an actively managed pooled fund which primarily invests in real estate, including but not limited to offices, retail warehouses and shopping centers. |
| (6) | Comprises an actively managed investment fund which primarily invests in term deposit instruments offering a guaranteed investment return. |
Investments in mutual funds are valued at quoted market prices. Investments in common/collective trusts and pooled funds are valued at the net asset value (“NAV”) as reported by the trust. The NAV is based on the fair value of the underlying investments held by the fund less its liabilities. Level 3 real estate assets, which consist of an international property fund, directly invests in properties that rely on unobservable inputs to measure the fair value.
| Fair value measurements using significant unobservable inputs (level 3) |
||||||||
| (Dollars in millions) | 2013(1) | 2012(1) | ||||||
|
|
||||||||
| Asset Description |
||||||||
| Beginning balance |
$ | 15 | $ | 14 | ||||
| Actual return on plan assets |
||||||||
| —Assets held at end of year |
2 | 1 | ||||||
| Purchases, sales and settlements |
3 | — | ||||||
|
|
|
|||||||
| Ending balance |
$ | 20 | $ | 15 | ||||
|
|
||||||||
| (1) | All amounts relate to property. |
F-35
Table of Contents
Investment policies and strategies
The Company invests primarily in a diversified portfolio of equity and debt securities that provide for long-term growth within reasonable and prudent levels of risk. The asset allocation targets established by the Company are strategic and applicable to the Plan’s long-term investing horizon. The portfolio is constructed and maintained to provide adequate liquidity to meet associated liabilities and minimize long-term expense and provide prudent diversification among asset classes in accordance with the principles of modern portfolio theory. The plan employs a diversified mix of actively managed investments around a core of passively managed index exposures in each asset class. Within each asset class, rapid market shifts, changes in economic conditions or an individual fund manager’s outlook may cause the asset allocation to fall outside the prescribed targets. The majority of the Company’s plan assets are measured quarterly against benchmarks established by the Company’s investment advisors and the Company’s Asset Management Committee, who reviews actual plan performance and has the authority to recommend changes as deemed appropriate. Assets are rebalanced periodically to their strategic targets to maintain the Plan’s strategic risk/reward characteristics. The Company periodically conducts asset liability modeling studies to ensure that the investment strategy is aligned with the obligations of the plans and that the assets will generate income and capital growth to meet the cost of current and future benefits that the plans provide. The pension plans do not include investments in Company stock at December 31, 2013 or 2012.
The portfolio for the Company’s U.K. Pension plan seeks to invest in a range of suitable assets of appropriate liquidity which will generate in the most effective manner possible, income and capital growth to ensure that there are sufficient assets to meet benefit payments when they fall due, while controlling the long-term costs of the plan and avoiding short-term volatility of investment returns. The plan seeks to achieve these objectives by investing in a mixture of real (equities) and monetary (fixed interest) assets. It recognizes that the returns on real assets, while expected to be greater over the long-term than those on monetary assets, are likely to be more volatile. A mixture across asset classes should nevertheless provide the level of returns required by the Plan. The trustee periodically conducts asset liability modeling exercises to ensure the investments are aligned with the appropriate benchmark to better reflect the Plan’s liabilities. The trustee also undertakes to review this benchmark on a regular basis.
Expected long-term rate-of-return on assets
In selecting an expected return on plan asset assumption, the Company considers the returns being earned by each plan investment category in the fund, the rates of return expected to be available for reinvestment and long-term economic forecasts for the type of investments held by the plan. The expected return on plan assets for the U.S. pension plans was 8.0% at January 1, 2014 and January 1, 2013. Outside the U.S., the range of applicable expected rates of return was 1.0% – 6.5% as of January 1, 2014 and January 1, 2013. The actual return on plan assets will vary from year to year versus this assumption. The Company believes it is appropriate to use long-term expected forecasts in selecting its expected return on plan assets. As such, there can be no assurance that its actual return on plan assets will approximate the long-term expected forecasts. The EROA was $29 million and $27 million and the actual return on assets was $68 million and $44 million for the years ended December 31, 2013 and 2012 respectively. The variance between the EROA and the actual return on assets is a function of the methodology used to determine the EROA as mentioned above, specifically the long-term economic forecasts for the type of investments held by the plan. Actual annual return variances to EROA were higher in 2013 than in 2012 due to stronger market performance in 2013.
F-36
Table of Contents
The Company’s estimated long-term rate of return on plan assets is based on the principles of capital market theory which maintain that over the long run, prudent investment risk taking is rewarded with incremental returns and that combining non-correlated assets can maximize risk adjusted portfolio returns. Long-term return estimates are developed by asset category based on actual class return data, historical relationships between asset classes and risk factors and peer plan data. Long-term return estimates for the Company’s U.K. pension plan are developed by asset category based on actual class return data, historical relationships between asset classes and risk factors.
Cash flows
Contributions. During fiscal 2013, the Company contributed $46 million to its pensions and postretirement benefit plan, which included a voluntary contribution of £20 million, or approximately $33 million, to the U.K. Defined Benefit Plan in December 2013. Company contributions to its pensions and postretirement benefit plan during 2012 and 2011 were $15 million and $16 million, respectively. The Company currently expects to contribute $16 million in required contributions to its pension and postretirement benefit plans during fiscal 2014. The Company may make additional contributions into its pension plans in fiscal 2014 depending on, among other factors, how the funded status of those plans changes and in order to meet minimum funding requirements as set forth in employee benefit and tax laws, plus additional amounts the Company may deem to be appropriate.
Estimated future benefit payments and subsidy receipts. The following benefit payments (net of expected participant contributions), which reflect expected future service and the Medicare Part D subsidy receipts, are expected to be paid or received as follows:
| (Dollars in millions) Expected benefit payments/(subsidy receipts) |
Pension benefits |
Other benefits |
Expected federal subsidy |
|||||||||
|
|
||||||||||||
| 2014 |
$ | 17 | $ | 1 | $ | — | ||||||
| 2015 |
16 | 1 | — | |||||||||
| 2016 |
16 | 1 | — | |||||||||
| 2017 |
17 | 1 | — | |||||||||
| 2018 |
19 | 1 | — | |||||||||
| Years 2019—2022 |
117 | 1 | — | |||||||||
|
|
||||||||||||
Plans accounted for as deferred compensation contracts. The Company provides certain executives with supplemental pension benefits in accordance with their individual employment arrangements. The tables of this Note 8 do not include the Company’s expense or obligation associated with providing these benefits. The Company’s obligation for these unfunded arrangements was $1 million at December 31, 2013 and 2012. Annual expense was de minimis for the years ended 2013, 2012 and 2011. The discount rate used to measure year-end obligations was 4.6% as of December 31, 2013 and 3.8% as of December 31, 2012.
Plans accounted for as post retirement benefits. The Company provides certain executives with post retirement medical, dental and life insurance benefits. These benefits are individually negotiated arrangements in accordance with their individual employment arrangements. The tables of this Note 8 do not include the Company’s expense or obligation associated with providing these benefits. The Company’s obligation for these unfunded arrangements was
F-37
Table of Contents
$11 million at December 31, 2013 and 2012. Annual expense was $2 million for the year ended December 31, 2013, and de minimis for the years ended 2012 and 2011. The discount rate used to measure year-end obligations was 4.8% as of December 31, 2013 and 3.8% as of December 31, 2012.
Defined contribution plans. Certain employees of the Company in the U.S. are eligible to participate in the Company-sponsored defined contribution plan. The Company makes a matching contribution of up to 50% of the employee’s contribution based on specified limits of the employee’s salary. The Company’s expense related to this plan was approximately $6 million, $6 million and $5 million for the years ended 2013, 2012 and 2011, respectively. None of the plan assets were invested in Company stock at December 31, 2013 or December 31, 2012.
On January 1, 2007, the defined contribution executive retirement plan was established. Participants are certain key executives who are designated by the CEO and approved by the Human Resource Committee of the board. Contributions are defined in the plan document and consist of basic and past service contributions as well as an annual investment credit. Both types of contributions are based on age and service, however, the past service contribution is only granted to the participants for the first ten years of participation in the plan. Each account is credited with an annual investment credit based on the average of the annual yields at the end of each month on the AA-AAA rated 10+ year maturity component of the Merrill Lynch U.S. Corporate Bond Master Index. The plan has no assets, but a liability equal to the contributions credited to the participants is recorded in the balance sheet of the Company. The Company’s expense related to this plan was approximately $1 million, $1 million and $3 million for the years ended 2013, 2012 and 2011, respectively. On June 30, 2012, the defined contribution executive retirement plan was frozen to additional accruals for future service contributions. However, the annual investment credit will continue.
There are additional Company-sponsored defined contribution arrangements for employees of the Company residing in countries other than the U.S. The Company is required to make contributions based on the specific requirements of the plans. The Company’s expense related to these plans was approximately $8 million, $9 million and $7 million for the years ended 2013, 2012 and 2011, respectively. None of the plan assets were invested in Company stock at any time during 2013, 2012 or 2011.
Note 9. Stock-based compensation
The Company’s 2010 Equity Incentive Plan (the “Equity Plan”) was approved and adopted by the Board of Directors in March 2010. The Equity Plan authorizes equity awards to be granted to key employees and directors, consultants, and advisors to the Company as determined by the plan administrator. Awards may be granted as stock options (including incentive stock options), stock appreciation rights, restricted stock, unrestricted stock, restricted stock units, and/or performance awards. At December 31, 2013, there were 250 million shares reserved for issuance under the Company’s 2010 Equity Incentive Plan (the “Equity Plan”), of which 32 million shares are still available for future grants.
The Company recognizes stock-based compensation expense for all share-based payments to employees over the requisite service period (generally the vesting period) in the Consolidated Statements of Comprehensive (Loss) Income based on the fair values of the number of awards that are ultimately expected to vest. As a result, for most awards, recognized stock-based compensation expense is reduced for estimated forfeitures prior to vesting primarily based on
F-38
Table of Contents
historical annual forfeiture rates. Estimated forfeitures will be reassessed in subsequent periods and may change based on new facts and circumstances. The Company satisfies exercises and issuances of vested equity awards with issuances of common stock.
The Company grants cash settled stock appreciation rights (“Phantom SARS”) to certain employees, which have an exercise price equal to the fair market value on the date of grant. Unless previously terminated or forfeited, the Phantom SARS will automatically be exercised upon the first to occur of a “change in ownership” or a date that is six months (or earlier as determined by the Leadership Development and Compensation Committee) following an “Initial Public Offering” (“IPO”) (each, a “Liquidity Event”) and can only be settled in cash. The Phantom SARS expire on the tenth anniversary of the date of grant and no expense will be recorded until the Liquidity Event occurs. At the time of a Liquidity Event, the Company will recognize a charge calculated as the number of Phantom SARs then outstanding multiplied by the excess of the fair market value at the time of the Liquidity Event over the exercise price.
The Company grants service-based and performance-based stock options. Unless previously terminated or forfeited, the service-based options vest in equal increments of 20% on each of the five anniversaries of the date of grant and the performance-based options vest in equal increments of 20% on each of the five anniversaries of the date of grant if the Annual or Cumulative EBITDA Target, as defined by the Plan, with respect to the fiscal year to which the performance-based options are aligned, is achieved. The service-based and performance-based awards both have an exercise price equivalent to the fair market value on the date of grant and expire on the tenth anniversary of the date of grant.
The Company granted premium priced service-based options (“Premium Priced Options”) in 2010. The Premium Priced Options vest 50% on each of the third and fifth anniversaries of the grant date. The awards have an exercise price equal to 150% of the fair market value on the date of grant and expire on the tenth anniversary of the date of grant.
The Company granted service-based stock options in 2010 and grants service-based restricted stock units to directors who were not employees and not affiliated with our Sponsors. The service-based stock options vest in equal increments of 20% on each of the first five anniversaries of the commencement of service to the Company. The exercise price is equal to the fair market value on the date of grant, and the options expire on the tenth anniversary of the date of grant. The service-based restricted stock units vest in equal increments of 50% on each of the first two anniversaries of the grant date and were granted at a price equal to the fair market value of a share of common stock on the date of grant.
The Company granted service-based restricted stock in 2010. The restricted stock vests in equal increments of 50% on each of the first two anniversaries of the transaction date and the restricted stock units cliff vest in 2010 and 2012, and were granted at a price equal to the fair market value of a share of common stock on the date of grant.
In 2010, pursuant to an employment agreement and subsequent consulting agreement, equity awards were granted to an individual while employed and continued to vest after termination of employment. Given that substantive future service is not required under the consulting agreement, the service-based stock options and service-based restricted stock awards were fully expensed during the fourth quarter of 2010. The performance-based stock options will continue to be expensed over the vesting period and remain dependent upon achieving the Adjusted EBITDA targets as stated in the consulting agreement.
F-39
Table of Contents
In August 2013, the Board of Directors of the Company declared a cash dividend of $0.26 per share. In accordance with the terms of the Equity Plan, option holders received $0.26 per share in respect of vested options and a corresponding $0.26 per share reduction in the exercise price of unvested options. The other terms of the equity awards, including vesting schedules, remained unchanged. The Company did not record a charge for modification of the exercise price for unvested awards as the modification was provided for by the terms of the Equity Plan.
In October 2012, the Board of Directors of the Company declared a cash dividend of $0.42 per share. In accordance with the terms of the Equity Plan, option holders received $0.42 per share in respect of vested options and a corresponding $0.42 per share reduction in the exercise price of unvested options. The other terms of the equity awards, including vesting schedules, remained unchanged. The Company did not record a charge for modification of the exercise price for unvested awards as the modification was provided for by the terms of the Equity Plan.
The fair value of stock options is estimated using the Black-Scholes option-pricing model. For service-based options, the Company values stock option grants and recognizes compensation expense on a straight-line basis over the requisite service period of the award. For options with graded vesting, the Company values stock option grants and recognizes compensation expense as if each vesting portion of the award was part of the total award and not a separate award. This model requires the input of subjective assumptions that will usually have a significant impact on the fair value estimate. The assumptions for prior year grants were developed based on relevant guidance. The following table summarizes the weighted average assumptions used to compute the weighted average fair value of stock option grants:
| 2013 | 2012 | 2011 | ||||||||||
|
|
||||||||||||
| Dividend Yield |
0.0% | 0.0% | 0.0% | |||||||||
| Weighted Average Volatility |
26.7% | 27.00% | 25.2% | |||||||||
| Risk Free Interest Rate |
1.19% | 0.92% | 1.56% | |||||||||
| Expected Term |
5.50 years | 5.50 years | 5.50 years | |||||||||
| Weighted Average Fair Value of Options Granted |
$0.49 | $0.33 | $0.30 | |||||||||
| Weighted Average Grant Price |
$1.30 | $1.24 | $1.12 | |||||||||
|
|
||||||||||||
| • | The dividend yield of 0.0% is used because no recurring dividends have been authorized and the Company does not expect to pay cash dividends in the foreseeable future. An increase in the dividend yield will decrease stock compensation expense. |
| • | The weighted average volatility was developed using the historical volatility of several peer companies to IMS Health Holdings, Inc. for periods equal to the expected life of the options. An increase in the weighted average volatility assumption will increase stock compensation expense. |
| • | The risk-free interest rate was developed using the U.S. Treasury yield curve for periods equal to the expected life of the options on the grant date. An increase in the risk-free interest rate will increase stock compensation expense. |
| • | The expected term was estimated for the 2013 grant of stock options as the vesting term plus 6 months. Participants are unlikely to exercise before a liquidity event because there has been no market to sell the shares. On January 2, 2014, the Company filed a registration statement with the U.S. Securities and Exchange Commission (“SEC”) related to a proposed IPO of its common |
F-40
Table of Contents
| stock, which could alter the expected term for future grants. An increase in the expected holding period will increase stock compensation expense. |
The following table summarizes the components and classification of stock-based compensation expense for the periods indicated:
| Year ended December 31, | ||||||||||||
| (Dollars in millions) | 2013 | 2012 | 2011 | |||||||||
|
|
||||||||||||
| Stock Options |
$ | 21 | $ | 16 | $ | 12 | ||||||
| Restricted Stock Units |
1 | 3 | 6 | |||||||||
|
|
|
|||||||||||
| Total Stock-Based Compensation Expense |
$ | 22 | $ | 19 | $ | 18 | ||||||
|
|
|
|||||||||||
| Operating Costs of Information, Exclusive of Depreciation and Amortization |
$ | 3 | $ | 2 | $ | 1 | ||||||
| Direct and Incremental Costs of Technology Services, Exclusive of Depreciation and Amortization |
2 | 1 | 1 | |||||||||
| Selling and Administrative Expenses, Exclusive of Depreciation and Amortization |
17 | 16 | 16 | |||||||||
|
|
|
|||||||||||
| Total Stock-Based Compensation Expense |
$ | 22 | $ | 19 | $ | 18 | ||||||
|
|
|
|||||||||||
| Tax Benefit on Stock-Based Compensation Expense |
$ | 7 | $ | 8 | $ | 7 | ||||||
|
|
||||||||||||
The tax benefit realized on stock options exercised and restricted stock issued for the year ended December 31, 2013 was less than $1 million.
Stock options and stock appreciation rights
Proceeds received from the exercise of service based stock options for the years ended December 31, 2013, 2012 and 2011 were $1 million, $2 million and $1 million, respectively. The intrinsic value for stock options is calculated based on the exercise price of the underlying awards and the market price of the Company’s common stock as of the end of the period. The intrinsic value of service based stock options that were exercised during the years ended December 31, 2013, 2012 and 2011 was $1 million, $1 million and $— million, respectively.
The following tables summarize activity of stock options with service conditions for the periods indicated:
| (Shares in millions) | Shares | Weighted average exercise price per share |
Weighted average remaining term |
Aggregate intrinsic value |
||||||||||||
|
|
||||||||||||||||
| Options Outstanding, December 31, 2012 |
117 | $ | 0.84 | 7.63 | $ | 23 | ||||||||||
| Granted |
7 | $ | 1.35 | |||||||||||||
| Forfeitures |
(2 | ) | $ | 0.61 | ||||||||||||
| Exercises |
(1 | ) | $ | 0.99 | ||||||||||||
| Cancels |
(1 | ) | $ | 0.99 | ||||||||||||
|
|
|
|||||||||||||||
| Options Outstanding on Distribution Date before Dividend |
120 | $ | 0.88 | |||||||||||||
| Options Outstanding on Distribution Date after Dividend |
120 | $ | 0.77 | |||||||||||||
|
|
|
|||||||||||||||
| Granted |
2 | $ | 1.09 | |||||||||||||
| Forfeitures |
(2 | ) | $ | 0.59 | ||||||||||||
| Exercises |
(1 | ) | $ | 0.87 | ||||||||||||
|
|
|
|||||||||||||||
| Options Outstanding, December 31, 2013 |
119 | $ | 0.78 | 6.83 | $ | 42 | ||||||||||
|
|
|
|||||||||||||||
| Options Vested or Expected to Vest, December 31, 2013 |
112 | $ | 0.78 | 6.79 | $ | 39 | ||||||||||
|
|
|
|||||||||||||||
| Options Exercisable, December 31, 2013 |
62 | $ | 0.92 | 6.52 | $ | 13 | ||||||||||
|
|
||||||||||||||||
F-41
Table of Contents
As of December 31, 2013, approximately $12 million of unrecognized stock compensation expense related to unvested service-based stock options (net of estimated forfeitures) is expected to be recognized over a weighted-average period of approximately 1.3 years.
Proceeds received from the exercise of performance based stock options for the years ended December 31, 2013, 2012 and 2011 were $1 million in each of the three years. The intrinsic value of performance based stock options that were exercised during the years ended December 31, 2013, 2012 and 2011 were de minimis.
The following table summarizes activity of stock options with performance conditions for the periods indicated:
| (Shares in millions) | Shares | Weighted average exercise price per share |
Weighted average remaining term |
Aggregate intrinsic value |
||||||||||||
|
|
||||||||||||||||
| Options Outstanding, December 31, 2012 |
69 | $ | 0.77 | 7.60 | $ | 15 | ||||||||||
| Granted |
5 | $ | 1.35 | |||||||||||||
| Forfeitures |
(2 | ) | $ | 0.61 | ||||||||||||
| Cancels |
(1 | ) | $ | 0.99 | ||||||||||||
|
|
|
|||||||||||||||
| Options Outstanding on Distribution Date before Dividend |
71 | $ | 0.81 | |||||||||||||
| Options Outstanding on Distribution Date after Dividend |
71 | $ | 0.69 | |||||||||||||
|
|
|
|||||||||||||||
| Granted |
1 | $ | 1.09 | |||||||||||||
| Forfeitures |
(1 | ) | $ | 0.77 | ||||||||||||
| Exercises |
(1 | ) | $ | 0.87 | ||||||||||||
|
|
|
|||||||||||||||
| Options Outstanding, December 31, 2013 |
70 | $ | 0.69 | 6.82 | $ | 28 | ||||||||||
|
|
|
|||||||||||||||
| Options Vested or Expected to Vest, December 31, 2013 |
66 | $ | 0.81 | 6.78 | $ | 26 | ||||||||||
|
|
|
|||||||||||||||
| Options Exercisable, December 31, 2013 |
37 | $ | 0.87 | 6.48 | $ | 8 | ||||||||||
|
|
||||||||||||||||
As of December 31, 2013, approximately $5 million of unrecognized stock compensation expense related to unvested performance-based stock options (net of estimated forfeitures) is expected to be recognized over a weighted-average period of approximately 1.3 years.
The following table summarizes activity of phantom SARS with performance conditions for the periods indicated:
| (Shares in millions) | Shares | Weighted average exercise price per share |
Weighted average remaining term |
Aggregate intrinsic value |
||||||||||||
|
|
||||||||||||||||
| Options Outstanding, December 31, 2012 |
15 | $ | 0.63 | 7.69 | $ | 5 | ||||||||||
| Granted |
5 | $ | 1.35 | |||||||||||||
| Forfeitures |
(1 | ) | $ | 0.60 | ||||||||||||
|
|
|
|||||||||||||||
| Options Outstanding on Distribution Date before Dividend |
19 | $ | 0.82 | |||||||||||||
| Options Outstanding on Distribution Date after Dividend |
19 | $ | 0.56 | |||||||||||||
|
|
|
|||||||||||||||
| Options Outstanding, December 31, 2013 |
19 | $ | 0.56 | 7.43 | $ | 10 | ||||||||||
|
|
|
|||||||||||||||
| Options Vested or Expected to Vest, December 31, 2013 |
19 | $ | 0.56 | 7.43 | $ | 10 | ||||||||||
|
|
|
|||||||||||||||
| Options Exercisable, December 31, 2013 |
— | — | — | — | ||||||||||||
|
|
||||||||||||||||
F-42
Table of Contents
Unless previously terminated or forfeited, the Phantom SARS will automatically be exercised upon the first to occur of a “change in ownership” or a date that is six months (or earlier as determined by the Leadership Development and Compensation Committee) following an IPO (each a ‘Liquidity Event’). Since equity compensation expense for performance-based awards is not recorded until the performance is probable, no expense will be recorded until the Liquidity Event occurs.
The following table summarizes activity of SARS with service conditions for the periods indicated:
| (Shares in millions) | Shares | Weighted average exercise price per share |
Weighted average remaining term |
Aggregate intrinsic value |
||||||||||||
|
|
||||||||||||||||
| Options Outstanding, December 31, 2012 |
7 | $ | 0.25 | 3.30 | $ | 5 | ||||||||||
|
|
|
|||||||||||||||
| Options Outstanding, December 31, 2013 |
7 | $ | 0.25 | 2.30 | $ | 6 | ||||||||||
|
|
|
|||||||||||||||
| Options Vested or Expected to Vest, December 31, 2013 |
7 | $ | 0.25 | 2.30 | $ | 6 | ||||||||||
|
|
|
|||||||||||||||
| Options Exercisable, December 31, 2013 |
7 | $ | 0.25 | 2.30 | $ | 6 | ||||||||||
|
|
||||||||||||||||
The SARS are not subject to additional vesting requirements; therefore, no additional expense is recorded for these awards.
Restricted stock and restricted stock units
The intrinsic value for restricted stock and restricted stock units is calculated based on the market price of the Company’s common stock as of the end of the period. The total fair value of restricted stock units with service conditions which vested during the years ended December 31, 2013, 2012, and 2011 was $2 million, $13 million and $2 million, respectively. The total fair value of restricted stock units with performance conditions which vested during the years ended December 31, 2013, 2012 and 2011 was $1 million, $— million and $— million, respectively. At December 31, 2013 and 2012, the number of unvested shares was 1 million and de minimis, respectively, and the shares had weighted-average exercise prices per share of $1.08 and $1.21, respectively.
Note 10. Income taxes
Loss before benefit from income taxes consisted of:
| Year ended December 31, | ||||||||||||
| (Dollars in millions) | 2013 | 2012 | 2011 | |||||||||
|
|
||||||||||||
| U.S. |
$ | (240 | ) | $ | (212 | ) | $ | (243 | ) | |||
| Non-U.S. |
192 | 151 | 181 | |||||||||
|
|
|
|||||||||||
| Total |
$ | (48 | ) | $ | (61 | ) | $ | (62 | ) | |||
|
|
||||||||||||
F-43
Table of Contents
Benefit from income taxes consisted of:
| Year ended December 31, | ||||||||||||
| (Dollars in millions) | 2013 | 2012 | 2011 | |||||||||
|
|
||||||||||||
| U.S. Federal and State: |
||||||||||||
| Current |
$ | 6 | $ | 23 | $ | (6 | ) | |||||
| Deferred |
(178 | ) | (76 | ) | (207 | ) | ||||||
|
|
|
|||||||||||
| $ | (172 | ) | $ | (53 | ) | $ | (213 | ) | ||||
|
|
|
|||||||||||
| Non-U.S.: |
||||||||||||
| Current |
$ | 66 | $ | 60 | $ | 74 | ||||||
| Deferred |
(24 | ) | (26 | ) | (34 | ) | ||||||
|
|
|
|||||||||||
| 42 | 34 | 40 | ||||||||||
|
|
|
|||||||||||
| Total |
$ | (130 | ) | $ | (19 | ) | $ | (173 | ) | |||
|
|
||||||||||||
The following table summarizes the significant differences between the U.S. Federal statutory taxes and the Company’s provision for income taxes for consolidated financial statement purposes.
| Year ended December 31, | ||||||||||||
| 2013 | 2012 | 2011 | ||||||||||
|
|
||||||||||||
| Tax Benefit at Statutory Rate |
(35% | ) | (35% | ) | (35% | ) | ||||||
| State and Local Income Taxes, net of Federal Tax Benefit |
(21 | ) | (19 | ) | 5 | |||||||
| Impact of Non-U.S. Tax Rates and Credit |
(21 | ) | 17 | 8 | ||||||||
| Impact of Tax Rate Changes |
(12 | ) | (11 | ) | — | |||||||
| Restructuring Effect on Deferred Tax Liability |
(178 | ) | — | (274 | ) | |||||||
| Contract/Statute of Limitation Expirations |
(10 | ) | (8 | ) | (16 | ) | ||||||
| Reserves for Uncertain Tax Positions |
20 | 13 | 12 | |||||||||
| Merger Impact |
— | — | 3 | |||||||||
| Audit Settlements |
(12 | ) | 2 | 2 | ||||||||
| Other, net |
— | 10 | 15 | |||||||||
|
|
|
|||||||||||
| Total Tax Benefit |
(269% | ) | (31% | ) | (280% | ) | ||||||
|
|
||||||||||||
During the fourth quarter of 2013, the Company restructured its foreign operations and integrated its U.K., Spain and Austria businesses under the Company’s main European holding company in Switzerland. The restructuring significantly affected the book over tax basis differences among group members and the ultimate worldwide tax cost of a theoretical recognition of such differences. As a result, the associated deferred tax liability was reduced by approximately $86 million as of December 31, 2013.
In 2013, the Company’s effective tax rate was favorably impacted by a tax reduction of $10 million as a result of the conclusion of U.S. audits. In connection with one of the audits, the Company received a $47 million refund for which a receivable had been previously established. The Company also recorded tax reductions of $5 million as a result of the expiration of various statutes of limitation and $2 million for the reversal of a valuation allowance due to a change in enacted state tax law changes. The Company recorded a tax charge of $2 million for interest and penalties related to unrecognized tax benefits. As of December 31, 2013, the Company had $38
F-44
Table of Contents
million of unrecognized tax benefits that if recognized would favorably affect the effective tax rate and $11 million of interest and penalties associated with unrecognized tax benefits.
In 2012, the Company’s effective tax rate was favorably impacted by a reduction of $7 million to deferred tax liability and a tax reduction of $5 million as a result of the expiration of certain statutes of limitation. The Company recorded a tax charge of $3 million for interest and penalties related to unrecognized tax benefits. As of December 31, 2012, the Company had $39 million of unrecognized tax benefits that if recognized would favorably affect the effective tax rate and $10 million of interest and penalties associated with unrecognized tax benefits.
During the fourth quarter of 2011, the Company restructured its foreign operations to integrate its German operating group subsidiaries under the Company’s main European holding company in Switzerland. The restructuring significantly affected the book over tax basis differences among group members and the ultimate worldwide tax cost of a theoretical recognition of such differences. As a result, the associated deferred tax liability was reduced by approximately $170 million as of December 31, 2011.
Additionally, the Company recorded in 2011 a tax charge of $6 million associated with the impact of the merger and a tax charge of $3 million for interest and penalties related to unrecognized tax benefits. As of December 31, 2011, the Company had $41 million of unrecognized tax benefits that if recognized would favorably affect the effective tax rate and $9 million of interest and penalties associated with unrecognized tax benefits.
The Company files numerous consolidated and separate income tax returns in U.S. (federal and state) and non-U.S. jurisdictions. The Company is no longer subject to U.S. federal income tax examination by tax authorities for years before 2010. Further, with few exceptions, the Company is no longer subject to tax examination in state and local jurisdictions for years prior to 2009 and in its material non-U.S. jurisdictions prior to 2007. It is reasonably possible that within the next twelve months the Company could realize $3 million of unrecognized tax benefits as a result of the expiration of certain statutes of limitation.
A reconciliation of the beginning and ending amount of unrecognized tax benefits is as follows:
| Year ended December 31, | ||||||||||||
| (Dollars in millions) | 2013 | 2012 | 2011 | |||||||||
|
|
||||||||||||
| Tabular Reconciliation of Uncertain Tax Benefits |
||||||||||||
| Gross unrecognized tax benefits at beginning of year |
$ | 42 | $ | 45 | $ | 53 | ||||||
| Gross (decreases) increases—prior period positions |
— | 1 | (1 | ) | ||||||||
| Gross increases—current period positions |
11 | 1 | 5 | |||||||||
| Decreases—settlement with tax authorities |
(7 | ) | (2 | ) | (3 | ) | ||||||
| Reductions—lapse of statute of limitations |
(4 | ) | (4 | ) | (9 | ) | ||||||
| Other |
— | 1 | — | |||||||||
|
|
|
|||||||||||
| Gross unrecognized tax benefits at end of year |
$ | 42 | $ | 42 | $ | 45 | ||||||
|
|
||||||||||||
F-45
Table of Contents
The Company’s deferred tax assets (liabilities) are comprised of the following at December 31:
| (Dollars in millions) | 2013 | 2012 | ||||||
|
|
||||||||
| Deferred Tax Assets: |
||||||||
| Net Operating Losses |
$ | 135 | $ | 111 | ||||
| Foreign Tax Credits |
94 | 56 | ||||||
| Employment Benefits |
3 | 24 | ||||||
| Deferred Revenues |
16 | 15 | ||||||
| Equity Compensation |
21 | 15 | ||||||
| Post Employment Benefits |
12 | 14 | ||||||
| Non-U.S. Intangibles |
10 | 12 | ||||||
| Accrued Liabilities |
15 | 16 | ||||||
| Other |
18 | 5 | ||||||
|
|
|
|||||||
| 324 | 268 | |||||||
| Valuation Allowance |
(49 | ) | (45 | ) | ||||
|
|
|
|||||||
| 275 | 223 | |||||||
|
|
|
|||||||
| Deferred Tax Liabilities: |
||||||||
| Intangible Assets |
(819 | ) | (935 | ) | ||||
| Undistributed Earnings |
(352 | ) | (426 | ) | ||||
| Computer Software |
(122 | ) | (107 | ) | ||||
| Depreciation |
(11 | ) | (11 | ) | ||||
| Other |
(1 | ) | (13 | ) | ||||
|
|
|
|||||||
| (1,305 | ) | (1,492 | ) | |||||
|
|
|
|||||||
| Net Deferred Tax Liability |
$ | (1,030 | ) | $ | (1,269 | ) | ||
|
|
||||||||
The 2013 and 2012 net deferred tax liability consists of a current deferred tax asset of $88 million and $60 million, a non-current deferred tax asset of $9 million and $5 million, a current deferred tax liability of $25 million and $17 million, and a non-current deferred tax liability of $1,102 million and $1,317 million, respectively. See Notes 2 and 13.
The Company has federal, state and local, and non-U.S. tax credit and tax loss carryforwards, the tax effect of which was $242 million as of December 31, 2013. Of this amount, $8 million has an indefinite carryforward period, and the remaining $234 million expires at various times beginning in 2015. As of December 31, 2013, the Company has $49 million of valuation allowances established against state and local and non-U.S. net operating losses that based on available evidence, are more likely than not to expire before they can be utilized.
F-46
Table of Contents
Note 11. Commitments
The Company’s contractual obligations include facility leases, agreements to purchase data and telecommunications services, and leases of certain computer and other equipment. At December 31, 2013, the minimum annual payment under these agreements and other contracts that have initial or remaining non-cancelable terms in excess of one year are as listed in the following table:
| Year | ||||||||||||||||||||||||||||
| (Dollars in millions) | 2014 | 2015 | 2016 | 2017 | 2018 | Thereafter | Total | |||||||||||||||||||||
|
|
||||||||||||||||||||||||||||
| Operating Leases(1) |
$ | 52 | $ | 46 | $ | 43 | $ | 41 | $ | 32 | $ | 62 | $ | 276 | ||||||||||||||
| Data Acquisition and Telecommunication Services(2) |
205 | 152 | 103 | 69 | 24 | 29 | 582 | |||||||||||||||||||||
| Computer and Other Equipment Leases(3) |
27 | 15 | 12 | 7 | 5 | 10 | 76 | |||||||||||||||||||||
|
|
|
|||||||||||||||||||||||||||
| Total |
$ | 284 | $ | 213 | $ | 158 | $ | 117 | $ | 61 | $ | 101 | $ | 934 | ||||||||||||||
|
|
||||||||||||||||||||||||||||
Notes to Commitments table:
| (1) | Rental expense under real estate operating leases for the years ended 2013, 2012 and 2011 were $20 million, $21 million and $34 million, respectively. |
| (2) | Expense under data and telecommunications contracts for the years ended 2013, 2012 and 2011 were $215 million, $191 million and $212 million, respectively. |
| (3) | Rental expense under computer and other equipment leases for the years ended 2013, 2012 and 2011 were $25 million, $26 million and $24 million, respectively. These leases are frequently renegotiated or otherwise changed as advancements in computer technology produce opportunities to lower costs and improve performance. |
Note 12. Contingencies
The Company and its subsidiaries are involved in legal and tax proceedings, claims and litigation arising in the ordinary course of business. Management periodically assesses the Company’s liabilities and contingencies in connection with these matters based upon the latest information available. For those matters where management currently believes it is probable that the Company will incur a loss and that the probable loss or range of loss can be reasonably estimated, the Company has recorded reserves in the Consolidated Financial Statements based on its best estimates of such loss. In other instances, because of the uncertainties related to either the probable outcome or the amount or range of loss, management is unable to make a reasonable estimate of a liability, if any. However, even in many instances where the Company has recorded an estimated liability, the Company is unable to predict with certainty the final outcome of the matter or whether resolution of the matter will materially affect the Company’s results of operations, financial position or cash flows. As additional information becomes available, the Company adjusts its assessments and estimates of such liabilities accordingly.
The Company routinely enters into agreements with its suppliers to acquire data and with its clients to sell data, all in the normal course of business. In these agreements, the Company sometimes agrees to indemnify and hold harmless the other party for any damages such other party may suffer as a result of potential intellectual property infringement and other claims related to the use of the data. The Company has not accrued a liability with respect to these matters, as the exposure is considered remote.
Based on its review of the latest information available, management does not expect the impact of pending tax and legal proceedings, claims and litigation, either individually or in the aggregate, to have a material adverse effect on our results of operations, cash flows or financial
F-47
Table of Contents
position. However, one or more unfavorable outcomes in any claim or litigation against us could have a material adverse effect for the period in which it is resolved. The following is a summary of certain legal matters involving the Company.
IMS Health Government Solutions Voluntary Disclosure Program Participation
The Company’s wholly-owned subsidiary, IMS Government Solutions Inc., is primarily engaged in providing services and products under contracts with the U.S. government. U.S. government contracts are subject to extensive legal and regulatory requirements and, from time to time, agencies of the U.S. government have the ability to investigate whether contractors’ operations are being conducted in accordance with such requirements. U.S. government investigations, whether relating to these contracts or conducted for other reasons, could result in administrative, civil or criminal liabilities, including repayments, fines or penalties being imposed on us, or could lead to suspension or debarment from future U.S. government contracting. U.S. government investigations often take years to complete and may result in no adverse action against the Company.
IMS Government Solutions discovered potential noncompliance with various contract clauses and requirements under its General Services Administration Contract (the “GSA Contract”) which was awarded in 2002 to its predecessor company, Synchronous Knowledge Inc. (Synchronous Knowledge Inc. was acquired by IMS Health in May 2005). The potential noncompliance arose from three primary areas: first, at the direction of the government, work performed under one task order was invoiced under another task order without the appropriate modifications to the orders being made; second, personnel who did not meet strict compliance with the labor categories component of the qualification requirements of the GSA Contract were assigned to contracts; and third, certain discounts that were given to commercial customers were not also offered to the government, in alleged violation of the GSA Contract’s Price Reductions Clause. Upon discovery of the potential noncompliance, the Company began remediation efforts, promptly disclosed the potential noncompliance to the U.S. government, and was accepted into the Department of Defense Voluntary Disclosure Program. The Company filed its Voluntary Disclosure Program Report (“Disclosure Report”) on August 29, 2008. Based on the Company’s findings as disclosed in the Disclosure Report, the Company recorded a reserve of approximately $4 million for this matter in 2008. During 2010, the Company recorded an additional reserve of approximately $2 million as a result of its ongoing investigation relating to this matter. The Company is currently unable to determine the outcome of these matters pending the resolution of the Voluntary Disclosure Program process and its ultimate liability arising from these matters could exceed its current reserves.
Symphony Health Solutions litigation
On July 24, 2013, Symphony Health Solutions filed a lawsuit in the U.S. District Court for the Eastern District of Pennsylvania against IMS Health alleging that IMS Health is actively engaging in anticompetitive business practices in violation of the Sherman Antitrust Act and Pennsylvania state law. The complaint seeks trebled actual damages in an unspecified amount, punitive damages, costs and injunctive relief. The Company believes the complaint is without merit, rejects all claims raised and will vigorously defend IMS Health’s position.
F-48
Table of Contents
Note 13. Supplemental financial data
Accounts Receivable, net:
| (Dollars in millions) | At December 31, | |||||||
| 2013 | 2012 | |||||||
|
|
||||||||
| Trade and notes |
$ | 286 | $ | 275 | ||||
| Allowances |
(1 | ) | (5 | ) | ||||
| Unbilled receivables |
28 | 38 | ||||||
|
|
|
|||||||
| $ | 313 | $ | 308 | |||||
|
|
||||||||
Other Current Assets:
| (Dollars in millions) | At December 31, | |||||||
| 2013 | 2012 | |||||||
|
|
||||||||
| Deferred income taxes |
$ | 88 | $ | 60 | ||||
| Prepaid expenses |
72 | 45 | ||||||
| Work-in-process inventory |
46 | 47 | ||||||
| Income taxes receivable |
5 | 50 | ||||||
| Other |
47 | 61 | ||||||
|
|
|
|
|
|||||
| $ | 258 | $ | 263 | |||||
|
|
||||||||
Property, Plant and Equipment, net:
| At December 31, | ||||||||||||
| (Dollars in millions) | 2013 | 2012 | Estimated useful lives |
|||||||||
|
|
||||||||||||
| Buildings and improvements |
$ | 10 | $ | 10 | 40—50 years | |||||||
| Machinery and equipment |
185 | 160 | 3—12 years | |||||||||
| Leasehold improvements |
64 | 60 | 1—11 years | |||||||||
| Construction-in-progress |
3 | 2 | ||||||||||
|
|
|
|||||||||||
| Total property, plant and equipment, gross |
262 | 232 | ||||||||||
| Accumulated depreciation and amortization |
(145 | ) | (115 | ) | ||||||||
|
|
|
|||||||||||
| Total property, plant and equipment, net |
$ | 117 | $ | 117 | ||||||||
|
|
||||||||||||
Depreciation expense was $37 million, $42 million and $36 million for the years ended December 31, 2013, 2012 and 2011, respectively.
F-49
Table of Contents
Computer Software, net:
| (Dollars in millions) | ||||
|
|
||||
| December 31, 2011 |
$ | 286 | ||
|
|
|
|||
| Additions at cost |
64 | |||
| Acquisitions |
15 | |||
| Amortization |
(90 | ) | ||
| Impairments, foreign exchange and other |
(21 | ) | ||
|
|
|
|||
| December 31, 2012 |
$ | 254 | ||
|
|
|
|||
| Additions at cost |
81 | |||
| Acquisitions |
16 | |||
| Amortization |
(86 | ) | ||
| Impairments, foreign exchange and other |
(2 | ) | ||
|
|
|
|||
| December 31, 2013 |
$ | 263 | ||
|
|
||||
Accumulated amortization of total computer software was $289 million and $207 million at December 31, 2013 and 2012, respectively. Amortization expense was $68 million for the year ended December 31, 2011.
Other Assets:
| (Dollars in millions) | At December 31, | |||||||
| 2013 | 2012 | |||||||
|
|
||||||||
| Long-term pension assets |
$ | 68 | $ | 27 | ||||
| Securities and other investments |
8 | 9 | ||||||
| Long-term deferred tax asset |
9 | 5 | ||||||
| Other |
117 | 110 | ||||||
|
|
|
|||||||
| $ | 202 | $ | 151 | |||||
|
|
||||||||
Accounts Payable:
| (Dollars in millions) | At December 31, | |||||||
| 2013 | 2012 | |||||||
|
|
||||||||
| Trade |
$ | 26 | $ | 23 | ||||
| Taxes other than income taxes |
59 | 71 | ||||||
| Other |
18 | 15 | ||||||
|
|
|
|
|
|||||
| $ | 103 | $ | 109 | |||||
|
|
||||||||
F-50
Table of Contents
Accrued and Other Current Liabilities:
| (Dollars in millions) | At December 31, | |||||||
| 2013 | 2012 | |||||||
|
|
||||||||
| Salaries, wages, bonuses and other compensation |
$ | 171 | $ | 149 | ||||
| Accrued data acquisition costs |
88 | 97 | ||||||
| Accrued interest |
52 | 29 | ||||||
| Accrued professional fees |
44 | 66 | ||||||
| Accrued income taxes |
42 | 30 | ||||||
| Deferred tax liability |
25 | 17 | ||||||
| Accrued severance and other costs |
21 | 30 | ||||||
| Other |
137 | 115 | ||||||
|
|
|
|||||||
| $ | 580 | $ | 533 | |||||
|
|
||||||||
Other Liabilities:
| (Dollars in millions) | At December 31, | |||||||
| 2013 | 2012 | |||||||
|
|
||||||||
| Long-term uncertain tax benefits reserve |
$ | 28 | $ | 47 | ||||
| Other |
83 | 60 | ||||||
|
|
|
|||||||
| $ | 111 | $ | 107 | |||||
|
|
||||||||
Note 14. Related party
Due to related party relationships, it is possible that the terms of these transactions are not the same as those that would result from transactions among wholly unrelated parties.
Management services agreement
The Company entered into a management services agreement with affiliates of TPG, CPPIB and LGP (collectively, the “Managers”), pursuant to which the Managers will provide management services to the Company until December 31, 2020, with evergreen one year extensions thereafter. Pursuant to this agreement, the Managers received aggregate transaction fees of approximately $60 million in connection with services provided by such entities related to the acquisition of IMS Health. The Managers also receive an aggregate annual management fee equal to $7.5 million, and reimbursement for out-of-pocket expenses incurred by them, their members or their respective affiliates in connection with the provision of services pursuant to the agreement. Pursuant to the management services agreement, the Managers may provide advisory services related to financings or refinancings, recapitalizations, acquisitions, dispositions or other similar transactions; in connection with any such services the Managers have the right to receive
F-51
Table of Contents
customary fees charged by internationally-recognized investment banks for serving as financial advisor in similar transactions. The agreement includes customary exculpation and indemnification provisions in favor of the Managers and their respective affiliates.
At any time in connection with or in anticipation of a change of control or an IPO, the Managers may elect to receive their management fees payable under the management services agreement in a single lump sum cash payment equal to the present value of the then unpaid current and future management fees payable under the management services agreement.
Transactions with other Sponsor portfolio companies
The Sponsors are private equity firms that have investments in companies that do business with IMS Health in the ordinary course of business. The Company believes these transactions are conducted on an arms-length basis. For fiscal 2013, 2012 and 2011, the Company recorded approximately $11 million, $11 million and $9 million, respectively, associated with sales of the Company’s offerings to companies in which our Sponsors have investments. For fiscal 2013, 2012 and 2011, the Company purchased goods and services of $5 million, $6 million and $5 million, respectively from companies in which one or both of the Sponsors have investments.
Certain other relationships
In connection with the offering by our wholly-owned direct subsidiary, Healthcare Technology Intermediate, Inc., of $750 million Senior PIK Notes in August 2013, TPG Capital BD, LLC participated as an initial purchaser, and received approximately $1 million in connection therewith.
Note 15. Operations by business segment
Operating segments are defined as components of an enterprise about which financial information is available that is evaluated on a regular basis by the chief operating decision-maker, or decision-making groups, in deciding how to allocate resources to an individual segment and in assessing performance of the segment. The Company operates a globally consistent business model, offering pharmaceutical business information and related services to its clients in more than 100 countries. See Note 1.
The Company maintains regional geographic management who are responsible for bringing the Company’s full suite of offerings to their respective markets and to facilitate local execution of its global strategies. However, the Company maintains global leaders for the majority of its critical business processes; and the most significant performance evaluations and resource allocations made by the Company’s chief operating decision maker is made on a global basis. As such, the Company has concluded that it maintains one operating and reportable segment.
F-52
Table of Contents
Geographic financial information
The following represents selected geographic information for the regions in which the Company operates for the periods and dates indicated below.
| (Dollars in millions) | Americas(1) | EMEA(2) | Asia Pacific(3) |
Corporate and other |
Total | |||||||||||||||
|
|
||||||||||||||||||||
| Year Ended December 31, 2013: |
||||||||||||||||||||
| Revenue(4) |
$ | 1,160 | $ | 936 | $ | 448 | $ | — | $ | 2,544 | ||||||||||
| Operating Income (Loss)(5) |
304 | 248 | 146 | (344 | ) | 354 | ||||||||||||||
| Total Assets at December 31, 2013 |
4,065 | 2,383 | 1,333 | 218 | 7,999 | |||||||||||||||
|
|
|
|||||||||||||||||||
| Year Ended December 31, 2012: |
||||||||||||||||||||
| Revenue(4) |
$ | 1,096 | $ | 891 | $ | 456 | $ | — | $ | 2,443 | ||||||||||
| Operating Income (Loss)(5) |
293 | 217 | 161 | (432 | ) | 239 | ||||||||||||||
| Total Assets at December 31, 2012 |
3,862 | 2,283 | 1,635 | 435 | 8,215 | |||||||||||||||
|
|
|
|||||||||||||||||||
| Year Ended December 31, 2011: |
||||||||||||||||||||
| Revenue(4) |
$ | 1,013 | $ | 915 | $ | 436 | $ | — | $ | 2,364 | ||||||||||
| Operating Income (Loss)(5) |
286 | 252 | 146 | (465 | ) | 219 | ||||||||||||||
| Total Assets at December 31, 2011 |
4,034 | 2,223 | 1,765 | 336 | 8,358 | |||||||||||||||
|
|
||||||||||||||||||||
In 2013, the Company made some changes to its geographic reporting classifications to move some functions from corporate and other to the geographic regions and as a result, reclassifications of prior years’ geographic financial information were made to conform to the current year presentation. The reclassifications did not change previously reported consolidated results of operations or financial position.
| (1) | Americas includes the United States, Canada and Latin America. Revenue in the U.S. was $935 million, $885 million and $808 million for the years ended December 31, 2013, 2012 and 2011, respectively. Total U.S. assets were $3,837 million, $3,638 million and $3,821 million at December 31, 2013, 2012 and 2011, respectively. |
| (2) | EMEA includes countries in Europe, the Middle East and Africa. |
| (3) | Asia Pacific includes Japan, Australia and other countries in the Asia Pacific region. Revenue in Japan was $261 million, $286 million and $277 million for the years ended December 31, 2013, 2012 and 2011, respectively. |
| (4) | Revenue relates to external clients and is primarily based on the location of the client. Revenue for the geographic regions includes the impact of foreign exchange in converting results into U.S. dollars. |
| (5) | Operating Income for the three geographic regions does not reflect the allocation of certain expenses that are maintained in Corporate and Other and as such, is not a true measure of the respective regions’ profitability. The Operating Income amounts for the geographic regions include the impact of foreign exchange in translating results into U.S. dollars. For 2013, depreciation and amortization related to purchase accounting adjustments of $126 million, $87 million and $42 million for the Americas, EMEA and Asia Pacific, respectively, are presented in Corporate and Other. For 2012, depreciation and amortization related to purchase accounting adjustments of $126 million, $84 million and $51 million for the Americas, EMEA and Asia Pacific, respectively, are presented in Corporate and Other. For 2011, depreciation and amortization related to purchase accounting adjustments of $126 million, $91 million and $52 million for the Americas, EMEA and Asia Pacific, respectively, are presented in Corporate and Other. |
F-53
Table of Contents
Note 16. Earnings (loss) per share
The following table reconciles the basic and diluted weighted average shares outstanding:
| As of December 31, | ||||||||||||
| (Shares in millions) | 2013 | 2012 | 2011 | |||||||||
|
|
||||||||||||
| Basic weighted-average common shares outstanding |
2,800 | 2,795 | 2,788 | |||||||||
| Effect of dilutive options |
70 | — | 5 | |||||||||
|
|
|
|||||||||||
| Diluted weighted-average common shares outstanding |
2,870 | 2,795 | 2,793 | |||||||||
|
|
||||||||||||
Anti-dilutive weighted average outstanding stock options of approximately — million, 183 million and 70 million were not included in the diluted earnings (loss) per share calculations for the years ended December 31, 2013, 2012 and 2011, respectively, because their inclusion would have the effect of increasing earnings per share. Stock options will have a dilutive effect under the treasury method only when the respective period’s average market value of the Company’s common stock exceeds the exercise proceeds.
Unaudited pro forma earnings per share
The Company declared and paid a dividend to shareholders of $753 million in August 2013. Dividends declared in the twelve months preceding an IPO are deemed to be in contemplation of the offering with the intention of repayment out of the offering proceeds to the extent that the dividends exceeded earnings during such period. Unaudited pro forma earnings per share for 2013 gives effect to the sale of the number of shares the proceeds of which would be necessary to (i) pay the dividend amount that is in excess of 2013 earnings, (ii) fund the repayment of the debt and related fees and expenses and (iii) pay holders of Phantom SARs, up to the number of shares assumed to be issued in this offering.
Additionally, unaudited pro forma earnings per share for 2013 gives effect to the reversal of interest expense relating to such debt, including the reversal of amortization related to debt issuance costs and discount.
F-54
Table of Contents
The below table sets forth the computation of unaudited pro forma basic and diluted earnings per share as of December 31, 2013:
| (in millions, except per share data) | Basic | Diluted | ||||||
|
|
||||||||
| Net income attributable to the Company |
$ | 82 | $ | 82 | ||||
| Pro forma adjustments: |
||||||||
| Interest expense, net of tax(a) |
||||||||
|
|
|
|||||||
| Pro forma net income |
$ | $ | ||||||
|
|
|
|||||||
| Weighted-average shares outstanding |
2,800 | 2,870 | ||||||
| Pro forma adjustments: |
||||||||
| Shares assumed to be issued whose proceeds will be used to pay dividends in excess of earnings(b) |
||||||||
| Shares assumed to be used to repay outstanding indebtedness(c) |
||||||||
| Shares assumed to pay holders of Phantom SARs(d) |
||||||||
|
|
|
|||||||
| Pro forma weighted-average shares outstanding |
||||||||
|
|
|
|||||||
| Pro forma earnings per share |
$ | $ | ||||||
|
|
||||||||
|
(a) These adjustments reflect the elimination of the historical interest expense and amortization of debt issuance costs and discount and incurrence of prepayment penalty after reflecting the pro forma effect of the Refinancing. |
||||
| (b) Dividends declared in last twelve months |
$ | 753 | ||
| Net loss attributable to the Company in the last twelve months |
$ | ( | ) | |
|
|
|
|||
| Dividends in excess of earnings |
$ | 753 | ||
| Offering price per common share |
||||
| Common shares assumed issued in the IPO to pay dividends in excess of earnings |
||||
| (c) Indebtedness to be repaid with proceeds from this offering |
||||
| Offering price per common share |
||||
| Common shares assumed issued in this offering to repay indebtedness |
||||
| (d) Number of Phantom SARs |
||||
| Excess of fair market value over exercise price |
||||
| Common shares assumed issued in this offering necessary to pay holders of Phantom SARs |
||||
|
|
||||
F-55
Table of Contents
Five-year selected financial data (unaudited)(1)
| Successor | Predecessor | |||||||||||||||||||||||||||||||
| (Dollars in millions) | 2013 | 2012 | 2011 | 2010 | October 23, 2009 (inception) through December 31, 2009 |
January 1, 2010 through February 26, 2010 |
2009 | |||||||||||||||||||||||||
|
|
|
|
||||||||||||||||||||||||||||||
| Results of Operations: |
||||||||||||||||||||||||||||||||
| Revenue |
$ | 2,544 | $ | 2,443 | $ | 2,364 | $ | 1,869 | $ | — | $ | 293 | $ | 2,190 | ||||||||||||||||||
| Costs and Expenses(2) |
2,190 | 2,204 | 2,145 | 1,801 | 53 | 391 | 1,919 | |||||||||||||||||||||||||
|
|
|
|
|
|||||||||||||||||||||||||||||
| Operating Income (Loss) |
354 | 239 | 219 | 68 | (53 | ) | (98 | ) | 271 | |||||||||||||||||||||||
|
|
|
|
|
|||||||||||||||||||||||||||||
| Net Income (Loss) |
$ | 82 | $ | (42 | ) | $ | 111 | $ | (118 | ) | $ | (53 | ) | $ | (84 | ) | $ | 261 | ||||||||||||||
|
|
|
|
|
|||||||||||||||||||||||||||||
| Net Income (Loss) per Share: |
||||||||||||||||||||||||||||||||
| Basic |
$ | 0.03 | $ | (0.02 | ) | $ | 0.04 | $ | (0.05 | ) | $ | — | $ | (0.46 | ) | $ | 1.42 | |||||||||||||||
| Diluted |
$ | 0.03 | $ | (0.02 | ) | $ | 0.04 | $ | (0.05 | ) | $ | — | $ | (0.46 | ) | $ | 1.42 | |||||||||||||||
| Cash dividends declared by common share |
$ | 0.26 | $ | 0.42 | $ | — | $ | — | $ | — | $ | — | $ | 0.12 | ||||||||||||||||||
| As a % of Revenue: |
||||||||||||||||||||||||||||||||
| Operating Income |
13.9% | 9.8% | 9.3% | 3.6% | —% | (33.4% | ) | 12.4% | ||||||||||||||||||||||||
| Net Income (Loss) |
3.2% | (1.7% | ) | 4.7% | (6.3% | ) | —% | (28.7% | ) | 11.9% | ||||||||||||||||||||||
|
|
|
|
|
|||||||||||||||||||||||||||||
| Balance Sheet Data: |
||||||||||||||||||||||||||||||||
| Shareholders’ Equity (Deficit) |
$ | 883 | $ | 1,683 | $ | 2,971 | $ | 2,813 | $ | (53 | ) | $ | 72 | |||||||||||||||||||
| Total Assets |
7,999 | 8,215 | 8,358 | 8,220 | — | 2,223 | ||||||||||||||||||||||||||
| Postretirement and Postemployment Benefits |
77 | 116 | 106 | 117 | — | 112 | ||||||||||||||||||||||||||
| Long-term Debt, Deferred Tax Liability and Other Long-Term Liabilities |
6,107 | 5,573 | 4,488 | 4,555 | — | 1,393 | ||||||||||||||||||||||||||
|
|
||||||||||||||||||||||||||||||||
| (1) | On October 23, 2009, Healthcare Technology Holdings, Inc. (the “Company”) was formed by investment entities affiliated with TPG Capital, L.P., CPP Investment Board Private Holdings Inc. and Leonard Green & Partners, L.P (collectively, the “Sponsors”). On December 20, 2013, the Company changed its name to IMS Health Holdings, Inc. On February 26, 2010, the Company acquired 100% of the outstanding shares of IMS Health Incorporated (“IMS Health”) through its wholly owned subsidiary Healthcare Technology Acquisition Inc. (the “Merger”). The Company was formed for the purpose of consummating the Merger with IMS Health and its subsidiaries and had no operations from inception other than its investment in IMS Health and costs incurred associated with its formation and the Merger. |
| Successor—The financial information as of December 31, 2013, 2012, 2011, 2010 and 2009 and for the years ended December 31, 2013, 2012, 2011 and 2010 and October 23, 2009 through December 31, 2009 include the accounts of the Company for the entire period and IMS Health from the closing of the Merger on February 26, 2010. |
| Predecessor—The financial information as of December 31, 2009 and for the period January 1, 2010 to February 26, 2010 and the year ended December 31, 2009, include the accounts of IMS Health (our predecessor). |
| The results of the Successor are not comparable to the results of the Predecessor due to the difference in the basis of presentation of purchase accounting as compared to historical cost. |
| (2) | The years ended 2013, 2012, 2011 and 2010 (successor), October 23, 2009 through December 31, 2009 (successor), January 1, 2010 through February 26, 2010 (predecessor), and the year ended 2009 (predecessor) include severance, impairment and other charges of $16 million, $48 million, $31 million, $54 million, $—, ($13) million and $144 million, respectively (see Note 6). The years ended 2013, 2012, 2011, and 2010 (successor), October 23, 2009 through December 31, 2009 (successor), January 1, 2010 through February 26, 2010 (predecessor) and the year ended 2009 (predecessor) include merger costs of $— million, $2 million, $23 million, $65 million, $53 million, $45 million and $11 million, respectively, related to the Company’s acquisition of IMS Health. (See Note 4). |
F-56
Table of Contents
Schedule I—Condensed financial information
IMS Health Holdings, Inc.
Parent Company only
Condensed statements of financial position
| December 31, | ||||||||
| (Dollar in millions) | 2013 | 2012 | ||||||
|
|
||||||||
| Assets: |
||||||||
| Current Assets: |
||||||||
| Other current assets |
$ | 6 | $ | 5 | ||||
| Amounts receivable from subsidiaries |
17 | 16 | ||||||
|
|
|
|||||||
| Total Current Assets |
23 | 21 | ||||||
|
|
|
|||||||
| Investment in subsidiaries |
903 | 1,709 | ||||||
| Other assets |
39 | 32 | ||||||
|
|
|
|||||||
| Total Assets |
$ | 965 | $ | 1,762 | ||||
|
|
|
|||||||
| Liabilities and Shareholders’ Equity: |
||||||||
| Current Liabilities: |
||||||||
| Other current liabilities |
$ | 1 | $ | — | ||||
| Amounts payable to subsidiaries |
81 | 79 | ||||||
|
|
|
|||||||
| Total Liabilities |
82 | 79 | ||||||
|
|
|
|||||||
| Shareholders’ Equity: |
||||||||
| Total Shareholders’ Equity |
883 | 1,683 | ||||||
|
|
|
|||||||
| Total Liabilities and Shareholders’ Equity |
$ | 965 | $ | 1,762 | ||||
|
|
||||||||
F-57
Table of Contents
IMS Health Holdings, Inc.
Parent Company only
Condensed statements of comprehensive (loss) income
| Year ended December 31, | ||||||||||||
| (Dollar in millions) | 2013 | 2012 | 2011 | |||||||||
|
|
||||||||||||
| Operating costs of information |
$ | 3 | $ | 2 | $ | 1 | ||||||
| Direct and incremental costs of technology services |
2 | 1 | 1 | |||||||||
| Selling and administrative expenses |
17 | 16 | 16 | |||||||||
|
|
|
|||||||||||
| Operating loss before benefit from income taxes and equity in net income (loss) of subsidiaries |
(22 | ) | (19 | ) | (18 | ) | ||||||
|
|
|
|||||||||||
| Benefit from income taxes |
7 | 8 | 7 | |||||||||
| Equity in net income (loss) of subsidiaries |
97 | (31 | ) | 122 | ||||||||
|
|
|
|||||||||||
| Net Income (Loss) |
$ | 82 | $ | (42 | ) | $ | 111 | |||||
|
|
|
|||||||||||
| Other Comprehensive (Loss) Income: |
||||||||||||
| Cumulative translation adjustments (net of taxes of $—, $7 and $(3), respectively) |
$ | (183 | ) | $ | (49 | ) | $ | 51 | ||||
| Change in derivatives in OCI (net of taxes of $(4), $(2), and $3, respectively) |
9 | 3 | (6 | ) | ||||||||
| Change in derivatives from OCI to earnings (net of taxes of $5, $2 and $(7), respectively) |
(9 | ) | (4 | ) | 13 | |||||||
| Postretirement and postemployment adjustments (net of taxes of $(16), $5 and $9, respectively) |
24 | (17 | ) | (22 | ) | |||||||
|
|
|
|||||||||||
| Other Comprehensive (Loss) Income |
(159 | ) | (67 | ) | 36 | |||||||
|
|
|
|||||||||||
| Total Comprehensive (Loss) Income |
$ | (77 | ) | $ | (109 | ) | $ | 147 | ||||
|
|
||||||||||||
F-58
Table of Contents
IMS Health Holdings, Inc.
Parent Company only
Condensed statements of cash flows
| Year ended December 31, | ||||||||||||
| (Dollar in millions) | 2013 | 2012 | 2011 | |||||||||
|
|
||||||||||||
| Net Cash Provided by (Used in) Operating Activities |
$ | — | $ | — | $ | — | ||||||
|
|
|
|||||||||||
| Net Cash Provided by (Used in) Investing Activities |
— | — | — | |||||||||
|
|
|
|||||||||||
| Net Cash Provided by (Used in) Financing Activities |
— | — | — | |||||||||
|
|
|
|||||||||||
| Increase (Decrease) in Cash and Cash Equivalents |
— | — | — | |||||||||
| Cash and Cash Equivalents, Beginning of Period |
— | — | — | |||||||||
|
|
|
|||||||||||
| Cash and Cash Equivalents, End of Period |
$ | — | $ | — | $ | — | ||||||
|
|
|
|||||||||||
| Non-Cash Investing and Financing Activities: |
||||||||||||
| Dividends paid |
$ | (753 | ) | $ | (1,202 | ) | $ | — | ||||
|
|
||||||||||||
F-59
Table of Contents
IMS Health Holdings, Inc.
Parent Company only
Notes to condensed financial statements
Basis of presentation. IMS Health Holdings, Inc. (the “Parent Company”), has accounted for the earnings of its subsidiaries under the equity method of accounting in these unconsolidated condensed financial statements. There are restrictions on the Parent Company’s ability to obtain funds from any of its subsidiaries. Accordingly, these condensed financial statements have been presented on a Parent-only basis. The notes to the condensed financial statements are an integral part of these condensed financial statements.
Dividends. In August 2013, the Parent Company declared and paid a dividend to shareholders of $0.26 per share for a total of $753 million. In October 2012, the Parent Company declared and paid a dividend to shareholders of $0.42 per share for a total of $1,202 million. Both dividends were paid by a subsidiary of the Parent Company.
Commitments and contingencies. The Parent Company had no material commitments during the reported periods.
F-60
Table of Contents
Schedule II—Valuation and qualifying accounts
For the years ended December 31, 2013, 2012 and 2011
| (Dollars in millions) COL. A |
COL. B | COL. C | COL. D | COL. E | ||||||||||||||||
|
|
||||||||||||||||||||
| Additions | ||||||||||||||||||||
| Balance beginning of period |
Charged to costs and expenses |
Charged to other accounts |
Deductions | Balance at end of period |
||||||||||||||||
|
|
||||||||||||||||||||
| Valuation allowance for deferred income taxes: |
||||||||||||||||||||
| For the Year Ended December 31, 2013 |
$ | 45 | $ | 9 | (a) | $ | — | $ | 5 | $ | 49 | |||||||||
| For the Year Ended December 31, 2012 |
40 | 8 | (a) | — | 3 | 45 | ||||||||||||||
| For the Year Ended December 31, 2011 |
34 | 11 | (a) | — | 5 | 40 | ||||||||||||||
|
|
||||||||||||||||||||
Notes:
| a) | Valuation allowances on assets related to additional Net Operating Losses created during the year where, based on available evidence, it is more likely than not that such assets will not be realized. |
F-61
Table of Contents
Shares
IMS Health Holdings, Inc.
Common Stock
Prospectus
| J.P. Morgan | Goldman, Sachs & Co. | Morgan Stanley | ||||
| BofA Merrill Lynch | Barclays | Deutsche Bank Securities | Wells Fargo Securities | |||
| TPG Capital BD, LLC | HSBC | SunTrust Robinson Humphrey | Mizuho Securities | RBC Capital Markets |
| Piper Jaffray | William Blair | Drexel Hamilton | Leerink Partners | Stifel | ||||||
, 2014
Through and including , 2014 (25 days after the commencement of this offering), all dealers that effect transactions in shares of our common stock, whether or not participating in this offering, may be required to deliver a prospectus. This delivery is in addition to a dealer’s obligation to deliver a prospectus when acting as an underwriter and with respect to their unsold allotments or subscriptions.
Table of Contents
Part II
Information not required in prospectus
Item 13. Other expenses of issuance and distribution
The following table sets forth the costs and expenses, other than the underwriting discounts and commissions, payable by the registrant in connection with the sale of common stock being registered. All amounts are estimates except for the SEC registration fee, the FINRA filing fee and the NYSE listing fee.
| Item | Amount to be paid |
|||
|
|
||||
| SEC registration fee |
$ | 12,880 | ||
| FINRA filing fee |
15,500 | |||
| NYSE listing fee |
* | |||
| Blue sky fees and expenses |
* | |||
| Printing and engraving expenses |
* | |||
| Legal fees and expenses |
* | |||
| Accounting fees and expenses |
* | |||
| Transfer Agent fees and expenses |
* | |||
| Miscellaneous expenses |
* | |||
|
|
|
|||
| Total |
$ | * | ||
|
|
||||
| * | To be completed by amendment. |
Item 14. Indemnification of directors and officers
Section 102(b)(7) of the General Corporation Law of the State of Delaware (the “DGCL”) enables a corporation to eliminate or limit the personal liability of a director for violations of the director’s fiduciary duty, except (i) for any breach of the director’s duty of loyalty to the corporation or its stockholders, (ii) for acts or omissions not in good faith or which involve intentional misconduct or a knowing violation of law, (iii) for liability of directors for unlawful payment of dividends or unlawful stock purchase or redemptions pursuant to Section 174 of the DGCL or (iv) for any transaction from which a director derived an improper personal benefit. Our certificate of incorporation includes a provision that eliminates the personal liability of directors for monetary damages for actions taken as a director to the fullest extent authorized by the DGCL.
Section 145(a) of the DGCL provides in relevant part that a corporation may indemnify any person who was or is a party or is threatened to be made a party to any threatened, pending or completed action, suit or proceeding, whether civil, criminal, administrative or investigative (other than an action by or in the right of the corporation), by reason of the fact that such person is or was a director or officer of the corporation, or is or was serving at the request of the corporation as a director or officer of another entity, against expenses (including attorneys’ fees), judgments, fines and amounts paid in settlement actually and reasonably incurred by such person in connection with such action, suit or proceeding if such person acted in good faith and in a manner such person reasonably believed to be in or not opposed to the best interests of the corporation, and, with respect to any criminal action or proceeding, had no reasonable cause to believe such person’s conduct was unlawful. The termination of any action, suit or proceeding by judgment, order, settlement, conviction or upon a plea of nolo contendere or its equivalent shall
II-1
Table of Contents
not, of itself, create a presumption that such person did not act in good faith and in a manner which such person reasonably believed to be in or not opposed to the best interests of the corporation, and, with respect to any criminal action or proceeding, had reasonable cause to believe that such person’s conduct was unlawful.
Section 145(b) of the DGCL provides in relevant part that a corporation may indemnify any person who was or is a party or is threatened to be made a party to any threatened, pending or completed action or suit by or in the right of the corporation to procure a judgment in its favor by reason of the fact that the person is or was a director or officer of the corporation, or is or was serving at the request of the corporation as a director or officer of another entity, against expenses (including attorneys’ fees) actually and reasonably incurred by such person in connection with the defense or settlement of such action or suit if the person acted in good faith and in a manner the person reasonably believed to be in or not opposed to the best interests of the corporation and except that no indemnification shall be made in respect of any claim, issue or matter as to which such person shall have been adjudged to be liable to the corporation unless and only to the extent that the Court of Chancery or the court in which such action or suit was brought shall determine upon application that, despite the adjudication of liability but in view of all the circumstances of the case, such person is fairly and reasonably entitled to indemnity for such expenses which the Court of Chancery or such other court shall deem proper.
Our certificate of incorporation provides that we will indemnify our directors and officers to the fullest extent permitted by law. Our certificate of incorporation also provides that the indemnification and advancement of expenses provided by, or granted pursuant to the certificate of incorporation, are not exclusive of any other rights to which those seeking indemnification or advancement of expenses may be entitled under any bylaw, agreement, vote of stockholders or otherwise. Section 145(f) of the DGCL further provides that a right to indemnification or to advancement of expenses arising under a provision of the certificate of incorporation shall not be eliminated or impaired by an amendment to such provision after the occurrence of the act or omission which is the subject of the civil, criminal, administrative or investigative action, suit or proceeding for which indemnification or advancement of expenses is sought.
We have also entered into indemnification agreements with certain of our directors and officers. Such agreements generally provide for indemnification by reason of being our director or officer, as the case may be. These agreements are in addition to the indemnification provided by our certificate of incorporation and bylaws.
The underwriting agreement provides that the underwriters are obligated, under certain circumstances, to indemnify our directors, officers and controlling persons against certain liabilities, including liabilities under the Securities Act. Please refer to the form of underwriting agreement filed as Exhibit 1.1 hereto.
We also maintain officers’ and directors’ liability insurance that insures against liabilities that our officers and directors may incur in such capacities. Section 145(g) of the DGCL provides that a corporation shall have power to purchase and maintain insurance on behalf of any person who is or was a director or officer of the corporation, or is or was serving at the request of the corporation as a director or officer of another entity, against any liability asserted against such person and incurred by such person in any such capacity, or arising out of such person’s status as such, whether or not the corporation would have the power to indemnify such person against such liability under that section.
II-2
Table of Contents
Item 15. Recent sales of unregistered securities
In the three years preceding the filing of this registration statement, we have issued the following securities that were not registered under the Securities Act. No underwriters were involved in any of the following transactions.
Equity Securities
During the year ended December 31, 2011, we issued a total of 2,060,000 shares of common stock in connection with the cashless exercise of stock options. We also issued 2,050,000 shares of common stock in connection with restricted stock units previously issued and granted 100,000 restricted stock units during this period. We also granted to certain eligible participants 18,500,000 options to purchase our common stock at a weighted average exercise price of $1.12, as well as 1,270,000 cash-settled stock appreciation rights (herein referred to as “Phantom SARs”) that will be settled in cash in connection with this offering. These securities were issued without registration in reliance on the exemptions afforded by Section 4(a)(2) of the Securities Act and Rule 701 promulgated under the Securities Act.
During the year ended December 31, 2012, we issued a total of 3,532,000 shares of common stock in connection with the cashless exercise of stock options. We also issued 13,100,000 shares of common stock in connection with restricted stock units previously issued and granted 164,286 restricted stock units during this period. We also granted to certain eligible participants 9,790,000 options to purchase our common stock at a weighted average exercise price of $1.24, as well as 1,620,000 Phantom SARs that will be settled in cash in connection with this offering. These securities were issued without registration in reliance on the exemptions afforded by Section 4(a)(2) of the Securities Act and Rule 701 promulgated under the Securities Act.
Since December 31, 2012, we have issued a total of 2,780,000 shares of common stock in connection with the cashless exercise of stock options. We also issued 142,856 shares of common stock in connection with restricted stock units previously issued and granted 574,376 restricted stock units during this period. We also granted to certain eligible participants 14,625,000 options to purchase our common stock at a weighted average exercise price of $1.30, as well as 5,110,000 Phantom SARs that will be settled in cash in connection with this offering. These securities were issued without registration in reliance on the exemptions afforded by Section 4(a)(2) of the Securities Act and Rule 701 promulgated under the Securities Act.
Debt Securities
On October 23, 2012, IMS Health, Incorporated issued an aggregate principal amount of $999.6 million of 12.5% Senior Notes in connection with an exchange offer and consent solicitation to exchange previously issued notes for these notes. The 12.5% Senior Notes were issued without registration in reliance on the exemptions afforded by Section 4(a)(2) of the Securities Act, as a transaction by an issuer not involving a public offering, to “qualified institutional buyers” in the United States as defined in Rule 144A of the Securities Act, and outside the United States pursuant to Regulation S under the Securities Act.
On October 23, 2012 IMS Health, Incorporated issued an aggregate principal amount of $500.0 million of 6% Senior Notes, which was used to fund a distribution to the stockholders of IMS Health Holdings, Inc. Interest on the 6% Senior Notes is payable semi-annually on May 1 and November 1 of each year. The initial purchasers for the 6% Senior notes were Goldman, Sachs &
II-3
Table of Contents
Co. and Merrill Lynch, Pierce, Fenner & Smith Incorporated. The 6% Senior Notes were offered and sold to qualified institutional buyers pursuant to Rule 144A under the Securities Act or to non-U.S. investors outside the United States in compliance with Regulation S of the Securities Act.
On August 6, 2013, Healthcare Technology Intermediate, Inc. issued an aggregate principal amount of $750.0 million of Senior PIK Notes due 2018, which was used to fund a distribution to the stockholders of IMS Health Holdings, Inc. The initial purchasers for the Senior PIK Notes were Goldman, Sachs & Co., Merrill Lynch, Pierce, Fenner & Smith Incorporated, Barclays Capital Inc., Deutsche Bank Securities Inc., HSBC Securities (USA) Inc., J.P. Morgan Securities LLC, Wells Fargo Securities, LLC, Fifth Third Securities, Inc., Mizuho Securities USA Inc., RBC Capital Markets, LLC, SunTrust Robinson Humphrey, Inc. and TPG Capital BD, LLC. The Senior PIK Notes were offered and sold to qualified institutional buyers pursuant to Rule 144A under the Securities Act or to non-U.S. investors outside the United States in compliance with Regulation S of the Securities Act.
Item 16. Exhibits and financial statement schedules
(a) Exhibits
See Exhibit Index following the signature page.
(b) Financial statement schedules
Schedules not listed above have been omitted because the information required to be set forth therein is not applicable or is shown in the financial statements or notes thereto.
Item 17. Undertakings
The undersigned Registrant hereby undertakes:
(1) That for purposes of determining any liability under the Securities Act of 1933, the information omitted from the form of prospectus filed as part of this registration statement in reliance upon Rule 430A and contained in a form of prospectus filed by the Registrant pursuant to Rule 424(b)(1) or (4) or 497(h) under the Securities Act of 1933 shall be deemed to be part of this registration statement as of the time it was declared effective.
(2) That for the purpose of determining any liability under the Securities Act of 1933, each post-effective amendment that contains a form of prospectus shall be deemed to be a new registration statement relating to the securities offered therein, and the offering of such securities at that time shall be deemed to be the initial bona fide offering thereof.
(3) For the purpose of determining liability under the Securities Act of 1933 to any purchaser, if the registrant is subject to Rule 430C, each prospectus filed pursuant to Rule 424(b) as part of a registration statement relating to an offering, other than registration statements relying on Rule 430B or other than prospectuses filed in reliance on Rule 430A, shall be deemed to be part of and included in the registration statement as of the date it is first used after effectiveness. Provided, however, that no statement made in a registration statement or prospectus that is part of the registration statement or made in a document incorporated or deemed incorporated by reference into the registration statement or prospectus that is part of the registration statement
II-4
Table of Contents
will, as to a purchaser with a time of contract of sale prior to such first use, supersede or modify any statement that was made in the registration statement or prospectus that was part of the registration statement or made in any such document immediately prior to such date of first use.
(4) The undersigned registrant undertakes that in a primary offering of securities of the undersigned registrant pursuant to this registration statement, regardless of the underwriting method used to sell the securities to the purchaser, if the securities are offered or sold to such purchaser by means of any of the following communications, the undersigned registrant will be a seller to the purchaser and will be considered to offer or sell such securities to such purchaser:
(i) Any preliminary prospectus or prospectus of the undersigned registrant relating to the offering required to be filed pursuant to Rule 424;
(ii) Any free writing prospectus relating to the offering prepared by or on behalf of the undersigned registrant or used or referred to by the undersigned registrant;
(iii) The portion of any other free writing prospectus relating to the offering containing material information about the undersigned registrant or its securities provided by or on behalf of the undersigned registrant; and
(iv) Any other communication that is an offer in the offering made by the undersigned registrant to the purchaser.
(5) Insofar as indemnification for liabilities arising under the Securities Act of 1933 may be permitted to directors, officers and controlling persons of the registrant pursuant to the foregoing provisions, or otherwise, the registrant has been advised that in the opinion of the Securities and Exchange Commission such indemnification is against public policy as expressed in the Act and is, therefore, unenforceable. In the event that a claim for indemnification against such liabilities (other than the payment by the registrant of expenses incurred or paid by a director, officer or controlling person of the registrant in the successful defense of any action, suit or proceeding) is asserted by such director, officer or controlling person in connection with the securities being registered, the registrant will, unless in the opinion of its counsel the matter has been settled by controlling precedent, submit to a court of appropriate jurisdiction the question whether such indemnification by it is against public policy as expressed in the Act and will be governed by the final adjudication of such issue.
(6) To provide to the underwriters at the closing specified in the underwriting agreement certificates in such denominations and registered in such names as required by the underwriters to permit prompt delivery to each purchaser.
II-5
Table of Contents
Signatures
Pursuant to the requirements of the Securities Act of 1933, the registrant has duly caused this registration statement to be signed on its behalf by the undersigned, thereunto duly authorized, in the city of Danbury, Connecticut on February 13, 2014.
| IMS HEALTH HOLDINGS, INC. | ||
| By: | /s/ Ari Bousbib | |
| Name: | Ari Bousbib | |
| Title: | Chairman, Chief Executive Officer & President | |
***
Pursuant to the requirements of the Securities Act of 1933, this registration statement has been signed by the following persons in the capacities and on the dates indicated.
| Signature | Title | Date | ||
|
| ||||
| /s/ Ari Bousbib Ari Bousbib |
Chairman of the Board of Directors, Chief Executive Officer & President (Principal Executive Officer) |
February 13, 2014 | ||
| /s/ Ronald E. Bruehlman Ronald E. Bruehlman |
Senior Vice President and Chief Financial Officer (Principal Financial Officer) |
February 13, 2014 | ||
| /s/ Harshan Bhangdia Harshan Bhangdia |
Vice President and Controller (Principal Accounting Officer) | February 13, 2014 | ||
| * Bryan M. Taylor |
Director | February 13, 2014 | ||
| * André Bourbonnais |
Director | February 13, 2014 | ||
| * John G. Danhakl |
Director | February 13, 2014 | ||
| * David Lubek |
Director | February 13, 2014 | ||
| * Todd B. Sisitsky |
Director | February 13, 2014 | ||
II-6
Table of Contents
| Signature | Title | Date | ||
| * Ronald A. Rittenmeyer |
Director | February 13, 2014 | ||
| * Jeffrey K. Rhodes |
Director | February 13, 2014 | ||
| * Nehal Raj |
Director | February 13, 2014 | ||
| * Sharad S. Mansukani |
Director | February 13, 2014 | ||
|
| ||||
| *By: |
/s/ Harvey A. Ashman | |
|
Attorney-in-fact | ||
II-7
Table of Contents
| Exhibit number |
Exhibit title | |
|
| ||
| 1.1* | Form of Underwriting Agreement | |
| 3.1* | Amended and Restated Certificate of Incorporation of IMS Health Holdings, Inc. | |
| 3.2* | Amended and Restated Bylaws of IMS Health Holdings, Inc. | |
| 4.1** | Indenture, dated February 26, 2010, among IMS Health Incorporated, as Issuer, the Guarantors named on the Signature Pages thereto, and U.S. Bank National Association, as Trustee | |
| 4.2** | First Supplemental Indenture, dated as of March 14, 2011, among IMS Health Incorporated, as Issuer, the Guarantors listed on the signature pages thereto, and U.S. Bank National Association, as Trustee | |
| 4.3** | Second Supplemental Indenture, dated as of July 8, 2011, among Med-Vantage, Inc., as Guaranteeing Subsidiary, and U.S. Bank National Association, as Trustee | |
| 4.4** | Third Supplemental Indenture, dated as of September 28, 2012, among TTC Acquisition Corporation and The Tar Heel Trading Company, LLC, each as a Guaranteeing Subsidiary, and U.S. Bank National Association, as Trustee | |
| 4.5** | Fourth Supplemental Indenture, dated as of October 24, 2012, among IMS Health Incorporated, as Issuer, the Guarantors listed on the signature pages thereto, and U.S. Bank National Association, as Trustee | |
| 4.6** | Fifth Supplemental Indenture, dated as of May 28, 2013, between Appature Inc., as Guaranteeing Subsidiary, and U.S. Bank National Association, as Trustee | |
| 4.7** | Exchange Note Indenture, dated as of October 24, 2012, among IMS Health Incorporated, as Issuer, the Guarantors named on the signature pages thereto, and U.S. Bank National Association, as Trustee | |
| 4.8** | First Supplemental Indenture, dated as of May 28, 2013, between Appature Inc., as Guaranteeing Subsidiary, and U.S. Bank National Association, as Trustee | |
| 4.9** | Senior Note Indenture, dated as of October 24, 2012, among IMS Health Incorporated, as Issuer, the Guarantors party thereto, and Wells Fargo Bank, National Association, as Trustee | |
| 4.10** | First Supplemental Indenture, dated as of May 28, 2013, between Appature Inc., as Guaranteeing Subsidiary, and Wells Fargo Bank, National Association, as Trustee | |
| 4.11** | Indenture, dated as of August 6, 2013, between Healthcare Technology Intermediate, Inc., as Issuer, and Wells Fargo Bank, National Association, as Trustee | |
| 4.12** | Registration and Preemptive Rights Agreement, dated as of February 26, 2010, by and among IMS Health Holdings, Inc. and each of the Managers and Manager Designees named therein | |
| 5.1* | Opinion of Ropes & Gray LLP | |
| 10.1* | Amended and Restated Shareholders’ Agreement by and among TPG Partners V, L.P., TPG FOF V-A, L.P., TPG FOF V-B, L.P., TPG Partners VI, L.P., TPG FOF VI SPV, L.P., TPG Biotechnology Partners III, L.P., TPG Iceberg Co-Invest LLC, CPP Investment Board Private Holdings Inc., Green Equity Investors V, L.P., Green Equity Investors Side V, L.P., LPG Iceberg Coinvest, LLC and IMS Health Holdings, Inc. | |
| 10.2** | Management Stockholders Agreement, dated as of February 26, 2010, by and among IMS Health Holdings, Inc., Healthcare Technology Acquisition, Inc., IMS Health Incorporated, and the Investors and the Managers named therein | |
|
| ||
Table of Contents
| Exhibit number |
Exhibit title | |
|
| ||
| 10.3* | Management Services Agreement by and among Healthcare Technology Acquisition, Inc., Healthcare Technology Intermediate, Inc., Healthcare Technology Intermediate Holdings, Inc., IMS Health Holdings, Inc., a Delaware corporation, TPG Capital, L.P., TPG Growth, LLC, CPP Investment Board Private Holdings Inc. and Leonard Green & Partners, L.P. | |
| 10.4 | Second Amended and Restated Credit and Guaranty Agreement, dated as of October 24, 2012, among IMS Health Incorporated, as a Borrower and a Guarantor, IMS AG, as a Borrower, IMS Japan K.K., as a Borrower, Healthcare Technology Intermediate Holdings, Inc., as a Guarantor, Certain Subsidiaries of IMS Health Incorporated, as Guarantors, Various Lenders, Bank of America, N.A. and Goldman Sachs Lending Partners LLC, as Joint Lead Arrangers and Joint Lead Bookrunners, Bank of America, N.A., as Administrative Agent, Collateral Agent, Swing Line Lender, and Issuing Bank, Goldman Sachs Lending Partners LLC, as Syndication Agent, Barclays Bank PLC, Deutsche Bank Securities Inc., HSBC Securities (USA) Inc., JPMorgan Chase Bank, N.A., Wells Fargo Bank, National Association, as Co-Documentation Agents, and Fifth Third Bank, Mizuho Corporate Bank, Ltd., RBC Capital Markets, Suntrust Bank as Senior Managing Agents | |
| 10.5** | First Amendment to the Second Amended and Restated Credit and Guaranty Agreement, dated as of February 6, 2013, among IMS Health Incorporated, IMS AG, IMS Japan K.K., each a Borrower, Bank of America, N.A., as Administrative Agent, each Tranche B-1 Dollar Term Lender, and each Tranche B-1 Euro Term Lender | |
| 10.6* | 2013 IMS Health Annual Incentive Compensation Plan | |
| 10.7** | IMS Health Incorporated Employee Protection Plan (as amended and restated effective as of September 1, 2009) | |
| 10.8** | First Amendment to the IMS Health Incorporated Employee Protection Plan (effective January 1, 2011) | |
| 10.9 | Second Amendment to the IMS Health Incorporated Employee Protection Plan (effective January 1, 2012) | |
| 10.10** | IMS Health Incorporated Defined Contribution Executive Retirement Plan (as amended and restated) | |
| 10.11** | IMS Health Incorporated Retirement Excess Plan (as amended and restated effective as of January 1, 2005) | |
| 10.12** | First Amendment to the IMS Health Incorporated Retirement Excess Plan (dated March 17, 2009) | |
| 10.13** | Second Amendment to the IMS Health Incorporated Retirement Excess Plan (dated December 8, 2009) | |
| 10.14** | Third Amendment to the IMS Health Incorporated Retirement Excess Plan (dated April 5, 2011) | |
| 10.15** | IMS Health Incorporated Savings Equalization Plan (as amended and restated effective as of January 1, 2011) | |
| 10.16 | Healthcare Technology Holdings, Inc. 2010 Equity Incentive Plan (as amended and restated) | |
| 10.17** | Form of Time- and Performance-Based Stock Option Award under the 2010 Equity Incentive Plan | |
|
| ||
Table of Contents
| Exhibit number |
Exhibit title | |
|
| ||
| 10.18** | Form of Time-Based Stock Option Award under the 2010 Equity Incentive Plan | |
| 10.19** | Form of Director Stock Option Award under the 2010 Equity Incentive Plan | |
| 10.20** | Form of Restricted Stock Unit Award under the 2010 Equity Incentive Plan | |
| 10.21** | Form of Director Restricted Stock Unit Award under the 2010 Equity Incentive Plan | |
| 10.22** | Form of Rollover Stock Appreciation Right Award under the 2010 Equity Incentive Plan | |
| 10.23 | Senior Management Nonstatutory Option Agreement between Healthcare Technology Holdings, Inc. and Ari Bousbib dated September 1, 2010 | |
| 10.24 | Senior Management Nonstatutory Option Agreement between Healthcare Technology Holdings, Inc. and Ari Bousbib dated December 1, 2010 | |
| 10.25* | Amended and Restated Employment Agreement among IMS Health Holdings, Inc., IMS Health Incorporated and Ari Bousbib | |
| 10.26* | 2014 Incentive and Stock Award Plan | |
| 10.27* | Form of Director and Officer Indemnification Agreement | |
| 10.28* | Form of Restricted Stock Unit Award Agreement under the 2010 Equity Incentive Plan (2014 Grants) | |
| 10.29* | Restricted Stock Unit Award Agreement between IMS Health Holdings, Inc. and Ari Bousbib dated February 12, 2014 | |
| 21.1** | List of Subsidiaries | |
| 23.1 | Consent of PricewaterhouseCoopers LLP | |
| 23.3* | Consent of Ropes & Gray LLP (included in the opinion filed as Exhibit 5.1) | |
| 24.1** | Powers of Attorney (included in the signature pages of this Registration Statement) | |
|
| ||
| * | To be filed by amendment. |
| ** | Previously filed. |