Attached files
| file | filename |
|---|---|
| 8-K - FORM 8-K - HOLOGIC INC | d676722d8k.htm |
 Presentation to
Lenders Presentation to Lenders
February 13, 2014
February 13, 2014
Exhibit 99.1 |
 Safe Harbor
Statement 2
This presentation contains forward-looking information that involves risks and
uncertainties, including statements about the Company’s plans, objectives,
expectations and intentions. Such statements include, without limitation: financial or other
information included herein based upon or otherwise incorporating judgments or
estimates relating to future performance, events or expectations; the Company’s strategies, positioning, resources, capabilities, and expectations for
future performance; and the Company's outlook and financial and other guidance. These
forward-looking statements are based upon assumptions made by the Company as of the
date hereof and are subject to known and unknown risks and uncertainties that could cause actual results to differ materially from those
anticipated.
Risks and uncertainties that could adversely affect the Company’s business and prospects,
and otherwise cause actual results to differ materially from those anticipated, include
without limitation: the ability of the Company to successfully manage recent and ongoing leadership and organizational changes, including the
ability of the Company to attract, motivate and retain key employees; U.S., European and
general worldwide economic conditions and related uncertainties; the Company’s
reliance on third-party reimbursement policies to support the sales and market acceptance of its products, including the possible adverse impact of
government regulation and changes in the availability and amount of reimbursement and
uncertainties for new products or product enhancements; uncertainties regarding the
recently enacted or future healthcare reform legislation, including associated tax provisions, or budget reduction or other cost containment efforts;
changes in guidelines, recommendations and studies published by various organizations that
could affect the use of the Company’s products; uncertainties inherent in the
development of new products and the enhancement of existing products, including FDA approval and/or clearance and other regulatory risks, technical risks,
cost overruns and delays; the risk that products may contain undetected errors or defects or
otherwise not perform as anticipated; risks associated with strategic alliances and the
ability of the Company to realize anticipated benefits of those alliances; risks associated with acquisitions, including without limitation, the
Company’s ability to successfully integrate acquired businesses, the risks that the
acquired businesses may not operate as effectively and efficiently as expected even if
otherwise successfully integrated, the risks that acquisitions may involve unexpected costs or unexpected liabilities including the risks and challenges associated
with the Company’s recent acquisition of Gen-Probe and operations in China; the risks
of conducting business internationally, including the effect of exchange rate
fluctuations on those operations; manufacturing risks, including the Company’s reliance
on a single or limited source of supply for key components, and the need to comply with
especially high standards for the manufacture of many of its products; the Company’s ability to predict accurately the demand for its products, and
products under development, and to develop strategies to address its markets successfully; the
early stage of market development for certain of the Company’s products; the
Company’s leverage risks, including the Company’s obligation to meet payment obligations and financial covenants associated with its debt; risks
related to the use and protection of intellectual property; expenses, uncertainties and
potential liabilities relating to litigation, including, without limitation,
commercial, intellectual property, employment and product liability litigation; technical
innovations that could render products marketed or under development by the Company
obsolete; competition; and the Company’s ability to attract and retain qualified personnel.
The risks included above are not exhaustive. Other factors that could adversely affect the
company's business and prospects are described in the filings made by the Company with
the SEC. The Company expressly disclaims any obligation or undertaking to release publicly any updates or revisions to any such statements presented
herein to reflect any change in expectations or any change in events, conditions or
circumstances on which any such statements are based. Hologic, Aptima, Cervista, Dimensions, Gen-Probe, MyoSure, NovaSure, Panther, ThinPrep,
TMA and associated logos, as may be used throughout this presentation, are trademarks
and/or registered trademarks of Hologic, Inc. and/or its subsidiaries in the United States and/or other countries.
|
 Hologic, Inc.
("Hologic" or "the Company") (NASDAQ: HOLX) is a leading developer, manufacturer and supplier of premium
diagnostics products, medical imaging systems and surgical products, with an emphasis on
serving the healthcare needs of women
Hologic has continued to demonstrate consistent financial performance
Hologic has continued to generate strong cash flow
Hologic is seeking to reprice its Term Loan B
Transaction Overview
(1)
See the definition of non-GAAP financial measures and the reconciliation of GAAP to
non-GAAP in the Appendix. The Company’s GAAP net loss and GAAP net loss per
share for the same period were $5.4 million and $0.02, respectively
(2)
As provided on February 3, 2014.
(3)
See the definition in the Appendix.
3
—
For
the
quarter
ended
December
28,
2013,
the
Company
generated
$612.4
million
of
revenues,
$94.1
million
of
non-GAAP
net income and $213.5 million of adjusted EBITDA. Non-GAAP earnings per share was
$0.34 (1)
.
—
For
the
quarter
ended
March
29,
2014,
the
Company
expects
to
report
revenues
of
approximately
$605-$615
million and
non-GAAP earnings per share of $0.32-$0.34
(2)
—
As
of
December
28,
2013,
Hologic
had
total
secured
leverage
of
2.2x
and
net
total
leverage
of
4.3x
—
Hologic
has
deleveraged
from
total
secured
leverage
of
2.8x
and
net
total
leverage
of
5.3x
at
the
time
of
the
original deal
in July 2012
—
During
the
quarter
ended
December
28,
2013,
net
cash
provided
by
operating
activities
was
$149.3
million
and
adjusted net cash provided by operating activities was $180.5 million
(3)
—
During
the
quarter
ended
December
28,
2013,
$521.3
million
of
debt
was
repaid |
 Pro Forma
Capitalization Amounts as of December 28, 2013
($ in millions)
4
Source: Public filings. (1) Principal amount is $450 million. Principal amount listed net of
unamortized discount. Conversion price of approximately $23.03 per share.
(2)
Principal amount is $500 million. Principal amount listed net of unamortized discount.
Conversion price of approximately $31.18 per share.
(3)
Principal amount is $370 million. Principal amount listed net of unamortized discount.
Conversion price of approximately $38.59 per share.
(4)
Debt net of $250 million of cash as permitted by Credit Agreement for covenant compliance. (5)
As defined in the Credit Agreement. Includes an increase to the Company’s
adjusted EBITDA of $67 million, as calculated pursuant to the terms of the Credit
Agreement, to reflect the Company’s acquisition of Gen-Probe and certain other adjustments.
Current
Pro Forma
Amount
Amount
Leverage
Coupon
Floor
Maturity
Put Date
Cash
$ 449
$ 449
Revolver ($300mm)
-
-
-
L + 200
-
Aug-17
Term Loan A
932
932
1.0 x
L + 200
-
Aug-17
Extant Term Loan B
1,171
-
-
L + 275
1.00%
Aug-19
New Term Loan B
-
1,171
1.2 x
TBD
TBD
Aug-19
Total Secured Debt
$ 2,103
$ 2,103
2.2 x
Senior Unsecured Notes
1,000
1,000
1.1 x
6.25%
Aug-20
Total Guaranteed Debt
$ 3,103
$ 3,103
3.3 x
2.00% Exchange Convertible Sr. Notes
(1)
396
396
0.4 x
2.00%
Dec-37
Dec-16
2.00% Exchange Convertible Sr. Notes
(2)
467
467
0.5 x
2.00%
Mar-42
Mar-18
2.00% Exchange Convertible Sr. Notes
(3)
336
336
0.4 x
2.00%
Sep-43
Dec-17
Total Debt
$ 4,302
$ 4,302
4.5 x
Net Debt
(4)
$ 4,052
$ 4,052
4.3 x
LTM 12/28/2013 Consolidated Adjusted EBITDA
(5)
$ 951 |
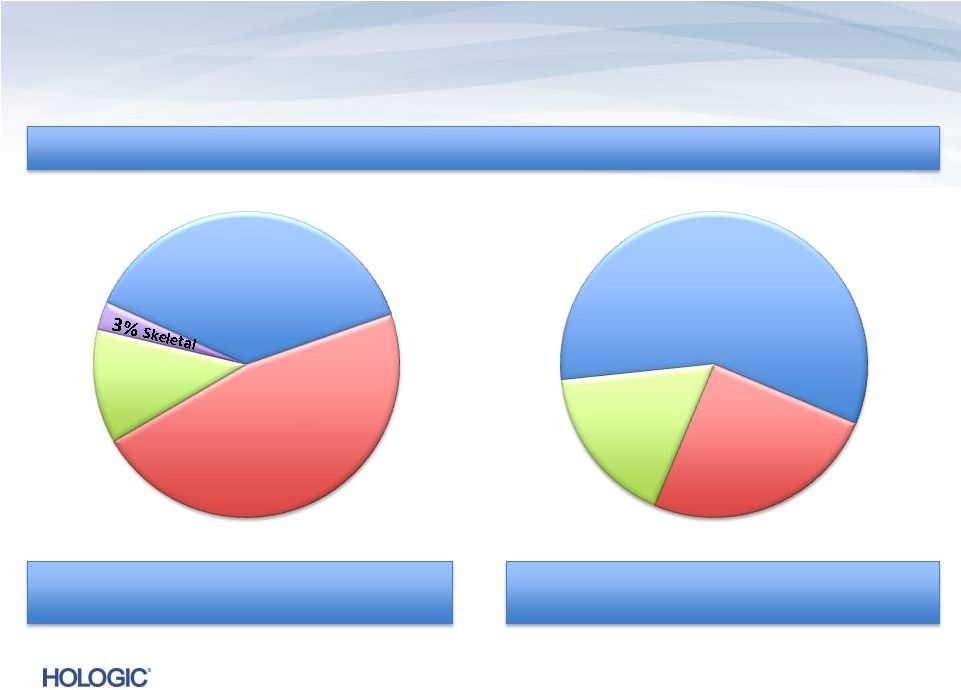
 Consolidated
Q1’14 Revenues of $612.4M (unaudited) Consumables/Service ~80%
Capital Equipment ~20%
Total Revenues by Business Segment
47%
Breast Health
$226.5M
37%
GYN Surgical
$78.8M
13%
Skeletal Health
$21.3M
3%
5
Total Diagnostics
$285.8M
64%
Consumables
20%
Capital
Equipment
16%
Service |
 •
Early stage of a promising replacement cycle with technology
superior to 2D digital
•
Additional peer-reviewed publications further support
adoption
•
Ability to offer class-leading automation to low-
and medium-
volume labs
•
Extends molecular diagnostics into hospital labs, the fastest-
growing market segment
•
Menu expansion on the horizon to further sustain growth
Two Exciting Product Cycles
are Just Beginning
Dimensions 3D Breast Tomosynthesis
Panther System
6 |
 Diagnostics
– Leadership in Cytology and
Molecular Diagnostics
•
Premier automated solutions
•
Proprietary chemistries: TMA (Transcription-mediated
amplification) and Invader
•
Extending leadership from cytology into molecular via
Gen-Probe acquisition
•
Validated by #1 or #2 U.S. market share in key segments*
SHARE
* Hologic Estimates 2012
Cervical
Cytology
CT/NG
Testing
Blood
Screening
HPV
Testing
7 |
 Comprehensive
Cervical Cancer Screening Solution
•
The only FDA approved complete
cervical cancer screening solution
to include liquid-based cytology
+ HPV (high-risk and genotyping)
•
All from our ThinPrep vial, the
gold standard in cervical cytology
•
Thoughtfully designed HPV
products designed to detect
disease by focusing on genes that
matter most:
•
Both Aptima and Cervista
meet the specific needs of our
customers through greater testing
alternatives
8 |
 Breast Health
– Mammography
Leader in Breast Cancer Screening & Diagnosis
–
Market leadership: ~65% of current
U.S. installed base, ~40% OUS
–
Approximate $4 billion
addressable U.S. market
–
Strong competitive advantages
of 3D Dimensions
•
Clinical superiority to 2D
•
First-to-market with no U.S.
Tomo
competition
–
Substantial replacement
cycle expected
Robust Service Offering
–
Recurring revenue stream
driven by system placements
9 |
 3D Dimensions
Tomosynthesis Tomosynthesis…uptake ahead of expectations
–
U.S. installed base of ~11,000 digital systems –
potential for conversion to Tomo
–
Met initial 3-year unit installation goal in U.S. and on track to reach our Fiscal 2014
goal of shipping over 500 in the U.S.
Superior Next-Generation Digital Mammography
10
Superiority
over 2D Digital
Mammography
Improved
Tissue
Visualization
and Detection
Lower
Recall Rates |
 Tomosynthesis
Clinical Efficacy Oslo Tomosynthesis Screening Trial
reported breast cancer screening
with Hologic Tomosynthesis significantly
improves cancer detection
(1)
•
•
Body of clinical evidence continuing to grow
in invasive
cancer detection
40%
overall in
cancer detection
27%
Compared to 2D, U.S. sites report a significant
reduction in recalls with
Hologic Tomosynthesis
20-40% reduction
in recall rates
(based on site practices)
11
(1)
Skaane P. et. al. Comparison of Digital Mammography Alone and Digital Mammography Plus
Tomosynthesis in a Population-based Screening Program. Radiology. 2013 Jan 7
[Epub ahead of print].
(2)
Philpotts L. et al. Initial Experience With Digital Breast Tomosynthesis in Screening
Mammography. Presented at the ARRS 2012, Scientific Session 22 - Breast Imaging:
Screening/Emerging Technologies.
(3)
Destounis S. et al. Experience with Combination 2D/3D Breast Tomosynthesis vs FFDM in
the Screening Environment. Radiological Society of North America annual meeting.
Chicago, Il, 2012.
2-3
All
age
groups
and
breast
densities
reported
to
benefit
from
the
addition
of
Hologic
Tomosynthesis
screening
(1) |
 MyoSure
Hysteroscopic Tissue Removal System •
Minimally-invasive technology to remove fibroids and polyps
•
Dynamic technology in early stages of adoption
•
Potential $300-400 million annual opportunity in the U.S.
•
Product line extensions offer flexibility to spur further adoption
Complemented by a portfolio of surgical
instruments addressing unmet needs in
women’s
health on a global basis
•
Including NovaSure, the market leader in treating abnormal
uterine bleeding with ~60% share in the U.S.
MyoSure a Growth Driver
in GYN Surgical
12 |
 Q1 FY 2014
Overview Key Performance Metrics
Key Performance Metrics
Q1 FY 2014
Q1 FY 2014
Revenues*
Revenues of $612.4 million
•
Net Income*
GAAP net loss of $5.4 million and
non-GAAP net income of $94.1 million
•
Adjusted EBITDA*
$213.5 million
•
Quarter Ended December 28, 2013 (unaudited)
13
Revenues down $18.9 million, or 3.0%, vs. Q1’13
(1)
(and down $32.2 million or 5.0%
vs. Q1’13 non-GAAP revenues)
Non-GAAP net income down $7.6 million, or 7.5%, vs. Q1’13
Down $14.0 million, or 6.1%, vs. Q1’13
* See the definition of the non-GAAP financial measures and the reconciliation of those
measures to the comparable GAAP financial measures in the Appendix.
(1)
On a constant currency basis, total revenues would have decreased to $610.9M*, or 3.2%,
compared to Q1’13. The constant currency revenue amount for Q1’14 is a
non-GAAP number that reflects what revenues in that quarter would have been had the Company applied the foreign currency exchange
rates it used for determining its revenues in Q1’13.
|
 Breakdown of
Q1 FY 2014 Revenues of $612.4M (unaudited) U.S. Revenues ~ 75%
International Revenues ~ 25%
20%
Capital Equipment
64%
Disposables
13%
GYN Surgical
37%
Breast Health
47%
Diagnostic
16%
Service
Four Business Segments
Disposables/Service ~ 80%
Capital Equipment ~ 20%
14 |
 Amendment
Overview Hologic is seeking to reprice its Term Loan B
15
Term Loan B offered at par
101 soft-call refreshed for 6 months |
 |
 Reconciliation
of GAAP to Non-GAAP (unaudited) In thousands, except earnings per share
In thousands, except earnings per share
17
Three Months Ended
Three Months Ended
December 28, 2013
December 28, 2013
December 29, 2012
December 29, 2012
REVENUES
GAAP revenues
$612,448
$631,362
Adjustments primarily related to blood screening collaboration
-
13,275
Non-GAAP revenues
$612,448
$612,448
$644,637
$644,637
EARNINGS PER SHARE
$(0.02)
$0.01
Adjustments to net (loss) earnings (as detailed below)
0.36
0.37
$0.34
$0.34
$0.38
$0.38
GROSS MARGINS
GAAP gross margins
$305,596
$281,673
Adjustments:
Net adjustments to revenues
-
13,275
Amortization of intangible assets
76,666
75,287
Fair value write-up of acquired inventory sold
-
29,876
Fair value adjustment to depreciation expense
1,715
1,797
Acquisition and integration-related costs
2,815
1,141
Other
574
-
Non-GAAP gross margins
$387,366
$387,366
$403,049
$403,049
GROSS MARGIN PERCENTAGE
GAAP gross margin percentage
49.9%
44.6%
Impact of adjustments above
13.3%
17.9%
Non-GAAP gross margin percentage
63.2%
63.2%
62.5%
62.5%
Continued on next page
GAAP (loss) earnings per share – Diluted Non-GAAP
earnings per share – Diluted |
 In
thousands In thousands
Three Months Ended
Three Months Ended
December 28, 2013
December 28, 2013
December 29, 2012
December 29, 2012
OPERATING EXPENSES
GAAP operating expenses
$244,311
$218,444
Adjustments:
Amortization of intangible assets
(26,216)
(28,526)
Contingent consideration
-
(39,526)
Acquisition and integration-related costs
(2,291)
(4,380)
Restructuring and divestiture charges
(18,350)
(3,933)
Gain on sale of intellectual property, net
-
53,884
Fair value adjustment to depreciation expense
(1,339)
(892)
Other
-
3,200
Non-GAAP operating expenses
$196,115
$196,115
$198,271
$198,271
INTEREST EXPENSE
GAAP interest expense
$61,290
$72,081
Adjustment:
Non-cash interest expense relating to convertible notes
(11,546)
(15,644)
Non-GAAP interest expense
$49,744
$49,744
$56,437
$56,437
PRE-TAX INCOME
GAAP pre-tax loss
$(1,419)
$(7,353)
Adjustments to pre-tax loss as detailed above
141,512
157,193
Debt extinguishment loss
2,940
-
Other
705
(167)
Non-GAAP pre-tax income
$143,738
$143,738
$149,673
$149,673
NET INCOME
GAAP net (loss) income
$(5,351)
$3,118
Adjustments to GAAP net (loss) income as detailed above
145,157
157,026
Income tax effect of reconciling items
(45,658)
(58,366)
Non-GAAP net income
$94,148
$94,148
$101,778
$101,778
EBITDA
Non-GAAP net income
$94,148
$101,778
Interest expense, net, not adjusted above
49,388
56,177
Provision for income taxes
49,590
47,895
Depreciation expense, not adjusted above
20,408
21,653
Adjusted EBITDA
$213,534
$213,534
$227,503
$227,503
Reconciliation of GAAP to Non-GAAP (unaudited)
Continued on next page
18 |
 In
thousands In thousands
Three Months Ended
Three Months Ended
December 28, 2013
December 28, 2013
ADJUSTED NET CASH PROVIDED BY OPERATING ACTIVITIES
Net cash provided by operating activities (GAAP)
$149,266
Contingent consideration paid for acquisitions (GAAP, within operating activities)
31,202
Adjusted
net
cash
provided
by
operating
activities
(OCF)
1
$180,468
$180,468
Operating Cash Flow (unaudited)
19
(1)
Operating cash flow represents operating cash flow within operating activities, but before
Investing/Financing Activities (which include capital expenditures). |
 Use of
Non-GAAP Financial Measures 20
Hologic has presented a number of non-GAAP financial measures that it uses to monitor its
business and present to investors as set forth and reconciled in the preceding pages.
Hologic defines its non-GAAP revenues to primarily include contingent revenue earned under the blood screening
collaboration post-acquisition which was eliminated under purchase accounting. Hologic
defines adjusted EBITDA as its non-GAAP net income plus net interest expense,
income taxes, and depreciation and amortization expense included in its non-GAAP net income. Hologic defines its non-GAAP
net income and EPS to exclude: (i) the amortization of intangible assets; (ii)
acquisition-related charges and effects, such as charges for contingent
consideration, transaction costs, integration costs including retention, and credits and/or
charges associated with the write-up of acquired inventory and fixed assets to fair
value, and the effect of a reduction in revenue primarily related to contingent revenue under the blood screening
collaboration, described above; (iii) non-cash interest expense related to amortization of
the debt discount for convertible debt securities; (iv) restructuring and divestiture
charges; (v) non-cash debt extinguishment losses and related transaction costs; (vi) litigation settlement charges
(benefits); (vii) other-than-temporary impairment losses on investments; (viii) other
one-time, nonrecurring, unusual or infrequent charges, expenses or gains that may
not be indicative of Hologic’s core business results; and (ix) income taxes related to such adjustments.
Hologic believes the use of non-GAAP revenues is useful to investors as it eliminates
certain effects of purchase accounting on its recognition of revenue. Hologic believes
the use of non-GAAP net income is useful to investors by eliminating certain of the more significant effects of its
acquisitions and related activities, non-cash charges resulting from the application of
GAAP to convertible debt instruments with cash settlement features, charges related to
debt extinguishment losses, investment impairments, litigation settlements, and restructuring and divestiture initiatives.
These non-GAAP measures also reflect how Hologic manages its businesses internally. In
addition to the adjustments set forth in the calculation of Hologic’s non-GAAP
net income and EPS, its adjusted EBITDA eliminates the effects of financing, income taxes and the accounting effects of capital
spending. As with the items eliminated in its calculation of non-GAAP net income, these
items may vary for different companies for reasons unrelated to the overall operating
performance of Hologic’s business. When analyzing Hologic’s operating performance, investors should not
consider these non-GAAP financial measures as a substitute for net income prepared in
accordance with GAAP. Hologic’s adjusted cash flow from operations represents Hologic’s cash flow from
operations increased by contingent consideration paid for acquisitions that were
included as a GAAP operating expense. Hologic believes that this adjustment is useful to investors as it eliminates one
of the more significant effects of its acquisitions and related activities to its cash flow
from operations, similar to its adjustments for other non-GAAP financial measures
described above.
|