Attached files
| file | filename |
|---|---|
| 8-K - 8-K - First NBC Bank Holding Co | d676698d8k.htm |

NASDAQ: NBCB
Sterne Agee Financial Institutions Investor Conference February 2014
Forward Looking Statements
Statements contained in this presentation that are not historical facts, including statements accompanied by words such as “will,” “believe,” “anticipate,” “expect,” “estimate,” “preliminary,” or similar words, constitute “forward-looking statements” within the meaning of the Private Securities Litigation Reform Act of 1995. These forward-looking statements are based on management’s estimates, assumptions, and projections as of the date of the presentation and are not guarantees of future performance. Actual results may differ materially from the results expressed or implied by these forward-looking statements as the result of risks, uncertainties and other factors, including, but are not limited to, those discussed in the company’s periodic reports and filings with the Securities and Exchange Commission (SEC). Copies of the company’s SEC filings may be downloaded from the Internet at no charge from www.sec.gov or ir.firstnbcbank.com/sec.cfm. First NBC Bank Holding Company cautions you not to place undue reliance on the forward-looking statements contained in this presentation, which the company undertakes no obligation to update or revise to reflect future events, information or circumstances arising after the date of this presentation.
Market data used in this presentation has been obtained from independent industry sources and publications as well as from research reports prepared for other purposes. Industry publications and surveys and forecasts generally state that the information contained therein has been obtained from sources believed to be reliable. The company has not independently verified the data obtained from these sources. Forward-looking information obtained from these sources is subject to the same qualifications and the additional uncertainties regarding the other forward-looking statements in this presentation. 2
Corporate Overview
Overview
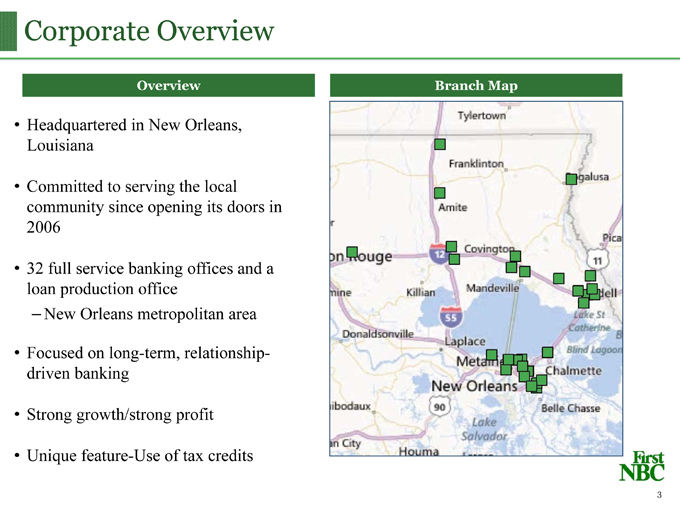
Headquartered in New Orleans, Louisiana
Committed to serving the local community since opening its doors in 2006
32 full service banking offices and a loan production office
–New Orleans metropolitan area
Focused on long-term, relationship-driven banking
Strong growth/strong profit
Unique feature-Use of tax credits
Branch Map
| 3 |
|
Financial Highlights
Balance Sheet
December 31, December 31,
($ in millions) 2013 2012
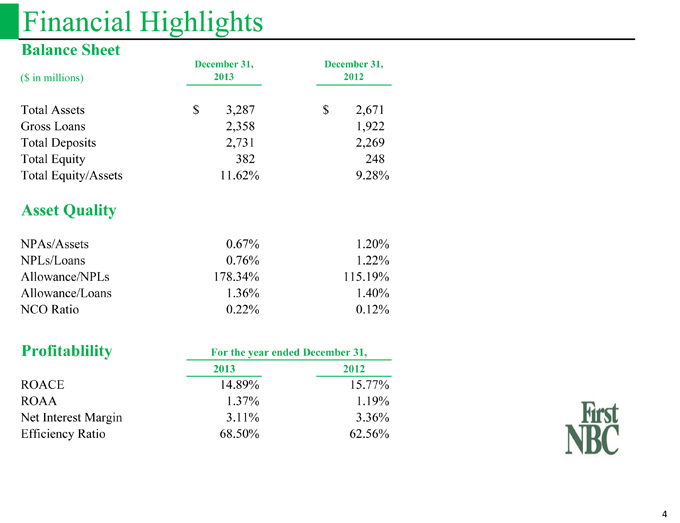
Total Assets $ 3,287 $ 2,671
Gross Loans 2,358 1,922
Total Deposits 2,731 2,269
Total Equity 382 248
Total Equity/Assets 11.62% 9.28%
Asset Quality
NPAs/Assets 0.67% 1.20%
NPLs/Loans 0.76% 1.22%
Allowance/NPLs 178.34% 115.19%
Allowance/Loans 1.36% 1.40%
NCO Ratio 0.22% 0.12%
Profitablility For the year ended December 31,
2013 2012
ROACE 14.89% 15.77%
ROAA 1.37% 1.19%
Net Interest Margin 3.11% 3.36%
Efficiency Ratio 68.50% 62.56%
| 4 |
|
New Orleans: A Revitalized and Growing Market
Multifaceted Growth
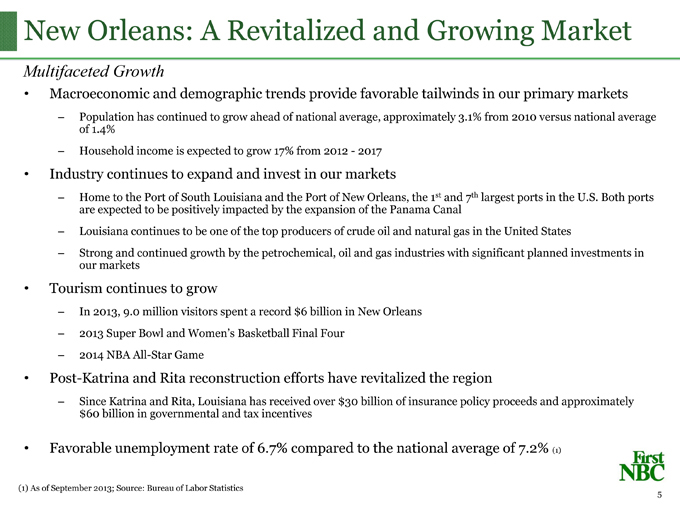
Macroeconomic and demographic trends provide favorable tailwinds in our primary markets
– Population has continued to grow ahead of national average, approximately 3.1% from 2010 versus national average of 1.4%
– Household income is expected to grow 17% from 2012—2017
Industry continues to expand and invest in our markets
– Home to the Port of South Louisiana and the Port of New Orleans, the 1st and 7th largest ports in the U.S. Both ports are expected to be positively impacted by the expansion of the Panama Canal
– Louisiana continues to be one of the top producers of crude oil and natural gas in the United States
– Strong and continued growth by the petrochemical, oil and gas industries with significant planned investments in our markets
Tourism continues to grow
– In 2013, 9.0 million visitors spent a record $6 billion in New Orleans
– 2013 Super Bowl and Women’s Basketball Final Four
– 2014 NBA All-Star Game
Post-Katrina and Rita reconstruction efforts have revitalized the region
– Since Katrina and Rita, Louisiana has received over $30 billion of insurance policy proceeds and approximately $60 billion in governmental and tax incentives
Favorable unemployment rate of 6.7% compared to the national average of 7.2% (1)
(1) As of September 2013; Source: Bureau of Labor Statistics 5
Competitive Dynamics
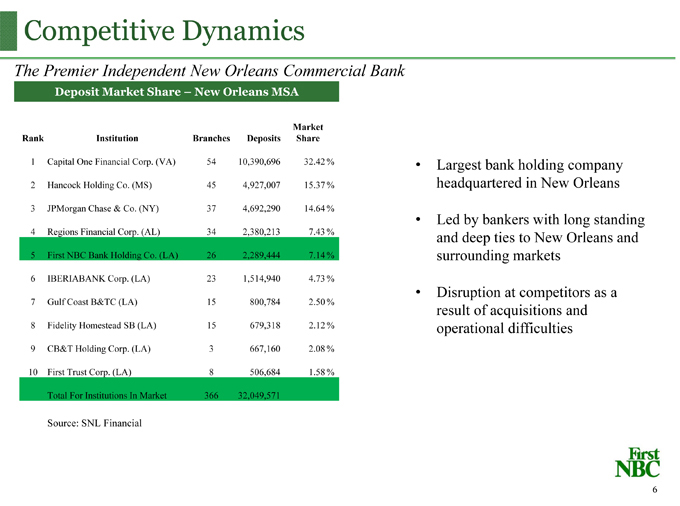
The Premier Independent New Orleans Commercial Bank
Deposit Market Share – New Orleans MSA
Market
Rank Institution Branches Deposits Share
| 1 |
|
Capital One Financial Corp. (VA) 54 10,390,696 32.42 % |
| 2 |
|
Hancock Holding Co. (MS) 45 4,927,007 15.37 % |
| 3 |
|
JPMorgan Chase & Co. (NY) 37 4,692,290 14.64 % |
| 4 |
|
Regions Financial Corp. (AL) 34 2,380,213 7.43 % |
| 5 |
|
First NBC Bank Holding Co. (LA) 26 2,289,444 7.14 % |
| 6 |
|
IBERIABANK Corp. (LA) 23 1,514,940 4.73 % |
| 7 |
|
Gulf Coast B&TC (LA) 15 800,784 2.50 % |
| 8 |
|
Fidelity Homestead SB (LA) 15 679,318 2.12 % |
9 CB&T Holding Corp. (LA) 3 667,160 2.08 %
10 First Trust Corp. (LA) 8 506,684 1.58 %
Total For Institutions In Market 366 32,049,571
Source: SNL Financial
| • |
|
Largest bank holding company headquartered in New Orleans |
| • |
|
Led by bankers with long standing and deep ties to New Orleans and surrounding markets |
| • |
|
Disruption at competitors as a result of acquisitions and operational difficulties |
| 6 |
|
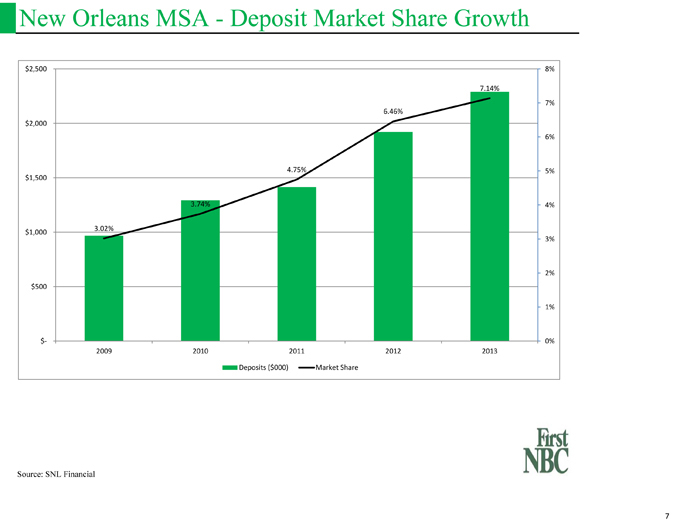
New Orleans MSA—Deposit Market Share Growth
$ 2,500 8%
7.14%
7%
6.46%
$ 2,000
6%
4.75% 5%
$ 1,500
3.74% 4%
$ 1,000 3.02%
3%
2%
$ 500
1%
$? 0%
2009 2010 2011 2012 2013
Deposits ($000) Market Share
Source: SNL Financial
| 7 |
|
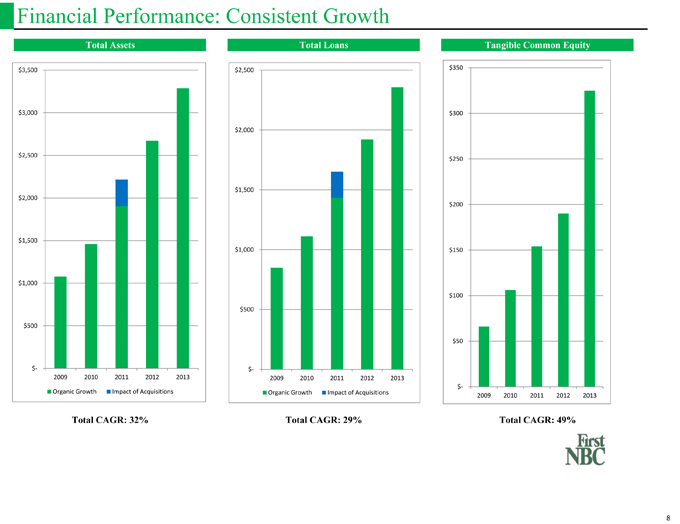
Financial Performance: Consistent Growth
Total Assets
$ 3,500
$ 3,000
$ 2,500
$ 2,000
$ 1,500
$ 1,000
$ 500
$?
2009 2010 2011 2012 2013
Organic Growth Impact of Acquisitions
Total CAGR: 32%
Total Loans
$ 2,500
$ 2,000
$ 1,500
$ 1,000
$ 500
$?
2009 2010 2011 2012 2013
Organic Growth Impact of Acquisitions
Total CAGR: 29%
Tangible Common Equity
$350
$300
$250
$200
$150
$100
$50
$?
2009 2010 2011 2012 2013
Total CAGR: 49%
| 8 |
|
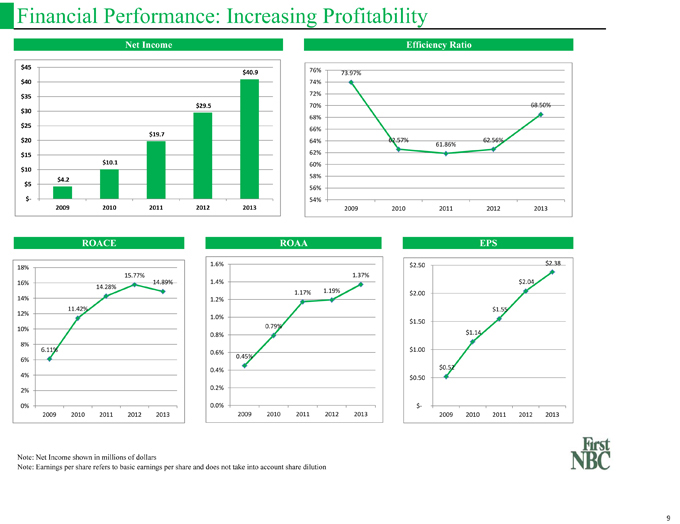
Financial Performance: Increasing Profitability
Net Income
$45
$40.9
$40
$35
$29.5
$30
$25
$19.7
$20
$15
$10.1
$10
$4.2
$5
$?
2009 2010 2011 2012 2013
Efficiency Ratio
76% 73.97%
74%
72%
70% 68.50%
68%
66%
64% 62.57% 62.56%
61.86%
62%
60%
58%
56%
54%
2009 2010 2011 2012 2013
ROACE
18%
15.77%
16% 14.89%
14.28%
14%
11.42%
12%
10%
8%
6.11%
6%
4%
2%
0%
2009 2010 2011 2012 2013
ROAA
1.6%
1.37%
1.4%
1.17% 1.19%
1.2%
1.0%
0.79%
0.8%
0.6%
0.45%
0.4%
0.2%
0.0%
2009 2010 2011 2012 2013
EPS
$ 2.50 $ 2.38
$ 2.04
$ 2.00
$ 1.55
$ 1.50
$ 1.14
$ 1.00
$ 0.52
$ 0.50
$?
2009 2010 2011 2012 2013
Note: Net Income shown in millions of dollars
Note: Earnings per share refers to basic earnings per share and does not take into account share dilution 9
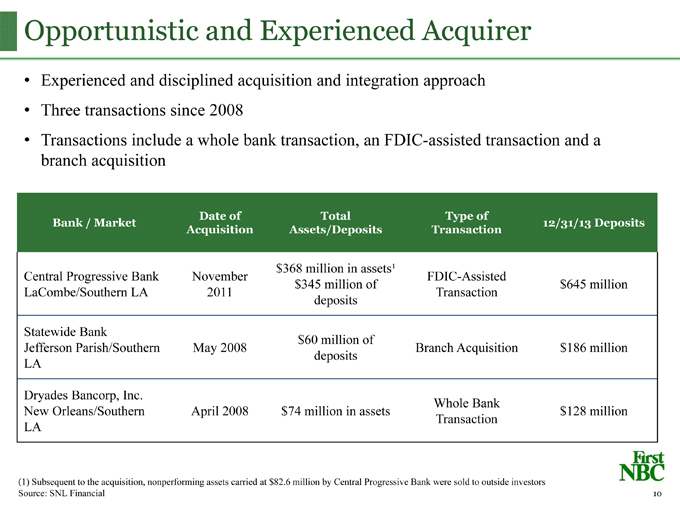
Opportunistic and Experienced Acquirer
| • |
|
Experienced and disciplined acquisition and integration approach |
| • |
|
Three transactions since 2008 |
| • |
|
Transactions include a whole bank transaction, an FDIC-assisted transaction and a branch acquisition |
Date of Total Type of
Bank / Market 12/31/13 Deposits
Acquisition Assets/Deposits Transaction
$368 million in assets1
Central Progressive Bank November FDIC-Assisted
$345 million of $ 645 million
LaCombe/Southern LA 2011 Transaction
deposits
Statewide Bank $60 million of
Jefferson Parish/Southern May 2008 Branch Acquisition $ 186 million
LA deposits
Dryades Bancorp, Inc. Whole Bank
New Orleans/Southern April 2008 $74 million in assets $ 128 million
LA Transaction
(1) Subsequent to the acquisition, nonperforming assets carried at $82.6 million by Central Progressive Bank were sold to outside investors Source: SNL Financial
10
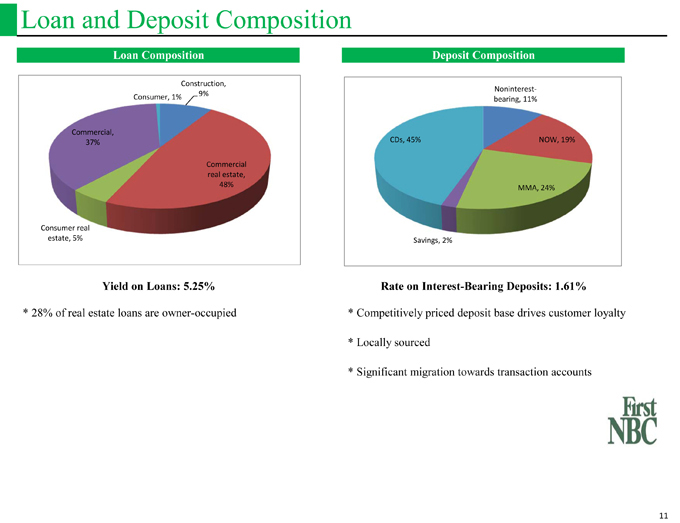
Loan and Deposit Composition
Loan Composition
Construction,
Consumer, 1% 9%
Commercial,
37%
Commercial
real estate,
48%
Consumer real
estate, 5%
Yield on Loans: 5.25%
| * |
|
28% of real estate loans are owner-occupied |
Deposit Composition
Noninterest?
bearing, 11%
CDs, 45% NOW, 19%
MMA, 24%
Savings, 2%
Rate on Interest-Bearing Deposits: 1.61%
| * |
|
Competitively priced deposit base drives customer loyalty |
| * |
|
Locally sourced |
| * |
|
Significant migration towards transaction accounts |
11
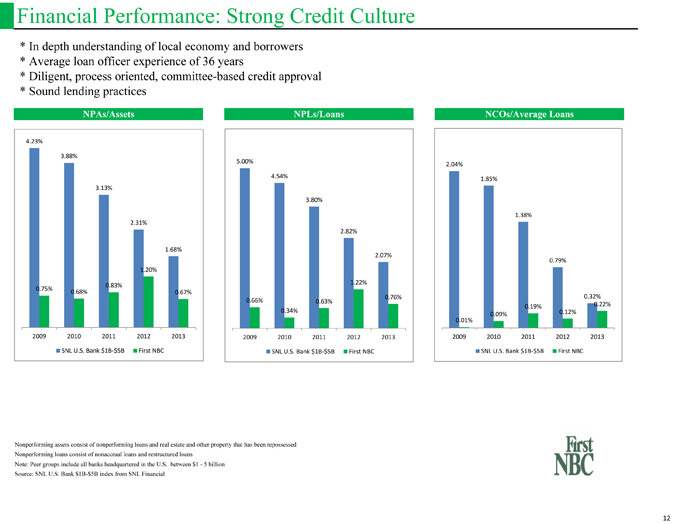
Financial Performance: Strong Credit Culture
| * |
|
In depth understanding of local economy and borrowers |
| * |
|
Average loan officer experience of 36 years |
| * |
|
Diligent, process oriented, committee-based credit approval |
| * |
|
Sound lending practices |
NPAs/Assets
4.23%
3.88%
3.13%
2.31%
1.68%
1.20%
0.83%
0.75% 0.68% 0.67%
2009 2010 2011 2012 2013
SNL U.S. Bank $1B?$5B First NBC
NPLs/Loans
5.00%
4.54%
3.80%
2.82%
2.07%
1.22%
0.66% 0.63% 0.76%
0.34%
2009 2010 2011 2012 2013
SNL U.S. Bank $1B?$5B First NBC
NCOs/Average Loans
2.04%
1.85%
1.38%
0.79%
0.32%
0.19% 0.22%
0.09% 0.12%
0.01%
2009 2010 2011 2012 2013
SNL U.S. Bank $1B?$5B First NBC
Nonperforming assets consist of nonperforming loans and real estate and other property that has been repossessed Nonperforming loans consist of nonaccrual loans and restructured loans Note: Peer groups include all banks headquartered in the U.S. between $1—5 billion Source: SNL U.S. Bank $1B-$5B index from SNL Financial 12
Tax Credit Overview
Tax credits are an integral part of First NBC’s commercial banking business
– Management has a deep understanding of this business which is core to First NBC’s corporate strategy
Well-established federal and state programs
– Promote private investment in low income areas, to build affordable housing and rehabilitation of historic buildings
– Includes Federal New Markets Tax Credits, Low-Income Housing Tax Credits and Federal Historic Rehabilitation Tax Credits
First NBC plays two roles:
– Investor in the underlying project
– Lender to the developer
In exchange for investment, First NBC receives tax credits
Loans underwritten to normal credit standards
Underlying projects have low LTVs (40%—70%)
Strong financial returns
13
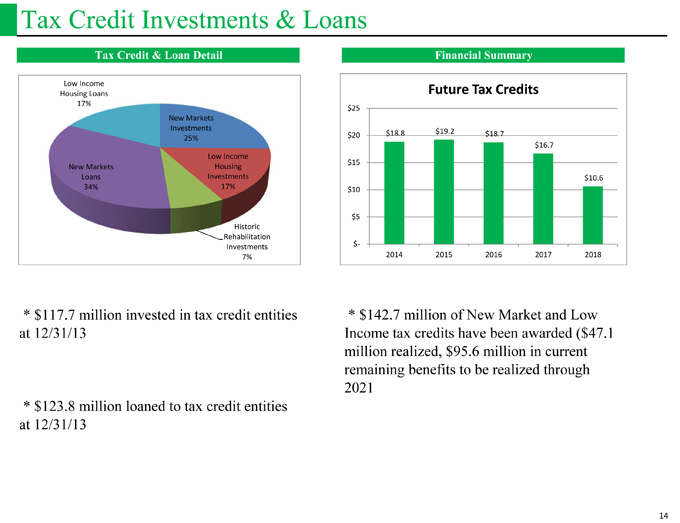
Tax Credit Investments & Loans
Tax Credit & Loan Detail
Low Income
Housing Loans
17%
New Markets
Investments
25%
Low Income
New Markets
Housing
Loans
Investments
34%
17%
Historic
Rehabilitation
Investments
7%
Financial Summary
Future Tax Credits
$25
$20 $18.8 $19.2 $18.7
$16.7
$15
$10.6
$10
$5
$?
2014 2015 2016 2017 2018
* $117.7 million invested in tax credit entities at 12/31/13 * $123.8 million loaned to tax credit entities at 12/31/13 * $142.7 million of New Market and Low Income tax credits have been awarded ($47.1 million realized, $95.6 million in current remaining benefits to be realized through 2021
14
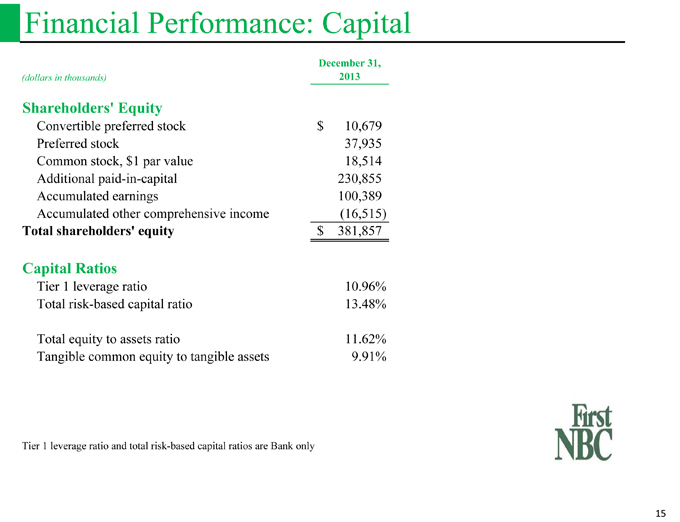
Financial Performance: Capital
December 31,
(dollars in thousands) 2013
Shareholders’ Equity
Convertible preferred stock $ 10,679
Preferred stock 37,935
Common stock, $1 par value 18,514
Additional paid-in-capital 230,855
Accumulated earnings 100,389
Accumulated other comprehensive income (16,515)
Total shareholders’ equity $ 381,857
Capital Ratios
Tier 1 leverage ratio 10.96%
Total risk-based capital ratio 13.48%
Total equity to assets ratio 11.62%
Tangible common equity to tangible assets 9.91%
Tier 1 leverage ratio and total risk-based capital ratios are Bank only
15
Summary
• Track record of stable growth, profitability and book value accretion
• Highly experienced management team with long tenure in the New Orleans market
– Key executives built First National Bank of Commerce, a $6 billion New Orleans institution sold in 1998 for nearly 3.5x book value
• Strong Board comprised of industry leaders with broad skill sets and extensive in-market networks
• Thriving and diversified marketplace
• Demonstrated ability to acquire and integrate other banking franchises
• Significant institutional ownership
16

Appendix
17
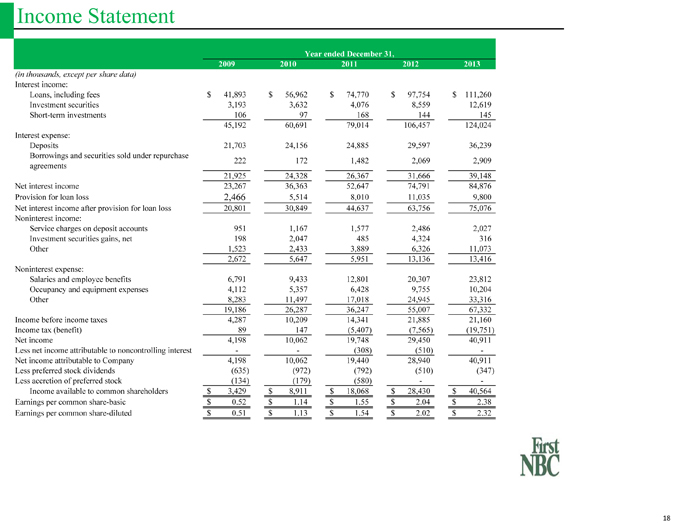
Income Statement
Year ended December 31,
2009 2010 2011 2012 2013
(in thousands, except per share data)
Interest income:
Loans, including fees $ 41,893 $ 56,962 $ 74,770 $ 97,754 $ 111,260
Investment securities 3,193 3,632 4,076 8,559 12,619
Short-term investments 106 97 168 144 145
45,192 60,691 79,014 106,457 124,024
Interest expense:
Deposits 21,703 24,156 24,885 29,597 36,239
Borrowings and securities sold under repurchase 222 172 1,482 2,069 2,909
agreements
21,925 24,328 26,367 31,666 39,148
Net interest income 23,267 36,363 52,647 74,791 84,876
Provision for loan loss 2,466 5,514 8,010 11,035 9,800
Net interest income after provision for loan loss 20,801 30,849 44,637 63,756 75,076
Noninterest income:
Service charges on deposit accounts 951 1,167 1,577 2,486 2,027
Investment securities gains, net 198 2,047 485 4,324 316
Other 1,523 2,433 3,889 6,326 11,073
2,672 5,647 5,951 13,136 13,416
Noninterest expense:
Salaries and employee benefits 6,791 9,433 12,801 20,307 23,812
Occupancy and equipment expenses 4,112 5,357 6,428 9,755 10,204
Other 8,283 11,497 17,018 24,945 33,316
19,186 26,287 36,247 55,007 67,332
Income before income taxes 4,287 10,209 14,341 21,885 21,160
Income tax (benefit) 89 147 (5,407) (7,565) (19,751)
Net income 4,198 10,062 19,748 29,450 40,911
Less net income attributable to noncontrolling interest — (308) (510) -
Net income attributable to Company 4,198 10,062 19,440 28,940 40,911
Less preferred stock dividends (635) (972) (792) (510) (347)
Less accretion of preferred stock (134) (179) (580) —
Income available to common shareholders $ 3,429 $ 8,911 $ 18,068 $ 28,430 $ 40,564
Earnings per common share-basic $ 0.52 $ 1.14 $ 1.55 $ 2.04 $ 2.38
Earnings per common share-diluted $ 0.51 $ 1.13 $ 1.54 $ 2.02 $ 2.32
18