Attached files
| file | filename |
|---|---|
| 8-K - 8-K - CoreSite Realty Corp | a14-5524_18k.htm |
| EX-99.1 - EX-99.1 - CoreSite Realty Corp | a14-5524_1ex99d1.htm |
Exhibit 99.2
|
|
Earnings Release and Supplemental Information Quarter Ended December 31, 2013 |

|
|
Table of Contents Overview Earnings Release 3 Company Profile 8 Summary of Financial Data 10 Financial Statements Consolidated Balance Sheets 11 Consolidated Statements of Operations 12 Reconciliations of Net Income to FFO, AFFO and EBITDA 13 Operating Portfolio Operating Properties 14 Leasing Statistics 15 Geographic Diversification and 10 Largest Customers 17 Development Summary and Capital Expenditures 18 Capital Structure Market Capitalization and Debt Summary 19 Interest Summary and Debt Covenants 20 2014 Guidance 21 Appendix 24 |
|
|
CORESITE REPORTS FOURTH-QUARTER FUNDS FROM OPERATIONS INCREASED 17% YEAR OVER YEAR Overview Financial Statements Operating Portfolio Development and Capital Expenditures Capital Structure 2014 Guidance Appendix DENVER, CO – February 13, 2014 CoreSite Realty Corporation (NYSE: COR), a provider of network-dense, cloud-enabled, enterprise-class data center products and services, today announced financial results for the fourth quarter ended December 31, 2013. Quarterly and Subsequent Highlights • Reported fourth-quarter funds from operations (“FFO”) of $0.49 per diluted share and unit, representing a 16.7% increase year over year • Reported fourth-quarter operating revenue of $61.4 million, representing an 11.2% increase year over year • Executed new and expansion data center leases representing $3.5 million of annualized GAAP rent at a rate of $132 of annualized GAAP rent per square foot • Realized rent growth on signed renewals of 3.5% on a cash basis and 14.3% on a GAAP basis and rental churn of 1.9% • Increased quarterly dividend by 30% to $0.35 per share; annual rate of $1.40 per share • Entered into a new $100 million, five-year, senior unsecured term loan, and subsequently retired the approximately $58 million loan secured by its SV1 facility Tom Ray, CoreSite’s Chief Executive Officer, commented, “In the fourth quarter we continued to see the financial results driven by execution upon our plan to sell an attractive product mix to customers benefitting from our strong foundation in the network and cloud verticals,” Mr. Ray continued, “We also delivered the first computer room of turn-key data center capacity at NY2 in Secaucus, New Jersey, in December, and are pleased with sales activity surrounding the investment. In addition, we delivered the build-to-suit at SV5 and look forward to completing construction on our VA2 development in Northern Virginia toward the second half of the year. 2014 represents a year of strong opportunity for CoreSite to leverage our network-dense, cloud-enabled data centers with excellence in customer service. Our primary focus for the balance of 2014 centers around increasing the productivity of our existing sales and marketing resources to sell available and pipeline capacity and deliver attractive returns on capital.” |

|
|
Quarter Ended December 31, 2013 Overview Financial Statements Operating Portfolio Development and Capital Expenditures Capital Structure 2014 Guidance Appendix Financial Results CoreSite reported FFO attributable to shares and units of $23.1 million for the three months ended December 31, 2013, a 17.2% increase year over year and an increase of 5.6% quarter over quarter. On a per diluted share and unit basis, FFO increased 16.7% to $0.49 for the three months ended December 31, 2013, as compared to $0.42 per diluted share and unit for the three months ended December 31, 2012. Total operating revenue for the three months ended December 31, 2013, was $61.4 million, an 11.2% increase year over year. Revenue growth in the fourth quarter was diluted by 1.8% due to CoreSite’s customer at SV3 decreasing its metered power draw as it transitions out of that facility. CoreSite reported net income attributable to common shares of $3.1 million, or $0.15 per diluted share. Sales Activity CoreSite executed 122 new and expansion data center leases, representing $3.5 million of annualized GAAP rent during the fourth quarter, comprised of 26,276 NRSF at a weighted average GAAP rate of $132 per NRSF. CoreSite’s renewal leases signed in the fourth quarter totaled $6.8 million in annualized GAAP rent, comprised of 50,513 NRSF at a weighted average GAAP rate of $135 per NRSF. These results reflect a 3.5% increase in rent on a cash basis and a 14.3% increase on a GAAP basis. The fourth-quarter rental churn rate was 1.9%. CoreSite’s fourth-quarter data center lease commencements totaled 116,052 NRSF at a weighted average GAAP rental rate of $41 per NRSF, which represents $4.8 million of annualized GAAP rent. These results include a 101,721 NRSF build-to-suit powered shell lease for a valued and strategic customer at the Santa Clara Campus. Excluding this lease, commencements totaled 14,331 at a weighted average GAAP rental rate of $116 per NRSF. Development Activity In the fourth quarter, CoreSite completed and delivered the build-to-suit powered shell building at SV5 on its Santa Clara campus. Also during the quarter, the company placed into service the first computer room at the new NY2 data center in Secaucus, New Jersey, representing an incremental 18,103 NRSF of TKD capacity. As of December 31, 2013, CoreSite had 118,300 NRSF of data center space under construction at three locations. The projects under construction include a new data center at VA2 (Northern Virginia), adjacent to VA1, and additional inventory at NY2 (New York market) and LA2 (Los Angeles). As of December 31, 2013, CoreSite had incurred $117.9 million of the estimated $170.4 million required to complete these projects. |

|
|
Quarter Ended December 31, 2013 Balance Sheet and Liquidity As of December 31, 2013, CoreSite had $232.5 million of total long-term debt equal to 2.1x annualized adjusted EBITDA and $347.5 million of long-term debt and preferred stock equal to 3.1x annualized adjusted EBITDA. As of December 31, 2013, CoreSite had $174.3 million drawn on the credit facility and approximately $222.4 million of available capacity under the facility. At quarter end, CoreSite had $5.3 million of cash available on its balance sheet. On January 31, 2014, CoreSite entered into a new $100 million, five-year, senior unsecured term loan. The term loan has an accordion feature, which would allow CoreSite to increase the total commitments by $100 million, to $200 million, under specified circumstances. CoreSite used the capacity under the term loan to retire the $58 million mortgage on its SV1 facility and pay down a portion of the outstanding balance on its revolving credit facility. Dividend On December 6, 2013, CoreSite announced a 30% increase in its quarterly dividend to $0.35 per share of common stock and common stock equivalents for the fourth quarter of 2013. The dividend was paid on January 15, 2014, to shareholders of record on December 31, 2013. CoreSite also announced on December 6, 2013, a dividend of $0.4531 per share of Series A preferred stock for the period October 15, 2013, to January 14, 2014. The preferred dividend was paid on January 15, 2014, to shareholders of record on December 31, 2013. 2014 Guidance CoreSite is introducing its 2014 guidance of FFO per diluted share and unit in the range of $2.00 to $2.10. More detail regarding the assumptions behind the 2014 annual guidance can be found on page 21 of the earnings supplemental. In addition, the company’s estimate of the net income attributable to common shares is $0.50 to $0.60 per diluted share, with the difference between FFO and net income being real estate depreciation and amortization. This outlook is predicated on current economic conditions, internal assumptions about CoreSite’s customer base, and the supply and demand dynamics of the markets in which CoreSite operates. The guidance does not include the impact of any future financing, investment or disposition activities, beyond what has already been disclosed. Upcoming Conferences and Events CoreSite will participate in Citi’s 2014 Global Property CEO Conference on March 3, 2014, at The Westin Diplomat in Hollywood, Florida. Overview Financial Statements Operating Portfolio Development and Capital Expenditures Capital Structure 2014 Guidance Appendix |

|
|
Quarter Ended December 31, 2013 Conference Call Details CoreSite will host a conference call on February 13, 2014, at 12:00 p.m., Eastern time (10:00 a.m., Mountain time), to discuss its financial results, current business trends and market conditions. The call can be accessed live over the phone by dialing 877-407-3982 for domestic callers or 201-493-6780 for international callers. A replay will be available shortly after the call and can be accessed by dialing 877-870-5176 for domestic callers or 858-384-5517 for international callers. The passcode for the replay is 13574365. The replay will be available until February 20, 2014. Interested parties may also listen to a simultaneous webcast of the conference call by logging on to CoreSite’s website at www.CoreSite.com and clicking on the “Investors” tab. The on-line replay will be available for a limited time immediately following the call. About CoreSite CoreSite Realty Corporation (NYSE:COR) delivers secure and reliable data center solutions across eight key North American markets. CoreSite connects, protects and delivers an optimal performance environment and continued operation of mission-critical data and IT infrastructure for enterprises and Internet, private networking, mobility, and cloud service providers. CoreSite's scalable platform of over two and a half million square feet of efficient, network-dense, cloud-enabled data center capacity enables customers to accelerate business performance, reduce operating costs and increase flexibility across their IT and communications systems. CoreSite's 350 professionals deliver best-in-class service by placing customer needs first in supporting the planning, implementation and operating requirements foundational to delivering reliable, secure and efficient IT operating environments. More than 750 of the world’s leading enterprises, carriers and mobile operators, content and cloud providers and media and entertainment companies choose CoreSite to connect, protect and optimize their performance-sensitive data, applications and computing workloads. CoreSite provides valuable gateways to global business opportunities with direct access to more than 275 carriers and ISPs, inter-site connectivity and CoreSite's Open Cloud Exchange, which supports rapid, efficient and scalable Ethernet access to multiple key public clouds, enabling simple, flexible, multiple-cloud capabilities. For more information, visit www.CoreSite.com. CoreSite Investor Relations Contact Greer Aviv | CoreSite Investor Relations Director +1 303.405.1012 | +1 303.222.7276 Greer.Aviv@CoreSite.com Overview Financial Statements Operating Portfolio Development and Capital Expenditures Capital Structure 2014 Guidance Appendix |

|
|
Quarter Ended December 31, 2013 Forward Looking Statements This earnings release and accompanying supplemental information may contain forward-looking statements within the meaning of the federal securities laws. Forward-looking statements relate to expectations, beliefs, projections, future plans and strategies, anticipated events or trends and similar expressions concerning matters that are not historical facts. In some cases, you can identify forward-looking statements by the use of forward-looking terminology such as “believes,” “expects,” “may,” “will,” “should,” “seeks,” “approximately,” “intends,” “plans,” “pro forma,” “estimates” or “anticipates” or the negative of these words and phrases or similar words or phrases that are predictions of or indicate future events or trends and that do not relate solely to historical matters. Forward-looking statements involve known and unknown risks, uncertainties, assumptions and contingencies, many of which are beyond CoreSite’s control, that may cause actual results to differ significantly from those expressed in any forward-looking statement. These risks include, without limitation: the geographic concentration of the company’s data centers in certain markets and any adverse developments in local economic conditions or the demand for data center space in these markets; fluctuations in interest rates and increased operating costs; difficulties in identifying properties to acquire and completing acquisitions; significant industry competition; the company’s failure to obtain necessary outside financing; the company’s failure to qualify or maintain its status as a REIT; financial market fluctuations; changes in real estate and zoning laws and increases in real property tax rates; and other factors affecting the real estate industry generally. All forward-looking statements reflect the company’s good faith beliefs, assumptions and expectations, but they are not guarantees of future performance. Furthermore, the company disclaims any obligation to publicly update or revise any forward-looking statement to reflect changes in underlying assumptions or factors, of new information, data or methods, future events or other changes. For a further discussion of these and other factors that could cause the company’s future results to differ materially from any forward-looking statements, see the section entitled “Risk Factors” in the company’s most recent annual report on Form 10-K, and other risks described in documents subsequently filed by the company from time to time with the Securities and Exchange Commission. Overview Financial Statements Operating Portfolio Development and Capital Expenditures Capital Structure 2014 Guidance Appendix |

|
|
Company Profile CoreSite delivers network-dense, cloud-enabled, enterprise-class data center products and services across eight key North American markets. Overview Financial Statements Operating Portfolio Development and Capital Expenditures Capital Structure 2014 Guidance Appendix |

|
|
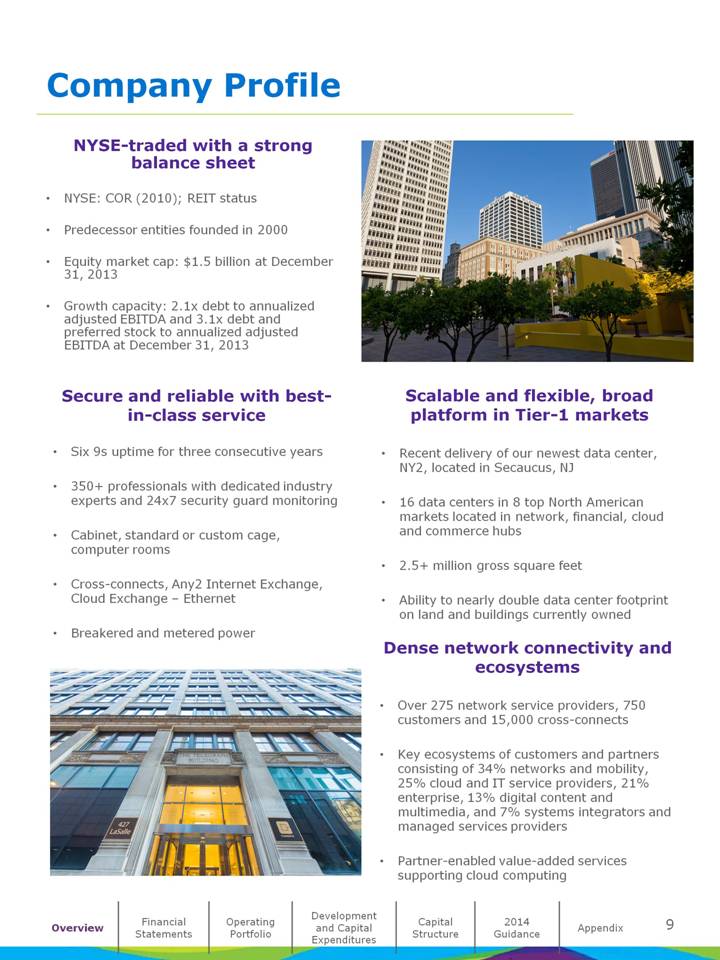
Company Profile NYSE-traded with a strong balance sheet NYSE: COR (2010); REIT status Predecessor entities founded in 2000 Equity market cap: $1.5 billion at December 31, 2013 Growth capacity: 2.1x debt to annualized adjusted EBITDA and 3.1x debt and preferred stock to annualized adjusted EBITDA at December 31, 2013 Scalable and flexible, broad platform in Tier-1 markets Recent delivery of our newest data center, NY2, located in Secaucus, NJ 16 data centers in 8 top North American markets located in network, financial, cloud and commerce hubs 2.5+ million gross square feet Ability to nearly double data center footprint on land and buildings currently owned Dense network connectivity and ecosystems Over 275 network service providers, 750 customers and 15,000 cross-connects Key ecosystems of customers and partners consisting of 34% networks and mobility, 25% cloud and IT service providers, 21% enterprise, 13% digital content and multimedia, and 7% systems integrators and managed services providers Partner-enabled value-added services supporting cloud computing Secure and reliable with best-in-class service Six 9s uptime for three consecutive years 350+ professionals with dedicated industry experts and 24x7 security guard monitoring Cabinet, standard or custom cage, computer rooms Cross-connects, Any2 Internet Exchange, Cloud Exchange – Ethernet Breakered and metered power Overview Financial Statements Operating Portfolio Development and Capital Expenditures Capital Structure 2014 Guidance Appendix |
|
|
Summary of Financial Data (in thousands, except share, per share and NRSF data) Overview Financial Statements Operating Portfolio Development and Capital Expenditures Capital Structure 2014 Guidance Appendix Financial Highlights/Summary (in thousands, except per share and NRSF data) Three Months Ended Year Ended Summary of Results December 31, 2013 September 30, 2013 December 31, 2012 December 31, 2013 December 31, 2012 Operating revenues $ 61,440 $ 60,635 $ 55,252 $ 234,833 $ 206,934 Net income 9,029 8,509 4,578 31,612 10,716 Net income attributable to common shares 3,135 2,901 1,862 10,503 4,608 Funds from operations (FFO) to shares and units 23,090 21,868 19,704 85,314 71,976 Adjusted funds from operations (AFFO) 19,385 20,562 16,169 78,061 62,637 EBITDA 26,891 25,683 22,272 100,455 81,370 Adjusted EBITDA 28,324 27,467 24,168 107,754 89,374 Per share - diluted: Net income attributable to common shares $ 0.15 $ 0.14 $ 0.09 $ 0.49 $ 0.22 FFO per common share and OP unit $ 0.49 $ 0.47 $ 0.42 $ 1.82 $ 1.55 Financial Highlights/Summary (in thousands, except per share and NRSF data) As of December 31, 2013 September 30, 2013 June 30, 2013 March 31, 2013 December 31, 2012 Dividend Activity Dividends declared per common share and OP unit $ 0.35 $ 0.27 $ 0.27 $ 0.27 $ 0.27 AFFO payout ratio 84% 61% 62% 71% 78% Operating Portfolio Statistics Operating data center properties 16 14 14 14 14 Operating data center NRSF 1,327,205 1,225,596 1,225,596 1,208,365 1,208,365 Data center NRSF occupied 1,084,444 987,416 986,646 963,442 930,245 Data center % occupied 81.7% 80.6% 80.5% 79.7% 77.0% Turn-Key Data Center Same Store Statistics Monthly Recurring Revenue per Cabinet Equivalent $ 1,429 $ 1,396 $ 1,342 $ 1,315 $ 1,291 Data center NRSF % occupied 78.3% 79.3% 80.0% 80.2% 79.1% Market Capitalization, Debt & Preferred Stock Total enterprise value $ 1,852,319 $ 1,869,100 $ 1,734,594 $1,861,410 $ 1,462,710 Total debt outstanding 232,500 166,625 132,000 111,375 59,750 Total debt and preferred stock outstanding 347,500 281,625 247,000 226,375 174,750 Debt to: Annualized Adjusted EBITDA 2.1x 1.5x 1.2x 1.1x 0.6x Undepreciated book value of total assets 19.8% 15.0% 12.7% 11.1% 6.3% Debt & Preferred Stock to: Annualized Adjusted EBITDA 3.1x 2.6x 2.3x 2.3x 1.8x Undepreciated book value of total assets 29.6% 25.4% 23.8% 22.5% 18.4% |

|
|
Consolidated Balance Sheets (in thousands) Overview Financial Statements Operating Portfolio Development and Capital Expenditures Capital Structure 2014 Guidance Appendix December 31, 2013 December 31, 2012 Assets: Investments in real estate: Land $ 78,983 $ 85,868 Building and building improvements 717,007 596,405 Leasehold improvements 95,218 85,907 891,208 768,180 Less: Accumulated depreciation and amortization (155,704) (105,433) Net investment in operating properties 735,504 662,747 Construction in progress 157,317 61,328 Net investments in real estate 892,821 724,075 Cash and cash equivalents 5,313 8,130 Accounts and other receivables, net 10,339 9,901 Lease intangibles, net 11,028 19,453 Goodwill 41,191 41,191 Other assets 55,802 42,582 Total assets $ 1,016,494 $ 845,332 Liabilities and equity: Liabilities Revolving credit facility $ 174,250 $ — Mortgage loan payable 58,250 59,750 Accounts payable and accrued expenses 67,782 50,624 Deferred rent payable 9,646 4,329 Acquired below-market lease contracts, net 6,681 8,539 Prepaid rent and other liabilities 11,578 11,317 Total liabilities 328,187 134,559 Stockholders’ equity Series A cumulative preferred stock 115,000 115,000 Common stock, par value $0.01 209 207 Additional paid-in capital 267,465 259,009 Distributions in excess of net income (50,264) (35,987) Total stockholders’ equity 332,410 338,229 Noncontrolling interests 355,897 372,544 Total equity 688,307 710,773 Total liabilities and equity $ 1,016,494 $ 845,332 |

|
|
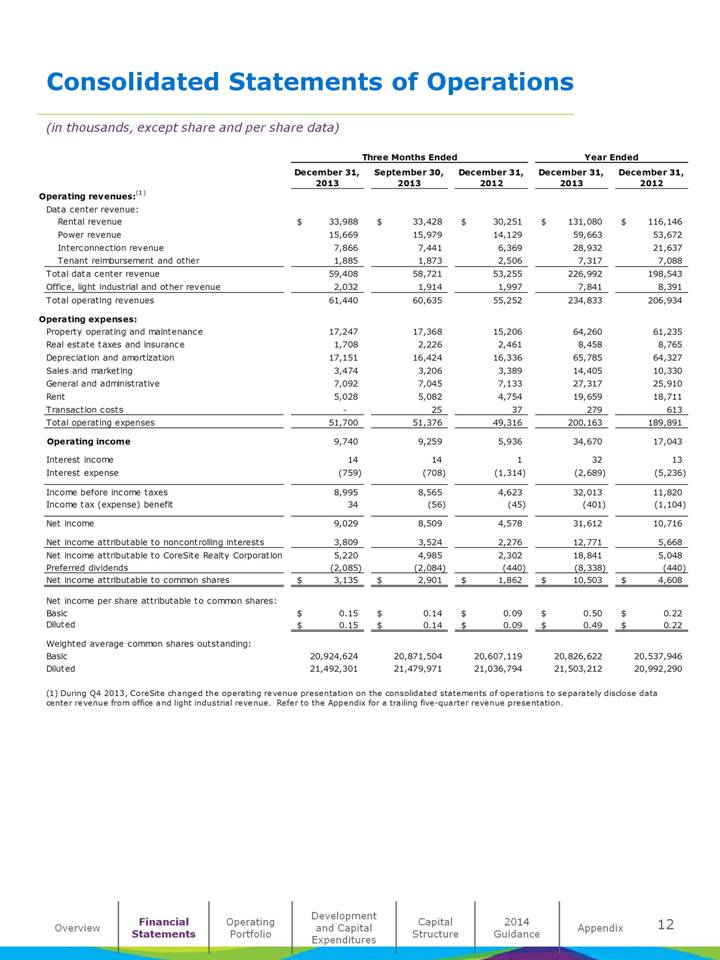
Consolidated Statements of Operations (in thousands, except share and per share data) Overview Financial Statements Operating Portfolio Development and Capital Expenditures Capital Structure 2014 Guidance Appendix Three Months Ended Year Ended December 31, 2013 September 30, 2013 December 31, 2012 December 31, 2013 December 31, 2012 Operating revenues:(1) Data center revenue: Rental revenue $ 33,988 $ 33,428 $ 30,251 $ 131,080 $ 116,146 Power revenue 15,669 15,979 14,129 59,663 53,672 Interconnection revenue 7,866 7,441 6,369 28,932 21,637 Tenant reimbursement and other 1,885 1,873 2,506 7,317 7,088 Total data center revenue 59,408 58,721 53,255 226,992 198,543 Office, light industrial and other revenue 2,032 1,914 1,997 7,841 8,391 Total operating revenues 61,440 60,635 55,252 234,833 206,934 Operating expenses: Property operating and maintenance 17,247 17,368 15,206 64,260 61,235 Real estate taxes and insurance 1,708 2,226 2,461 8,458 8,765 Depreciation and amortization 17,151 16,424 16,336 65,785 64,327 Sales and marketing 3,474 3,206 3,389 14,405 10,330 General and administrative 7,092 7,045 7,133 27,317 25,910 Rent 5,028 5,082 4,754 19,659 18,711 Transaction costs — 25 37 279 613 Total operating expenses 51,700 51,376 49,316 200,163 189,891 Operating income 9,740 9,259 5,936 34,670 17,043 Interest income 14 14 1 32 13 Interest expense (759) (708) (1,314) (2,689) (5,236) Income before income taxes 8,995 8,565 4,623 32,013 11,820 Income tax (expense) benefit 34 (56) (45) (401) (1,104) Net income 9,029 8,509 4,578 31,612 10,716 Net income attributable to noncontrolling interests 3,809 3,524 2,276 12,771 5,668 Net income attributable to CoreSite Realty Corporation 5,220 4,985 2,302 18,841 5,048 Preferred dividends (2,085) (2,084) (440) (8,338) (440) Net income attributable to common shares $ 3,135 $ 2,901 $ 1,862 $ 10,503 $ 4,608 Net income per share attributable to common shares: Basic $ 0.15 $ 0.14 $ 0.09 $ 0.50 $ 0.22 Diluted $ 0.15 $ 0.14 $ 0.09 $ 0.49 $ 0.22 Weighted average common shares outstanding: Basic 20,924,624 20,871,504 20,607,119 20,826,622 20,537,946 Diluted 21,492,301 21,479,971 21,036,794 21,503,212 20,992,290 (1) During Q4 2013, CoreSite changed the operating revenue presentation on the consolidated statements of operations to separately disclose data center revenue from office and light industrial revenue. Refer to the Appendix for a trailing five-quarter revenue presentation. |
|
|
Reconciliations of Net Income to FFO, AFFO and EBITDA (in thousands, except share and per share data) Reconciliation of Net Income to FFO Reconciliation of FFO to AFFO Reconciliation of Net Income to EBITDA and Adjusted EBITDA Overview Financial Statements Operating Portfolio Development and Capital Expenditures Capital Structure 2014 Guidance Appendix Reconciliations of Net Income to FFO, AFFO and EBITDA (in thousands, except per share data) Reconciliation of net income attributable to controlling interests to funds from operations (FFO): Three Months Ended Year Ended December 31, 2013 September 30, 2013 December 31, 2012 December 31, 2013 December 31, 2012 Net income $ 9,029 $ 8,509 $ 4,578 $ 31,612 $ 10,716 Real estate depreciation and amortization 16,146 15,443 15,566 62,040 61,700 FFO $ 25,175 $ 23,952 $ 20,144 $ 93,652 $ 72,416 Preferred stock dividends (2,085) (2,084) (440) (8,338) (440) FFO available to common shareholders and OP unit holders $ 23,090 $ 21,868 $ 19,704 $ 85,314 $ 71,976 Weighted average common shares outstanding - diluted 21,492,301 21,479,971 21,036,794 21,503,212 20,992,290 Weighted average OP units outstanding - diluted 25,360,848 25,353,942 25,353,709 25,355,567 25,347,936 Total weighted average shares and units outstanding - diluted 46,853,149 46,833,913 46,390,503 46,858,779 46,340,226 FFO per common share and OP unit - diluted $ 0.49 $ 0.47 $ 0.42 $ 1.82 $ 1.55 Reconciliation of FFO to adjusted funds from operations (AFFO): Three Months Ended Year Ended December 31, 2013 September 30, 2013 December 31, 2012 December 31, 2013 December 31, 2012 FFO available to common shareholders and unit holders $ 23,090 $ 21,868 $ 19,704 $ 85,314 $ 71,976 Adjustments: Amortization of deferred financing costs 446 445 374 1,739 1,681 Non-cash compensation 1,433 1,759 1,568 6,770 5,650 Non-real estate depreciation 1,005 981 770 3,745 2,627 Straight-line rent adjustment (304) (539) (720) (1,274) (3,597) Amortization of above and below market leases (152) (241) (264) (823) (1,505) Recurring capital expenditures (1,612) (1,174) (2,064) (5,420) (4,074) Tenant improvements (2,074) (1,578) (278) (6,292) (3,656) Capitalized leasing commissions (2,447) (959) (2,921) (5,698) (6,465) AFFO available to common shareholders and OP unit holders $ 19,385 $ 20,562 $ 16,169 $ 78,061 $ 62,637 Reconciliation of earnings before interest, taxes, depreciation and amortization (EBITDA): Three Months Ended Year Ended December 31, 2013 September 30, 2013 December 31, 2012 December 31, 2013 December 31, 2012 Net income $ 9,029 $ 8,509 $ 4,578 $ 31,612 $ 10,716 Adjustments: Interest expense, net of interest income 745 694 1,313 2,657 5,223 Income taxes (34) 56 45 401 1,104 Depreciation and amortization 17,151 16,424 16,336 65,785 64,327 EBITDA $ 26,891 $ 25,683 $ 22,272 $ 100,455 $ 81,370 Non-cash compensation 1,433 1,759 1,568 6,770 5,650 Transaction costs / litigation — 25 328 529 2,354 Adjusted EBITDA $ 28,324 $ 27,467 $ 24,168 $ 107,754 $ 89,374 |

|
|
Operating Properties (in thousands, except NRSF data) Overview Financial Statements Operating Portfolio Development and Capital Expenditures Capital Structure 2014 Guidance Appendix Stabilized Operating NRSF Data Center(1) Office and Light-Industrial(2) Total Pre-Stabilized NRSF(5) Development NRSF(6) Market/Facilities Annualized Rent ($000)(3) Total Percent Occupied(4) Total Percent Occupied(4) Total Percent Occupied(4) Total Total Total Portfolio NRSF Los Angeles One Wilshire Campus LA1* $ 24,175 150,278 75.2 % 7,500 41.0 % 157,778 73.6 % — — 157,778 LA2 14,650 159,617 85.4 6,055 55.6 165,672 84.3 31,585 236,902 434,159 Los Angeles Total 38,825 309,895 80.4 13,555 47.5 323,450 79.1 31,585 236,902 591,937 San Francisco Bay SV1 11,465 84,045 85.9 206,255 80.2 290,300 81.9 — — 290,300 SV2 6,335 76,676 68.4 — - 76,676 68.4 — — 76,676 Santa Clara Campus 22,383 220,676 91.4 71,308 91.5 291,984 91.4 31,497 173,240 496,721 San Francisco Bay Total 40,183 381,397 85.5 277,563 83.1 658,960 84.5 31,497 173,240 863,697 Northern Virginia VA1 21,791 201,719 75.9 61,050 79.4 262,769 76.7 — — 262,769 VA2 — — - — - — - — 198,000 198,000 DC1* 2,698 22,137 83.5 — - 22,137 83.5 — — 22,137 Northern Virginia Total 24,489 223,856 76.7 61,050 79.4 284,906 77.3 — 198,000 482,906 Boston BO1 12,666 166,026 93.4 19,495 58.7 185,521 89.7 — 87,650 273,171 Chicago CH1 11,355 158,167 81.2 4,946 62.3 163,113 80.6 20,240 — 183,353 New York NY1* 4,811 48,404 68.0 209 100.0 48,613 68.2 — — 48,613 NY2 — — - — - — - 18,103 236,956 255,059 New York Total 4,811 48,404 68.0 209 100.0 48,613 68.2 18,103 236,956 303,672 Miami MI1 1,698 30,176 44.3 1,934 38.6 32,110 44.0 — 13,154 45,264 Denver DE1* 660 4,144 98.7 — - 4,144 98.7 — — 4,144 DE2* 144 5,140 66.3 — - 5,140 66.3 — — 5,140 Denver Total 804 9,284 80.7 — — 9,284 80.7 — — 9,284 Total Facilities $134,831 1,327,205 81.7 % 378,752 79.5 % 1,705,957 81.2 % 101,425 945,902 2,753,284 |

|
|
Leasing Statistics Data Center Leasing Activity Overview Financial Statements Operating Portfolio Development and Capital Expenditures Capital Structure 2014 Guidance Appendix GAAP GAAP Leasing Number Total Annualized Annualized Rental Cash GAAP Activity of Leased Rent per Rent Churn Rent Rent Period Leases(1) NRSF(2) Leased NRSF(5) (000’s) Rate(3) Growth(4) Growth(4) New/expansion leases commenced YTD 2013 429 235,343 $ 102 (5) $ 24,083 Q4 2013 109 116,052 41 (5) 4,808 Q3 2013 110 37,243 180 6,688 Q2 2013 121 42,672 147 6,267 Q1 2013 89 39,376 161 6,320 Q4 2012 100 21,372 137 2,924 New/expansion leases signed YTD 2013 453 123,179 $ 149 $ 18,303 Q4 2013 122 26,276 132 3,472 Q3 2013 106 23,294 170 3,965 Q2 2013 115 30,810 188 5,782 Q1 2013 110 42,799 119 5,084 Q4 2012 100 156,704 74 11,583 Renewal leases commenced YTD 2013 351 172,380 $ 137 $ 23,682 7.8% 3.6% 13.3% Q4 2013 59 50,513 135 6,816 1.9% 3.5% 14.3% Q3 2013 100 29,567 155 4,575 2.7% 6.6% 10.7% Q2 2013 112 44,702 166 7,404 2.0% 2.9% 3 9.0% Q1 2013 80 47,598 103 4,887 1.1% 2.0% 21.6% Q4 2012 50 52,225 140 7,323 2.1% 11.7% 15.6% (1) Number of leases represents each agreement with a customer; a lease agreement could include multiple spaces and a customer could have multiple leases. (2) Total leased NRSF is determined based on contractually leased square feet for leases that have commenced on or before December 31, 2013. We calculate occupancy based on factors in addition to contractually leased square feet, including required data center support space (such as the mechanical, telecommunications and utility rooms) and building common areas. (3) Rental churn is calculated based on the annualized rental revenue of expired leases terminated in the period, compared with total annualized rental revenue at the beginning of the period. (4) Rent growth represents the increase in rental rates on renewed leases commencing during the period, as compared with the previous rental rates for the same space. (5) The GAAP Annualized Rent per Leased NRSF for new/expansion leases commenced in Q4 2013 includes a 101,721 NRSF built-to-suit lease. Excluding this lease, the GAAP Annualized Rent per Leased NRSF for new/expansion leases commenced in Q4 2013 would have been $116 and the fiscal year 2013 would have been $157. |

|
|
Leasing Statistics Lease Expirations (total operating properties, excluding pre-stabilized) Lease Distribution (total operating properties, excluding pre-stabilized) Overview Financial Statements Operating Portfolio Development and Capital Expenditures Capital Structure 2014 Guidance Appendix Total Annualized Number Operating Percentage Percentage Annualized Annualized Rent Per of NRSF of of Total Annualized of Rent Per Rent at Leased Leases Expiring Operating Rent Annualized Leased Expiration NRSF at Year of Lease Expiration Expiring(1) Leases NRSF ($000)(2) Rent NRSF ($000)(3) Expiration(4) Available as of December 31, 2013(5) - 320,417 18.8 % $ - - % $ - $ - $ - 2014 600 209,968 12.3 31,087 23.1 148.06 31,911 151.98 2015 265 166,433 9.8 28,440 21.1 170.88 29,887 179.57 2016 246 149,934 8.8 21,417 15.9 142.84 25,156 167.78 2017 112 125,627 7.4 19,619 14.6 156.17 25,665 204.30 2018 64 141,983 8.3 14,358 10.6 101.12 17,976 126.61 2019-Thereafter 31 290,499 17.0 12,912 9.6 44.45 20,860 71.81 Office and light industrial(6) 75 301,096 17.6 6,998 5.1 23.24 7,004 23.26 Portfolio Total / Weighted Average 1,393 1,705,957 100.0 % $ 134,831 100.0 % $ 97.31 $ 158,459 $ 114.37 (1) Includes leases that upon expiration will automatically be renewed, primarily on a month-to-month basis. Number of leases represents each agreement with a customer; a lease agreement could include multiple spaces and a customer could have multiple leases. (2) Represents the monthly contractual rent under existing commenced customer leases as of December 31, 2013, multiplied by 12. This amount reflects total annualized base rent before any one-time or non-recurring rent abatements and excludes power revenue, interconnection revenue and operating expense reimbursement. (3) Represents the final monthly contractual rent under existing customer leases as of December 31, 2013, multiplied by 12. This amount reflects total annualized base rent before any one-time or non-recurring rent abatements and excludes operating expense reimbursement, power revenue and interconnection revenue. (4) Annualized rent at expiration as defined above, divided by the square footage of leases expiring in the given year. This metric reflects the rent growth inherent in the existing base of lease agreements. (5) Excludes NRSF held for development or under construction. (6) Of the occupied office and light industrial leases, 17,116 NRSF, 4,638 NRSF, 90,981 NRSF, 33,477 NRSF, 4,207 NRSF and 150,677 NRSF are scheduled to expire in 2014, 2015, 2016, 2017, 2018 and 2019 and thereafter, respectively, which accounts for (in thousands) $427, $86, $1,666, $494, $108 and $4,217 of annualized rent scheduled to expire during each respective period. Total Percentage Percentage Number Percentage Operating of Total Annualized of of of All NRSF of Operating Rent Annualized Square Feet Under Lease(1) Leases(2) Leases Leases(3) NRSF ($000)(4) Rent Available colocation(5) — — % 242,761 14.2 % $ — - % Available office and light-industrial — — 77,656 4.6 — - Colocation NRSF: 5,000 or less 1,273 91.4 441,717 25.9 71,778 53.2 5,001 - 10,000 17 1.2 114,210 6.7 13,448 10.0 10,001 - 25,000 10 0.8 158,232 9.3 25,031 18.6 Greater than 25,000 2 0.1 60,807 3.6 7,161 5.3 Powered shell 16 1.1 307,478 18.1 10,375 7.7 Office and light industrial 75 5.4 301,096 17.6 6,998 5.2 Portfolio Total 1,393 100.0 % 1,705,957 100.0 % $ 134,831 100.0 % (1) Represents all leases in our portfolio, including data center and office and light industrial leases. (2) Includes leases that upon expiration will automatically be renewed, primarily on a month-to-month basis. Number of leases represents each agreement with a customer; a lease agreement could include multiple spaces and a customer could have multiple leases. (3) Represents the square feet at a building under lease as specified in the lease agreements plus management’s estimate of space available for lease to third parties based on engineers’ drawings and other factors, including required data center support space (such as mechanical, telecommunications and utility rooms) and building common areas. (4) Represents the monthly contractual rent under existing commenced customer leases as of December 31, 2013, multiplied by 12. This amount reflects total annualized base rent before any one-time or non-recurring rent abatements and it excludes power revenue, interconnection revenue and operating expense reimbursement. (5) Excludes NRSF held for development or under construction. The following table sets forth information relating to the distribution of leases in the properties in our portfolio, based on NRSF (excluding space for development) under lease as of December 31, 2013. |


|
|
Geographic Diversification and 10 Largest Customers (in thousands, except NRSF data) Geographic Diversification 10 Largest Customers Overview Financial Statements Operating Portfolio Development and Capital Expenditures Capital Structure 2014 Guidance Appendix Percentage of Total Metropolitan Market Annualized Rent San Francisco Bay 29.8 % Los Angeles 28.7 Northern Virginia 18.2 Boston 9.4 Chicago 8.4 New York 3.6 Miami 1.3 Denver 0.6 Total 100.0 % Total Occupied NRSF(1) Percentage of Total Operating NRSF(2) Annualized Rent ($000)(3) Percentage of Annualized Rent(4) Weighted Average Remaining Lease Term in Months(5) Number of Locations Customer Industry CoreSite Vertical 1 Technology Digital Content 3 52,374 3.1 % $ 10,082 7.5 % 34 2 Technology Cloud 5 126,734 7.4 6,880 5.1 75 3 Technology Systems Integration & Managed Service Provider 3 53,014 3.1 6,562 4.9 44 4 Technology Digital Content 9 52,270 3.1 5,714 4.2 13 5 Government* Enterprise 1 141,774 8.3 4,079 3.0 95 6 Technology Cloud 1 27,036 1.6 3,969 2.9 53 7 Financial Enterprise 2 11,855 0.7 3,028 2.2 14 8 Technology Systems Integration & Managed Service Provider 1 6,034 0.4 2,569 1.9 13 9 Government Enterprise 2 16,764 1.0 2,324 1.7 9 10 Telecommunications Network 3 18,562 1.1 2,049 1.5 83 Total/Weighted Average 506,417 29.8 % $ 47,256 34.9 % 44 * Denotes customer using space for general office purposes. (1) Total occupied NRSF is determined based on contractually leased square feet for leases that have commenced on or before December 31, 2013. We calculate occupancy based on factors in addition to contractually leased square feet, including required data center support space (such as the mechanical, telecommunications and utility rooms) and building common areas. (2) Represents the customer’s total occupied square feet divided by the total operating NRSF in the portfolio which, as of December 31, 2013, consisted of 1,705,957 NRSF. (3) Represents the monthly contractual rent under existing commenced customer leases as of December 31, 2013, multiplied by 12. This amount reflects total annualized base rent before any one-time or non-recurring rent abatements and excludes power revenue, interconnection revenue and operating expense reimbursement. (4) Represents the customer’s total annualized rent divided by the total annualized rent in the portfolio as of December 31, 2013, which was approximately $134.8 million. (5) Weighted average based on percentage of total annualized rent expiring calculated as of December 31, 2013. |

|
|
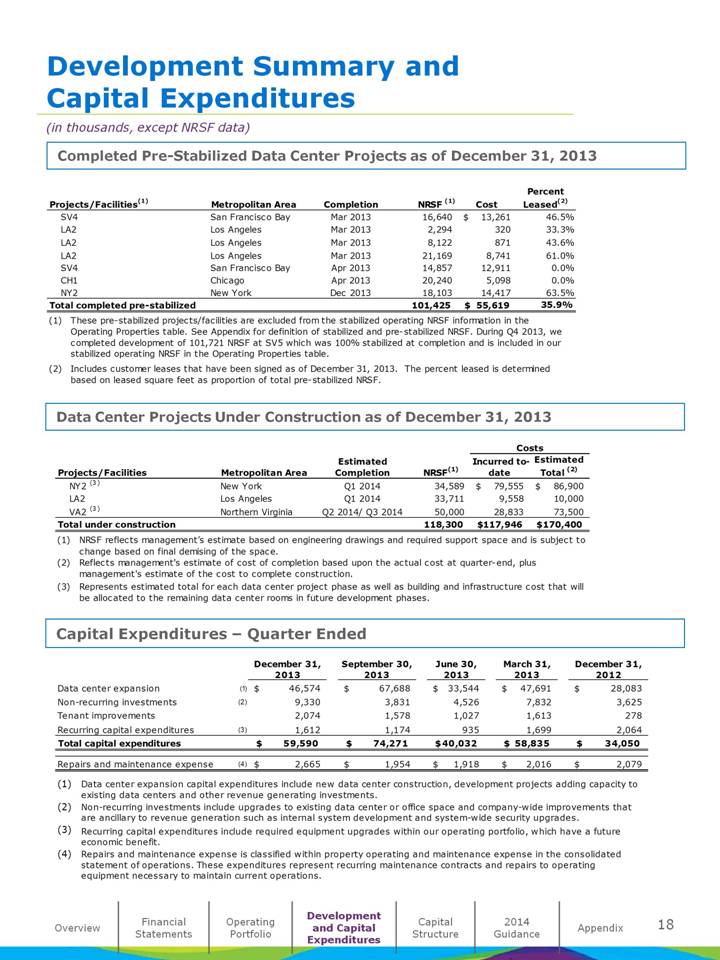
Development Summary and Capital Expenditures (in thousands, except NRSF data) Completed Pre-Stabilized Data Center Projects as of December 31, 2013 Data Center Projects Under Construction as of December 31, 2013 Capital Expenditures – Quarter Ended Overview Financial Statements Operating Portfolio Development and Capital Expenditures Capital Structure 2014 Guidance Appendix Projects/Facilities(1) Metropolitan Area Completion NRSF (1) Cost Percent Leased(2) SV4 San Francisco Bay Mar 2013 16,640 $ 13,261 46.5% LA2 Los Angeles Mar 2013 2,294 320 33.3% LA2 Los Angeles Mar 2013 8,122 871 43.6% LA2 Los Angeles Mar 2013 21,169 8,741 61.0% SV4 San Francisco Bay Apr 2013 14,857 12,911 0.0% CH1 Chicago Apr 2013 20,240 5,098 0.0% NY2 New York Dec 2013 18,103 14,417 63.5% Total completed pre-stabilized 101,425 $ 55,619 35.9% (1) These pre-stabilized projects/facilities are excluded from the stabilized operating NRSF information in the Operating Properties table. See Appendix for definition of stabilized and pre-stabilized NRSF. During Q4 2013, we completed development of 101,721 NRSF at SV5 which was 100% stabilized at completion and is included in our stabilized operating NRSF in the Operating Properties table. (2) Includes customer leases that have been signed as of December 31, 2013. The percent leased is determined based on leased square feet as proportion of total pre-stabilized NRSF. Costs Projects/Facilities Metropolitan Area Estimated Completion NRSF(1) Incurred to-date Estimated Total (2) NY2 (3) New York Q1 2014 34,589 $ 79,555 $ 86,900 LA2 Los Angeles Q1 2014 33,711 9,558 10,000 VA2 (3) Northern Virginia Q2 2014/ Q3 2014 50,000 28,833 73,500 Total under construction 118,300 $ 117,946 $ 170,400 (1) NRSF reflects management’s estimate based on engineering drawings and required support space and is subject to change based on final demising of the space. (2) Reflects management’s estimate of cost of completion based upon the actual cost at quarter-end, plus management’s estimate of the cost to complete construction. (3) Represents estimated total for each data center project phase as well as building and infrastructure cost that will be allocated to the remaining data center rooms in future development phases. December 31, 2013 September 30, 2013 June 30, 2013 March 31, 2013 December 31, 2012 Data center expansion (1) $ 46,574 $ 67,688 $ 33,544 $ 47,691 $ 28,083 Non-recurring investments (2) 9,330 3,831 4,526 7,832 3,625 Tenant improvements 2,074 1,578 1,027 1,613 278 Recurring capital expenditures (3) 1,612 1,174 935 1,699 2,064 Total capital expenditures $ 59,590 $ 74,271 $ 40,032 $ 58,835 $ 34,050 Repairs and maintenance expense (4) $ 2,665 $ 1,954 $ 1,918 $ 2,016 $ 2,079 (1) Data center expansion capital expenditures include new data center construction, development projects adding capacity to existing data centers and other revenue generating investments. (2) Non-recurring investments include upgrades to existing data center or office space and company-wide improvements that are ancillary to revenue generation such as internal system development and system-wide security upgrades. (3) Recurring capital expenditures include required equipment upgrades within our operating portfolio, which have a future economic benefit. (4) Repairs and maintenance expense is classified within property operating and maintenance expense in the consolidated statement of operations. These expenditures represent recurring maintenance contracts and repairs to operating equipment necessary to maintain current operations. |
|
|
Market Capitalization and Debt Summary (in thousands, except per share data) Market Capitalization Debt Summary (1) Outstanding as of: Debt Maturities (including new senior unsecured term loan and subsequent debt pay downs) Overview Financial Statements Operating Portfolio Development and Capital Expenditures Capital Structure 2014 Guidance Appendix Market Capitalization Shares or Equivalents Outstanding Market Price / Liquidation Value as of December 31, 2013 Market Value Equivalents Common shares 21,387 $32.19 $ 688,448 Operating partnership units 25,361 $32.19 816,371 Liquidation value of preferred stock 4,600 $25.00 115,000 Total equity 1,619,819 Total debt 232,500 Total enterprise value $ 1,852,319 Total debt to annualized adjusted EBITDA 2.1x Total debt and preferred stock to annualized adjusted EBITDA 3.1x Instrument Rate(2) Maturity Date Maturity Date with Extension December 31, 2013 December 31, 2012 SV1 - mortgage loan (3) 3.67% 10/9/2014 N/A $ 58,250 $ 59,750 Revolving credit facility (3) 2.17% 1/3/2017 1/3/2018 174,250 — Total Debt $ 232,500 $ 59,750 Weighted average debt rate 2.55% Preferred Stock 7.25% N/A N/A 115,000 115,000 Total Debt and Preferred Stock $ 347,500 $ 174,750 Floating rate vs. fixed rate debt 100% / 0% 100% / 0% Floating rate vs. fixed rate debt and preferred stock 67% / 33% 34% / 66% (1) See the most recent filed Form 10-K and 10-Q for information on specific debt instruments. (2) Each debt instrument’s interest rate is based on LIBOR at December 31, 2013, plus applicable spread. (3) On January 31, 2014, CoreSite entered into a $100.0 million, five year, senior unsecured term loan and used the proceeds to payoff the SV1 mortgage loan entirely and a portion of the outstanding revolving credit facility balance. |

|
|
Interest Summary and Debt Covenants (in thousands) Interest Expense Components Debt Covenants Overview Financial Statements Operating Portfolio Development and Capital Expenditures Capital Structure 2014 Guidance Appendix Three Months Ended Year Ended December 31, 2013 September 30, 2013 December 31, 2012 December 31, 2013 December 31, 2012 Interest expense and fees $ 1,652 $ 1,402 $ 1,304 $ 5,312 $ 5,392 Amortization of deferred financing costs 446 445 374 1,739 1,681 Capitalized interest (1,339) (1,139) (364) (4,362) (1,837) Total interest expense $ 759 $ 708 $ 1,314 $ 2,689 $ 5,236 Revolving Credit Facility Required Compliance December 31, 2013 September 30, 2013 June 30, 2013 March 31, 2013 December 31, 2012 Fixed charge coverage ratio Greater than 1.75x 7.2X 7.5x 7.7x 7.6x 12.1x Total indebtedness to gross asset value Less than 60% 15.5% 11.5% 10.0% 9.6% 7.6% Secured debt to gross asset value Less than 40% 3.7% 3.8% 4.0% 4.2% 5.2% Unhedged variable rate debt to gross asset value Less than 30% 14.9% 10.8% 9.0% 7.9% 5.2% Facility availability $405,000 $405,000 $405,000 $355,000 $355,000 Borrowings outstanding (174,250) (108,000) (73,000) (52,000) — Outstanding letters of credit (8,390) (8,390) (7,540) (8,540) (8,540) Current availability $222,360 $288,610 $324,460 $294,460 $346,460 |

|
|
2014 Guidance (in thousands, except per share amounts ) Overview Financial Statements Operating Portfolio Development and Capital Expenditures Capital Structure 2014 Guidance Appendix The annual guidance provided below represents forward-looking projections, which are based on current economic conditions, internal assumptions about our existing customer base and the supply and demand dynamics of the markets in which we operate. Further, the guidance does not include the impact of any future financing, investment or disposition activities. Please refer to the press release for additional information on forward-looking statements. Projected per share and OP unit information: Low High Net income attributable to common shares $ 0.50 $ 0.60 Real Estate depreciation and amortization 1.50 FFO $ 2.00 $ 2.10 Projected operating results: Total operating revenues $ 260,000 $ 270,000 Data center revenue $ 255,000 $ 265,000 General and administrative expenses $ 28,000 $ 30,000 Adjusted EBITDA $ 120,000 $ 125,000 Guidance drivers: Rental churn rate per quarter 1% 2% Cash rent growth on data center renewals 1% 4% Capital expenditures: Data center expansion $ 90,000 $ 105,000 Non-recurring investments $ 15,000 $ 20,000 Tenant improvements $ 5,000 $ 10,000 Recurring capital expenditures $ 5,000 $ 10,000 Total capital expenditures $ 115,000 $ 145,000 |

|
|
Appendix During Q4 2013, CoreSite changed the revenue presentation on the consolidated statements of operations to separately disclose data center revenue from office and light industrial revenue . The trailing five-quarter new revenue presentation is disclosed below: Definitions This document includes certain non-GAAP financial measures that management believes are helpful in understanding our business, as further described below. Our definition and calculation of non-GAAP financial measures may differ from those of other REITs and therefore may not be comparable. The non-GAAP measures should not be considered an alternative to net income as an indicator of our performance and should be considered only a supplement to net income, cash flows from operating, investing or financing activities as a measure of profitability and/or liquidity, computed in accordance with GAAP. Turn-Key Same Store – Includes turn-key data center space that was leased and available to be leased to our colocation customers as of December 31, 2011, at each of our properties, and excludes powered shell data center space, SV3 data center space, office and light industrial space and space for which development was completed and became available to be leased after December 31, 2011.The turn-key same store space as of December 31, 2011, is 792,615 NRSF. Monthly Recurring Revenue per Cabinet Equivalent - Represents the turn-key monthly recurring colocation revenue (MRR) per cabinet equivalent billed. MRR is defined as recurring contractual revenue under existing commenced customer leases. MRR per Cabinet Equivalent is calculated as (Current Quarter MRR/3) divided by ((Quarter End Cabinet Equivalents Billed plus Prior Quarter End Cabinet Equivalents Billed)/2)). Stabilized and pre-stabilized NRSF - Projects and facilities that have been recently developed and are in the initial lease-up phase are classified as pre-stabilized NRSF until they reach 85% occupied or have been in service for 24 months. Pre-stabilized projects and facilities become stabilized operating properties at the earlier of achievement of 85% occupancy or 24 months after development completion and are included in the stabilized operating NRSF. Overview Financial Statements Operating Portfolio Development and Capital Expenditures Capital Structure 2014 Guidance Appendix Three Months Ended December 31, 2013 September 30, 2013 June 30, 2013 March 31, 2013 December 31, 2012 Operating revenues: Data center revenue: Rental revenue $ 33,988 $ 33,428 $ 32,355 $ 31,309 $ 30,251 Power revenue 15,669 15,979 14,486 13,529 14,129 Interconnection revenue 7,866 7,441 7,053 6,572 6,369 Tenant reimbursement and other 1,885 1,873 1,770 1,789 2,506 Total data center revenue 59,408 58,721 55,664 53,199 53,255 Office, light industrial and other revenue 2,032 1,914 2,003 1,892 1,997 Total operating revenues $ 61,440 $ 60,635 $ 57,667 $ 55,091 $ 55,252 |

|
|
Appendix Funds From Operations “FFO” is a supplemental measure of our performance which should be considered along with, but not as an alternative to, net income and cash provided by operating activities as a measure of operating performance and liquidity. We calculate FFO in accordance with the standards established by the National Association of Real Estate Investment Trusts (“NAREIT”). FFO represents net income (loss) (computed in accordance with GAAP), excluding gains (or losses) from sales of property and impairment write-downs of depreciable real estate, plus real estate related depreciation and amortization (excluding amortization of deferred financing costs) and after adjustments for unconsolidated partnerships and joint ventures. Our management uses FFO as a supplemental performance measure because, in excluding real estate related depreciation and amortization and gains and losses from property dispositions, it provides a performance measure that, when compared year over year, captures trends in occupancy rates, rental rates and operating costs. We offer this measure because we recognize that FFO will be used by investors as a basis to compare our operating performance with that of other REITs. However, because FFO excludes depreciation and amortization and captures neither the changes in the value of our properties that result from use or market conditions, nor the level of capital expenditures and capitalized leasing commissions necessary to maintain the operating performance of our properties, all of which have real economic effect and could materially impact our financial condition and results from operations, the utility of FFO as a measure of our performance is limited. FFO is a non-GAAP measure and should not be considered a measure of liquidity, an alternative to net income, cash provided by operating activities or any other performance measure determined in accordance with GAAP, nor is it indicative of funds available to fund our cash needs, including our ability to pay dividends or make distributions. In addition, our calculations of FFO are not necessarily comparable to FFO as calculated by other REITs that do not use the same definition or implementation guidelines or interpret the standards differently from us. Investors in our securities should not rely on these measures as a substitute for any GAAP measure, including net income. Overview Financial Statements Operating Portfolio Development and Capital Expenditures Capital Structure 2014 Guidance Appendix |

|
|
Appendix Adjusted Funds From Operations “AFFO” is a non-GAAP measure that is used as a supplemental operating measure specifically for comparing year over year ability to fund dividend distribution from operating activities. AFFO is used by us as a basis to address our ability to fund our dividend payments. We calculate adjusted funds from operations by adding to or subtracting from FFO: Plus: Amortization of deferred financing costs Plus: Non-cash compensation Plus: Non-real estate depreciation Plus: Below market debt amortization Less: Straight line rents adjustments Less: Above and below market leases Less: Maintenance capital investment Less: Tenant improvement capital investment Less: Capitalized leasing commissions AFFO is not intended to represent cash flow from operations for the period, and is only intended to provide an additional measure of performance by adjusting the effect of certain items noted above included in FFO. AFFO is a widely reported measure by other REITs, however, other REITs may use different methodologies for calculating AFFO and, accordingly, our AFFO may not be comparable to other REITs. Earnings before Interest, Taxes, Depreciation and Amortization (EBITDA) and Adjusted EBITDA - EBITDA is defined as earnings before interest, taxes, depreciation and amortization. We calculate adjusted EBITDA by adding our non-cash compensation expense, transaction costs and litigation expense to EBITDA as well as adjusting for the impact of gains or losses on early extinguishment of debt. Management uses EBITDA and adjusted EBITDA as indicators of our ability to incur and service debt. In addition, we consider EBITDA and adjusted EBITDA to be appropriate supplemental measures of our performance because they eliminate depreciation and interest, which permits investors to view income from operations without the impact of non-cash depreciation or the cost of debt. However, because EBITDA and adjusted EBITDA are calculated before recurring cash charges including interest expense and taxes, and are not adjusted for capital expenditures or other recurring cash requirements of our business, their utilization as a cash flow measurement is limited. Overview Financial Statements Operating Portfolio Development and Capital Expenditures Capital Structure 2014 Guidance Appendix |
