Attached files
| file | filename |
|---|---|
| 8-K - 8-K - PINNACLE WEST CAPITAL CORP | a14-5263_18k.htm |
Exhibit 99.1
|
|
DELIVERING SUPERIOR SHAREHOLDER VALUE Credit Suisse Energy Summit | February 10-12, 2014 |

|
|
FORWARD LOOKING STATEMENTS This presentation contains forward-looking statements based on current expectations, including statements regarding our earnings guidance and financial outlook and goals. These forward-looking statements are often identified by words such as “estimate,” “predict,” “may,” “believe,” “plan,” “expect,” “require,” “intend,” “assume” and similar words. Because actual results may differ materially from expectations, we caution you not to place undue reliance on these statements. A number of factors could cause future results to differ materially from historical results, or from outcomes currently expected or sought by Pinnacle West or APS. These factors include, but are not limited to: our ability to manage capital expenditures and operations and maintenance costs while maintaining reliability and customer service levels; variations in demand for electricity, including those due to weather, the general economy, customer and sales growth (or decline), and the effects of energy conservation measures and distributed generation; power plant and transmission system performance and outages; volatile fuel and purchased power costs; fuel and water supply availability; our ability to achieve timely and adequate rate recovery of our costs, including returns on debt and equity capital; regulatory and judicial decisions, developments and proceedings; new legislation or regulation, including those relating to environmental requirements, nuclear plant operations and potential deregulation of retail electric markets; our ability to meet renewable energy and energy efficiency mandates and recover related costs; risks inherent in the operation of nuclear facilities, including spent fuel disposal uncertainty; competition in retail and wholesale power markets; the duration and severity of the economic decline in Arizona and current real estate market conditions; the cost of debt and equity capital and the ability to access capital markets when required; changes to our credit ratings; the investment performance of the assets of our nuclear decommissioning trust, pension, and other postretirement benefit plans and the resulting impact on future funding requirements; the liquidity of wholesale power markets and the use of derivative contracts in our business; potential shortfalls in insurance coverage; new accounting requirements or new interpretations of existing requirements; generation, transmission and distribution facility and system conditions and operating costs; the ability to meet the anticipated future need for additional baseload generation and associated transmission facilities in our region; the willingness or ability of our counterparties, power plant participants and power plant land owners to meet contractual or other obligations or extend the rights for continued power plant operations; technological developments affecting the electric industry; and restrictions on dividends or other provisions in our credit agreements and Arizona Corporation Commission orders. These and other factors are discussed in Risk Factors described in Part I, Item 1A of the Pinnacle West/APS Annual Report on Form 10-K for the fiscal year ended December 31, 2012, which you should review carefully before placing any reliance on our financial statements, disclosures or earnings outlook. Neither Pinnacle West nor APS assumes any obligation to update these statements, even if our internal estimates change, except as required by law. In this presentation, references to net income and earnings per share (EPS) refer to amounts attributable to common shareholders. |
|
|
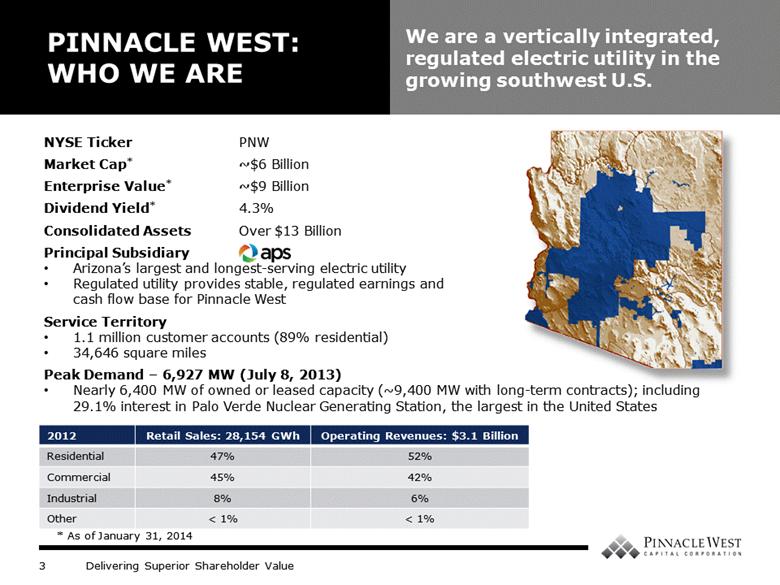
PINNACLE WEST: WHO WE ARE We are a vertically integrated, regulated electric utility in the growing southwest U.S. NYSE Ticker PNW Market Cap* ~$6 Billion Enterprise Value* ~$9 Billion Dividend Yield* 4.3% Consolidated Assets Over $13 Billion Principal Subsidiary Arizona’s largest and longest-serving electric utility Regulated utility provides stable, regulated earnings and cash flow base for Pinnacle West Service Territory 1.1 million customer accounts (89% residential) 34,646 square miles Peak Demand – 6,927 MW (July 8, 2013) Nearly 6,400 MW of owned or leased capacity (~9,400 MW with long-term contracts); including 29.1% interest in Palo Verde Nuclear Generating Station, the largest in the United States 2012 Retail Sales: 28,154 GWh Operating Revenues: $3.1 Billion Residential 47% 52% Commercial 45% 42% Industrial 8% 6% Other < 1% < 1% * As of January 31, 2014 |
|
|
VALUE PROPOSITION |
|
|
On December 30, 2013, APS and Southern California Edison (“SCE”) completed previously announced transaction whereby APS agreed to purchase SCE’s 48% interest in Units 4 and 5 of Four Corners Final purchase price: $182 million Estimated environmental compliance: $350 million, primarily in 2016-2017 APS will continue to operate Four Corners and now has total interest of about 970 MW APS filed Four Corner-specific revenue requirement on docket 11-0224 APS notified EPA that the Four Corners participants selected the BART alternative requiring APS to retire Units 1-3 by January 1, 2014 and install and operate SCR control technology on Units 4 and 5 by July 31, 2018 Next Step: ACC decision on revenue requirement expected later this year; rates in effect immediately following decision FOUR CORNERS POWER PLANT |
|
|
Motivation for Change SUSTAINABLE COST MANAGEMENT INITIATIVE (“SCMI”) Capitalize on changes driven by aging workforce Improve organizational efficiencies Strengthen governance and clarify accountability Refine understanding of cost structure to better identify opportunities Manage costs during regulatory stay-out Sustainable Changes Tiered Metrics Linked to incentives to drive accountability across all levels Business Planning To increase transparency and drive consistent, annual process across organization Corporate Resource Operating Model Align corporate support services with business needs to identify overlaps and gaps; centralize financial analysis and information technology Target Bottom of top-quartile staffing and costs by 2014 (IT by 2015) Enterprise Process Improvement A standardized, systematic approach to understanding our work and determining how we can do it better |
|
|
ARIZONA ECONOMIC INDICATORS Nonresidential Building Vacancy – Metro Phoenix New Home Sales & Single Family Permits Home Prices – Metro Phoenix Job Growth (Total Nonfarm) - Arizona Value Relative to Jan ‘05 YTD-Nov Vacancy Rate Office Retail YoY Change YTD-Nov |
|
|
OPERATIONAL EXCELLENCE Palo Verde Palo Verde has exceeded 30 million megawatt-hours annual production 8 times – the only U.S. plant to ever do so. Safety 2012 lowest number of recordable injuries in company history. Customer Satisfaction Ranked 5th highest nationally among 54 large investor-owned electric utilities in 2013 J.D. Power residential customer survey. Lowering Outage Time Per Customer Top quartile in industry over past several years. Average Outage Minutes/Year Target Million Megawatt Hours Rating Industry Average APS |
|
|
DIVIDEND GROWTH Pinnacle West’s annual dividend is $2.27 per share; targeting ~4% annual dividend growth Projected Annual Dividend Growth Approx. 4% Yield as of January 31, 2014 Payout 12 Months Ended September 30, 2013 Dividend Yield Dividend Payout PNW Industry Averages Future dividends subject to declaration at Board of Director’s discretion |
|
|
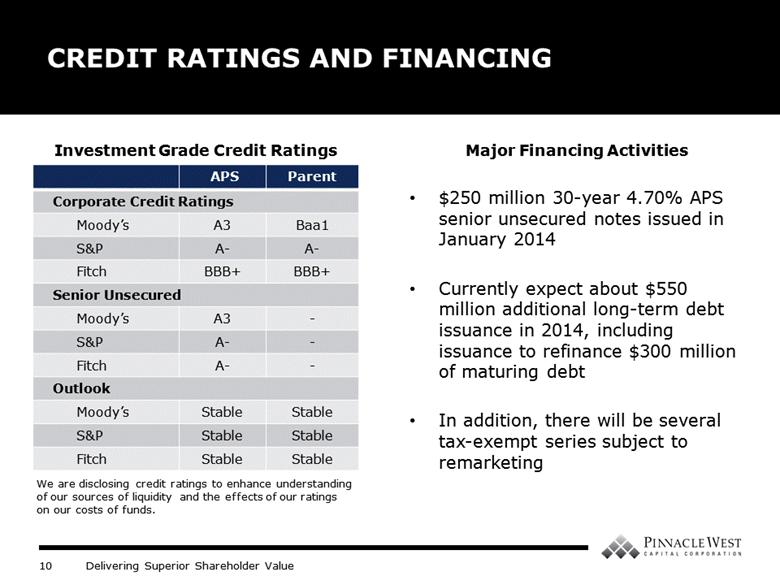
Major Financing Activities $250 million 30-year 4.70% APS senior unsecured notes issued in January 2014 Currently expect about $550 million additional long-term debt issuance in 2014, including issuance to refinance $300 million of maturing debt In addition, there will be several tax-exempt series subject to remarketing CREDIT RATINGS AND FINANCING APS Parent Corporate Credit Ratings Moody’s A3 Baa1 S&P A- A- Fitch BBB+ BBB+ Senior Unsecured Moody’s A3 - S&P A- - Fitch A- - Outlook Moody’s Stable Stable S&P Stable Stable Fitch Stable Stable We are disclosing credit ratings to enhance understanding of our sources of liquidity and the effects of our ratings on our costs of funds. Investment Grade Credit Ratings |
|
|
RESOURCE PLANNING Existing Owned Resources Includes retirement of Four Corners 1-3 Existing Contracts Four Corners 4-5 Resource Planning Requirement Load Requirement Including Reserves MW Coal Nuclear RE + DE EE Composition of Energy Mix by Resource Note: RE = Renewable Energy; DE = Distributed Energy; EE = Energy Efficiency |
|
|
OCOTILLO POWER PLANT Current Future State (2) Westinghouse 110 MW steam units (constructed 1960) Retire (2) Westinghouse 55 MW combustion turbines (constructed 1972/73) Maintain Install (5) GE 102 MW combustion turbines Net Capacity: 330 MW Net Capacity: 620 MW Net site capacity increased by 290 MW Ocotillo modernization project will maintain valley grid reliability and increase APS’s generating capacity by 290 MW Located in Tempe, AZ Expected project completion summer 2018 Estimated project cost of $600M - $700M in 2016-2018 Project Benefits Maintains system reliability through replacement of aging steam units Replacement units to meet needs for increased portfolio responsiveness Aids integration of renewables Environmental attributes |

|
|
REGULATORY CALENDAR LIST OF SELECTED DOCKETS Description Docket # 2012 Retail Rate Settlement (including Four Corners rate recovery and LFCR) E-01345A-11-0224 Energy Efficiency and Integrated Resource Planning* E-00000XX-13-0214 2014 Renewable Energy Standard Implementation Plan E-01345A-13-0140 Net Metering (2013 Decision No. 74202) E-01345A-13-0248 Innovations and Technological Developments in Generation and Delivery of Energy* E-00000J-13-0375 Value and Cost of Distributed Generation* E-00000J-14-0023 * Generic docket |
|
|
APPENDIX |
|
|
COST MANAGEMENT A variety of initiatives have been helping control operating and capital costs Ongoing effort to instill culture of cost management and efficiency Fleet operating model to streamline workforce and reduce costs Reduced production costs per kWh from 2.2¢ to 2.0¢ $30 million annual savings in capital and operating costs Reduced workforce by ~300 positions, operating and capital costs Results Sustainable Cost Management Initiative Fossil Generation Realignment Palo Verde Unit Production Cost Reductions Enterprise-wide Supply Chain Management Corporate Efficiency Study 2007 2008 2009 2010 2011 2012 2013 2014 2015 |
|
|
ARIZONA CORPORATION COMMISSION Three seats of four-year terms through January 2017 were addressed in the November 2012 election Bob Stump (R)* Chairman Brenda Burns (R) Gary Pierce (R)* Terms To January 2015 Terms To January 2017 Susan Bitter Smith (R) Bob Burns (R) Incumbents New Commissioners * Term limited |
|
|
Germany and Japan are among countries with highest installed solar capacity, yet have solar conditions far inferior to Arizona Arizona ranks 1st in the U.S. for solar energy development* RENEWABLE ENERGY RISES WITH THE SUN We are helping Arizona become the “Solar Capital of America” Arizona * Environment America Research & Policy |
|
|
Utility-scale photovoltaic solar plants to be owned by APS Constructive rate recovery through RES until included in base rates 118 MW in commercial operation to date; 150 MW by end of 2014 Commitments to date: 170 MW; $695 million estimated capital investment AZ SUN PROGRAM Owning solar resources makes sense for our customers and the environment and provides earnings growth potential Name Location Capacity Developer Actual or Target COD* Paloma Gila Bend, AZ 17 MW First Solar September 2011 Cotton Center Gila Bend, AZ 17 MW Solon October 2011 Hyder Phase 1 Hyder, AZ 11 MW SunEdison October 2011 Hyder Phase 2 Hyder, AZ 5 MW SunEdison February 2012 Chino Valley Chino Valley, AZ 19 MW SunEdison November 2012 Yuma Foothills Phase 1 Yuma, AZ 17 MW AMEC March 2013 Yuma Foothills Phase 2 Yuma, AZ 18 MW AMEC November 2013 Hyder II Hyder, AZ 14 MW McCarthy November 2013 Gila Bend Gila Bend, AZ 32 MW Black & Veatch 2Q 2014 City of Phoenix Buckeye, AZ 10 MW TBD 2Q 2015 Luke Air Force Base Glendale, AZ 10 MW TBD 4Q 2015 Total 170 MW As of December 31, 2013 * In-Service or Commercial Operation Date |
|
|
Customers with rooftop solar systems do not pay for all of the electric services they use (i.e. rooftop customers still need support from the grid 24 hours a day) These unpaid costs are then paid, through higher rates, by non-rooftop solar customers The issue will get bigger over time as applications and installs continue to increase NET METERING Rooftop solar customers still use the grid 24 hours a day TYPICAL GRID INTERACTION FOR ROOFTOP SOLAR |
|
|
Cumulative savings from energy efficiency programs must be equivalent to 22% of annual retail sales by 2020 Annual milestones in place to measure progress toward cumulative 2020 goal 3% by 2012 9.5% by 2015 22% by 2020 ARIZONA’S RENEWABLE RESOURCE AND ENERGY EFFICIENCY STANDARDS Portion of retail sales to be supplied by renewable resources 5% by 2015 15% by 2025 Distributed energy component 30% of total requirement by 2012 Energy Efficiency Requirements Renewable Energy (RES) Requirements APS on track to approximately double 2015 requirement APS on track to meet target through 2013 |
|
|
RETAIL SALES GROWTH (WEATHER-NORMALIZED) YoY Retail Sales Before Customer Programs Energy Efficiency & Customer Conservation Distributed Energy Weather-normalized retail sales growth less than 1% for 2013-2015 after impacts of energy efficiency, customer conservation and distributed renewable generation initiatives 85% of retail sales growth driven by customer growth, excluding customer programs mentioned above |
|
|
10-Year Transmission Plan filed January 2014 (115 kV and above) $496 million of transmission investment 275 miles of new lines Includes Hassayampa-North Gila (HANG2) ~110 miles; 500 kV Construction started March 2013 Estimated in-service mid 2015 Projects to deliver renewable energy approved by ACC Transmission investment diversifies regulatory risk Constructive regulatory treatment FERC formula rates and retail adjustor TRANSMISSION Strategic transmission investment is essential to maintain reliability and deliver diversified resources to customers Legend Planned lines Existing lines Proposed Delaney-Colorado River line Solar potential area Wind potential area |
|
|
FERC Formula Rates adopted in 2008 Adjusted annually with 10.75% allowed ROE Based on FERC Form 1 and certain projections Retail portion flows through ACC Transmission Cost Adjustor TRANSMISSION We have achieved constructive transmission rate treatment with annual adjustments Annual Revenue Rate Effective Date Retail Portion (TCA) $21 M 6/1/2013 Wholesale Portion $5 M 6/1/2013 Total Increase (Decrease) $26 M Equity Ratio 57% Rate Base (Year-End) $1.2 B Test Year 2012 Annual Revenue Rate Effective Date $18 M 8/1/2012 $(2) M 6/1/2012 $16 M 55% $1.2 B 2011 Annual Revenue Rate Effective Date $38 M 7/1/2011 $6 M 6/1/2011 $44 M 54% $1.2 B 2010 |
|
|
Mechanism Adopted / Last Adjusted Description Power Supply Adjustor (“PSA”) April 2005 / February 2014 Recovers variance between actual fuel and purchased power costs and base fuel rate Includes forward-looking, historical and transition components Renewable Energy Surcharge (“RES”) May 2008 / January 2014 Recovers costs related to renewable initiatives Collects projected dollars to meet RES targets Provides incentives to customers to install distributed renewable energy Demand-Side Management Adjustment Clause (“DSMAC”) April 2005 / March 2012 Recovers costs related to energy efficiency and DSM programs above $10 million in base rates Provides performance incentive to APS for net benefits achieved Provides rebates and other incentives to participating customers Environmental Improvement Surcharge (“EIS”) July 2007 / April 2013 Allows recovery of certain carrying costs for government-mandated environmental capital projects Capped at $5 million annually Transmission Cost Adjustor (“TCA”) April 2005 / June 2013 Recovers FERC-approved transmission costs related to retail customers Resets annually as result of FERC Formula Rate process (see below) FERC Formula Rates 2008 / June 2013 Recovers transmission costs based on historical costs per FERC Form 1 and certain projected data Lost Fixed Cost Recovery (“LFCR”) July 2012 / March 2013 Mitigates loss of portion of fixed costs related to ACC-approved energy efficiency and distributed renewable generation programs REGULATORY MECHANISMS We have achieved a more supportive regulatory structure and improvements in cost recovery timing |
|
|
Lost Fixed Cost Recovery (LFCR) was implemented as part of the July 2012 settlement Estimated to offset 30-40% of revenues lost due to ACC-mandated energy efficiency (EE) and distributed renewable generation (DG) initiatives Annual filing by January 15th each year with new rates in effect March 1st, based on the EE and DG savings from the preceding calendar year Subject to annual cap of 1% of company’s total revenues Revenue accrued each month as it is earned, creating a regulatory asset since the rates lag REGULATORY MECHANISMS Lost Fixed Cost Recovery 2013 ACC Order 2014 Rate Filing Rates Effective March 1, 2013 March 1, 2014 LFCR Rate 0.2% 0.95% Residential rate per lost kWh $0.031 $0.031 Non-residential rate per lost kWh $0.023 $0.023 LFCR Adjustment $5.1 Million $25.4 Million LFCR Revenue $7.3 Million (1) $22.6 Million (1) Represents six months in 2012. |
|
|
GENERATION PORTFOLIO Fuel/Plant Location Units Dispatch COD Ownership Interest1 Net Capacity (MW) NUCLEAR 1,146 MW Palo Verde Wintersburg, AZ 1-3 Base 1986-1989 29.1% 1,146 COAL 1,932 MW Cholla Joseph City, AZ 1-3 Base 1962-1980 100 647 Four Corners Farmington, NM 4, 5 Base 1969-1970 63 970 Navajo Page, AZ 1-3 Base 1974-1976 14 315 GAS/OIL COMBINED CYCLE 1,871 MW Redhawk Arlington, AZ 1, 2 Intermediate 2002 100 984 West Phoenix Phoenix, AZ 1-5 Intermediate 1976-2003 100 887 GAS/OIL STEAM TURBINES 220 MW Ocotillo Tempe, AZ 1, 2 Peaking 1960 100 220 GAS/OIL COMBUSTION TURBINES 1,088 MW Sundance Casa Grande, AZ 1-10 Peaking 2002 100 420 Yucca Yuma, AZ 1-6 Peaking 1971-2008 100 243 Saguaro Red Rock, AZ 1-3 Peaking 1972-2002 100 189 West Phoenix Phoenix, AZ 1, 2 Peaking 1972-1973 100 110 Ocotillo Tempe, AZ 1, 2 Peaking 1972-1973 100 110 Douglas Douglas, AZ 1 Peaking 1972 100 16 SOLAR 137 MW Hyder Hyder, AZ - As Available 2011-2012 100 16 Hyder II Hyder, AZ - As Available 2013 100 14 Paloma Gila Bend, AZ - As Available 2011 100 17 Cotton Center Gila Bend, AZ - As Available 2011 100 17 Chino Valley Chino Valley, AZ - As Available 2012 100 19 Yuma Foothills Yuma, AZ - As Available 2013 100 35 Distributed Energy Multiple AZ Facilities - As Available Various 100 15 Various Multiple AZ Facilities - As Available 1996-2006 100 4 Total Generation Capacity 6,394 MW 1 Includes leased generation plants. |
|
|
PURCHASED POWER CONTRACTS Fuel/Contract Location Owner/Developer Status1 PPA Signed COD Term (Years) Net Capacity (MW) SOLAR 310 MW Solana Gila Bend, AZ Abengoa IO Feb-2008 2013 30 250 RE Ajo Ajo, AZ Duke Energy Gen Svcs IO Jan-2010 2011 25 5 Sun E AZ 1 Prescott, AZ SunEdison IO Feb-2010 2011 30 10 Saddle Mountain Tonopah, AZ SunEdison IO Jan - 2011 2012 30 15 Badger Tonopah, AZ PSEG IO Jan-2012 2013 30 15 Gillespie Maricopa County, AZ Recurrent Energy IO Jan-2012 2013 30 15 WIND 289 MW Aragonne Mesa Santa Rosa, NM Ingifen Asset Mgmt IO Dec-2005 2006 20 90 High Lonesome Mountainair, NM Foresight / EME IO Feb-2008 2009 30 100 Perrin Ranch Wind Williams, AZ NextEra Energy IO Jul-2010 2012 25 99 GEOTHERMAL 10 MW Salton Sea Imperial County, CA Cal Energy IO Jan-2006 2006 23 10 BIOMASS 14 MW Snowflake Snowflake, AZ Novo Power IO Sep-2005 2008 15 14 BIOGAS 6 MW Glendale Landfill Glendale, AZ Glendale Energy LLC IO Jul-2008 2010 20 3 NW Regional Landfill Surprise, AZ Waste Management IO Dec-2010 2012 20 3 INTER-UTILITY 540 MW PacifiCorp Seasonal Power Exchange - PacifiCorp IO Sep-1990 1991 30 480 Not Disclosed Not Disclosed Not Disclosed IO May-2009 2010 10 60 HEAT RATE OPTIONS 650 MW Call Option - Not Disclosed IO Nov-2005 2007 8-9 500 Call Option - Not Disclosed IO Oct-2005 2007 10 150 CONVENTIONAL TOLLING 1,074 MW CC Tolling Not Disclosed Not Disclosed IO Mar-2006 2007 10 514 CC Tolling Not Disclosed Not Disclosed IO Aug-2007 2010 10 560 DEMAND RESPONSE 25 MW Demand Response Not Disclosed Not Disclosed IO Sep-2008 2010 15 25 WHOLESALE 90 MW Wholesale Contract Not Disclosed Not Disclosed IO Mar-2009 2010 5 90 Total Contracted Capacity 3,008 MW 1 UD = Under Development; UC = Under Construction; IO = In Operation |