Attached files
| file | filename |
|---|---|
| 8-K - FORM 8-K - OLIN Corp | form8kubspresentation02112.htm |
1 UBS SMID Cap One-on-One Symposium February 11, 2014 Exhibit 99.1
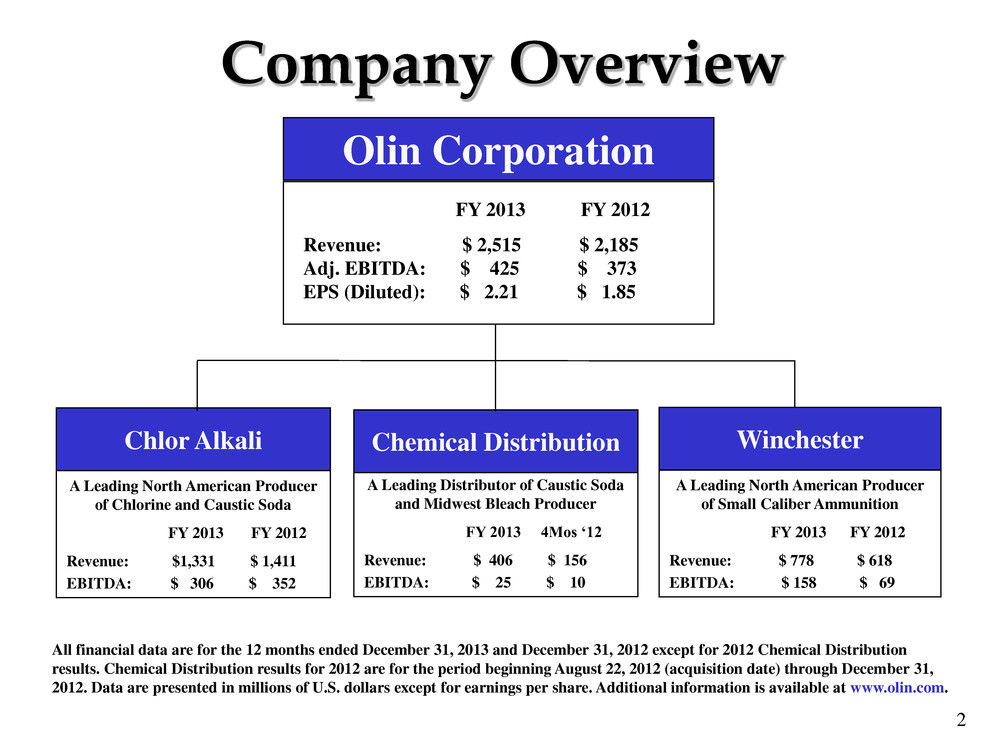
2 Company Overview All financial data are for the 12 months ended December 31, 2013 and December 31, 2012 except for 2012 Chemical Distribution results. Chemical Distribution results for 2012 are for the period beginning August 22, 2012 (acquisition date) through December 31, 2012. Data are presented in millions of U.S. dollars except for earnings per share. Additional information is available at www.olin.com. Winchester Chlor Alkali A Leading North American Producer of Chlorine and Caustic Soda FY 2013 FY 2012 Revenue: $1,331 $ 1,411 EBITDA: $ 306 $ 352 A Leading North American Producer of Small Caliber Ammunition FY 2013 FY 2012 Revenue: $ 778 $ 618 EBITDA: $ 158 $ 69 Revenue: $ 2,515 $ 2,185 Adj. EBITDA: $ 425 $ 373 EPS (Diluted): $ 2.21 $ 1.85 Olin FY 2013 FY 2012 Olin Corporation A Leading Distributor of Caustic Soda and Midwest Bleach Producer FY 2013 4Mos ‘12 Revenue: $ 406 $ 156 EBITDA: $ 25 $ 10 Chemical Distribution
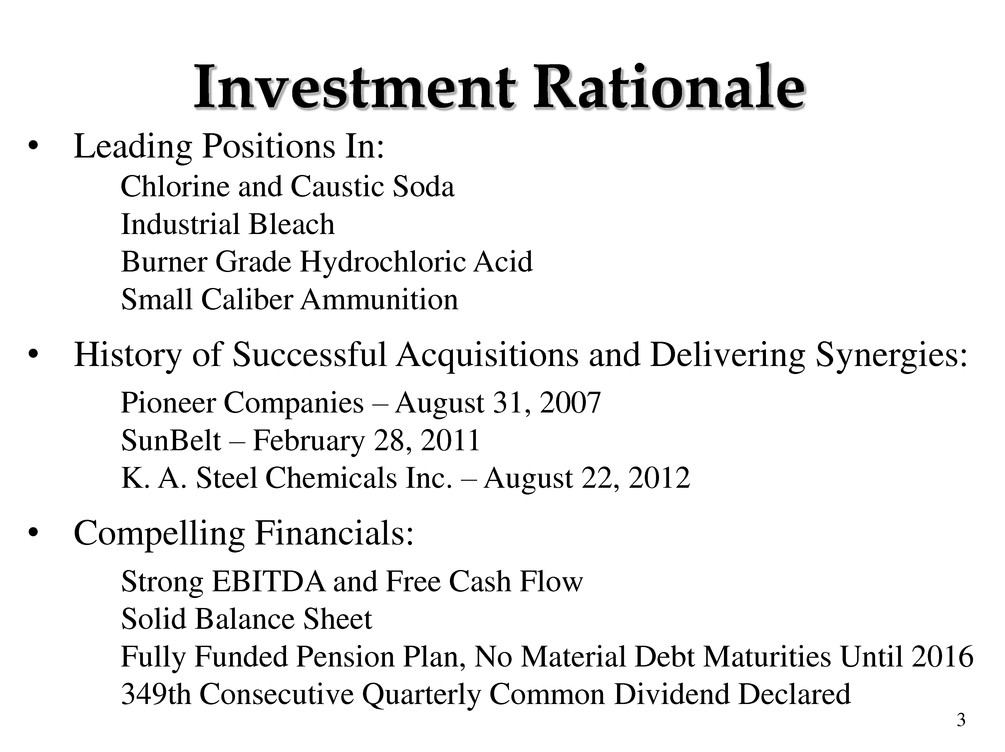
3 Investment Rationale • Leading Positions In: Chlorine and Caustic Soda Industrial Bleach Burner Grade Hydrochloric Acid Small Caliber Ammunition • History of Successful Acquisitions and Delivering Synergies: Pioneer Companies – August 31, 2007 SunBelt – February 28, 2011 K. A. Steel Chemicals Inc. – August 22, 2012 • Compelling Financials: Strong EBITDA and Free Cash Flow Solid Balance Sheet Fully Funded Pension Plan, No Material Debt Maturities Until 2016 349th Consecutive Quarterly Common Dividend Declared
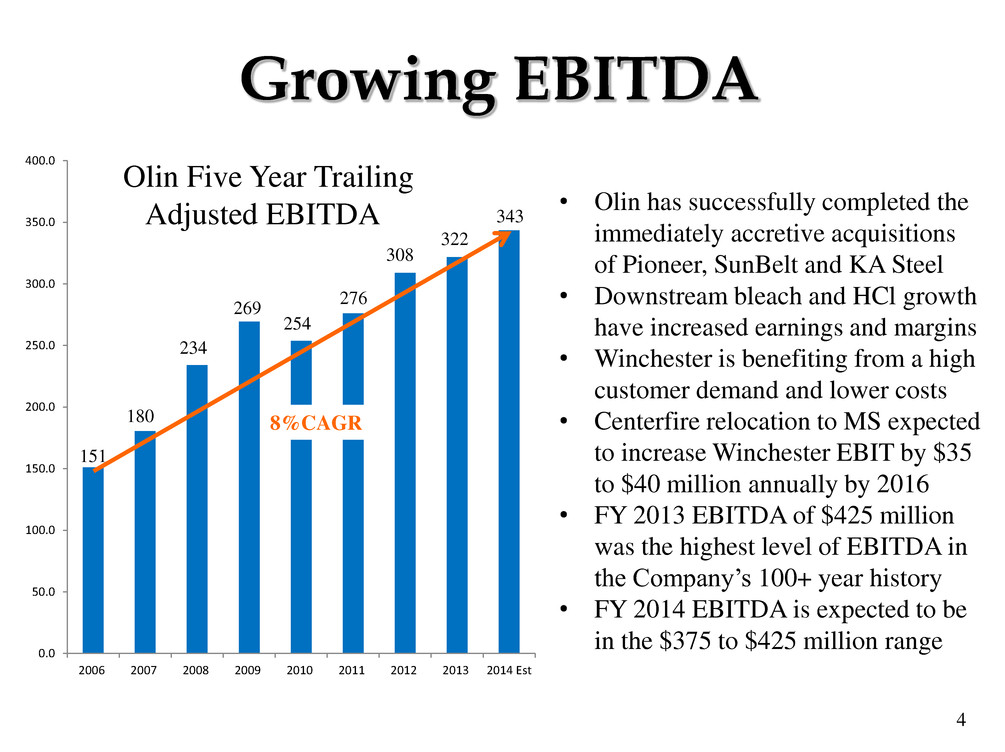
4 0.0 50.0 100.0 150.0 200.0 250.0 300.0 350.0 400.0 2006 2007 2008 2009 2010 2011 2012 2013 2014 Est 343 Growing EBITDA • Olin has successfully completed the immediately accretive acquisitions of Pioneer, SunBelt and KA Steel • Downstream bleach and HCl growth have increased earnings and margins • Winchester is benefiting from a high customer demand and lower costs • Centerfire relocation to MS expected to increase Winchester EBIT by $35 to $40 million annually by 2016 • FY 2013 EBITDA of $425 million was the highest level of EBITDA in the Company’s 100+ year history • FY 2014 EBITDA is expected to be in the $375 to $425 million range Olin Five Year Trailing Adjusted EBITDA 151 180 269 234 254 276 308 322 8%CAGR
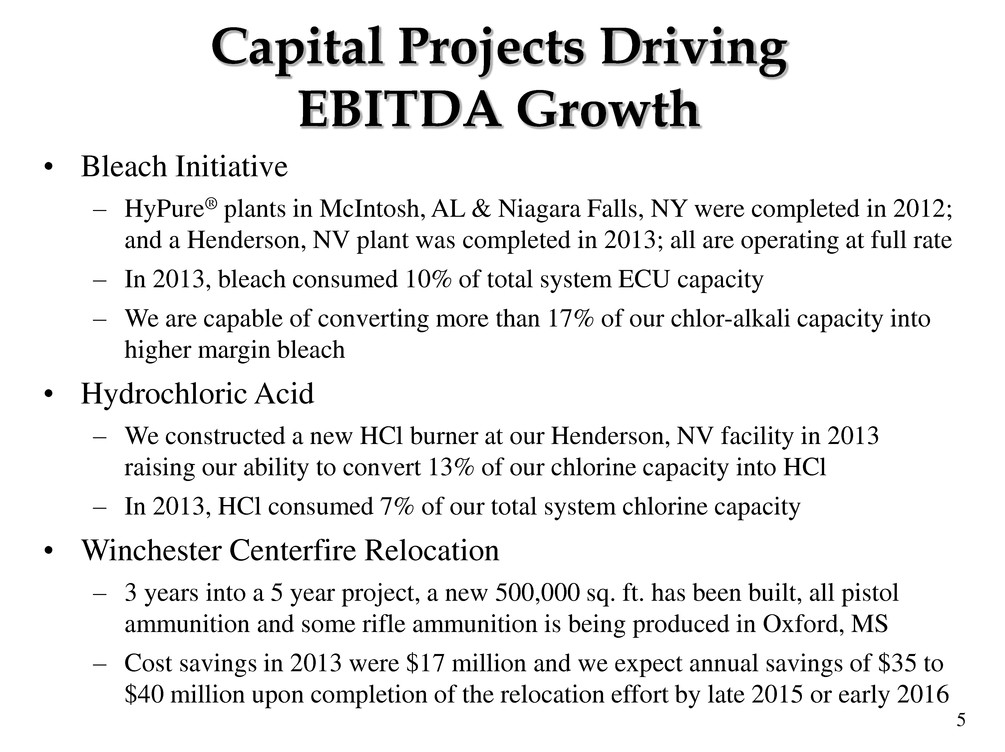
5 • Bleach Initiative – HyPure® plants in McIntosh, AL & Niagara Falls, NY were completed in 2012; and a Henderson, NV plant was completed in 2013; all are operating at full rate – In 2013, bleach consumed 10% of total system ECU capacity – We are capable of converting more than 17% of our chlor-alkali capacity into higher margin bleach • Hydrochloric Acid – We constructed a new HCl burner at our Henderson, NV facility in 2013 raising our ability to convert 13% of our chlorine capacity into HCl – In 2013, HCl consumed 7% of our total system chlorine capacity • Winchester Centerfire Relocation – 3 years into a 5 year project, a new 500,000 sq. ft. has been built, all pistol ammunition and some rifle ammunition is being produced in Oxford, MS – Cost savings in 2013 were $17 million and we expect annual savings of $35 to $40 million upon completion of the relocation effort by late 2015 or early 2016 Capital Projects Driving EBITDA Growth
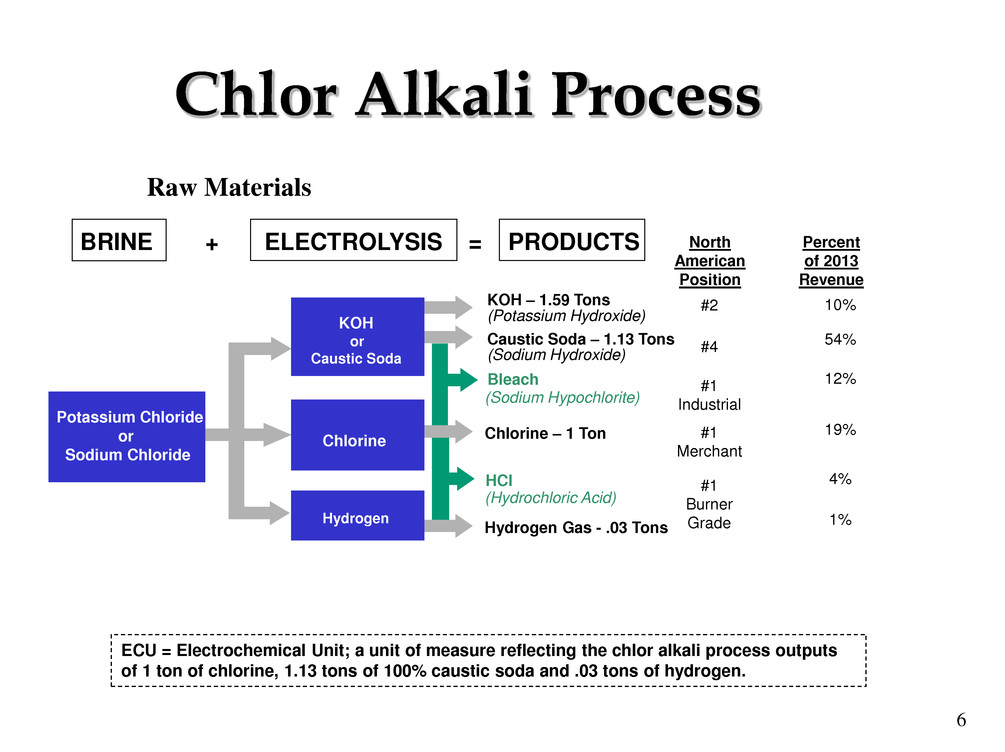
6 Chlor Alkali Process ECU = Electrochemical Unit; a unit of measure reflecting the chlor alkali process outputs of 1 ton of chlorine, 1.13 tons of 100% caustic soda and .03 tons of hydrogen. North American Position Percent of 2013 Revenue #2 #1 Industrial #1 Merchant #1 Burner Grade 54% 12% 4% 10% 19% 1% Raw Materials BRINE + ELECTROLYSIS = PRODUCTS Caustic Soda – 1.13 Tons (Sodium Hydroxide) (Potassium Hydroxide) Bleach (Sodium Hypochlorite) Chlorine – 1 Ton Potassium Chloride or Sodium Chloride KOH – 1.59 Tons HCl (Hydrochloric Acid) Hydrogen Gas - .03 Tons KOH or Caustic Soda Chlorine Hydrogen #4
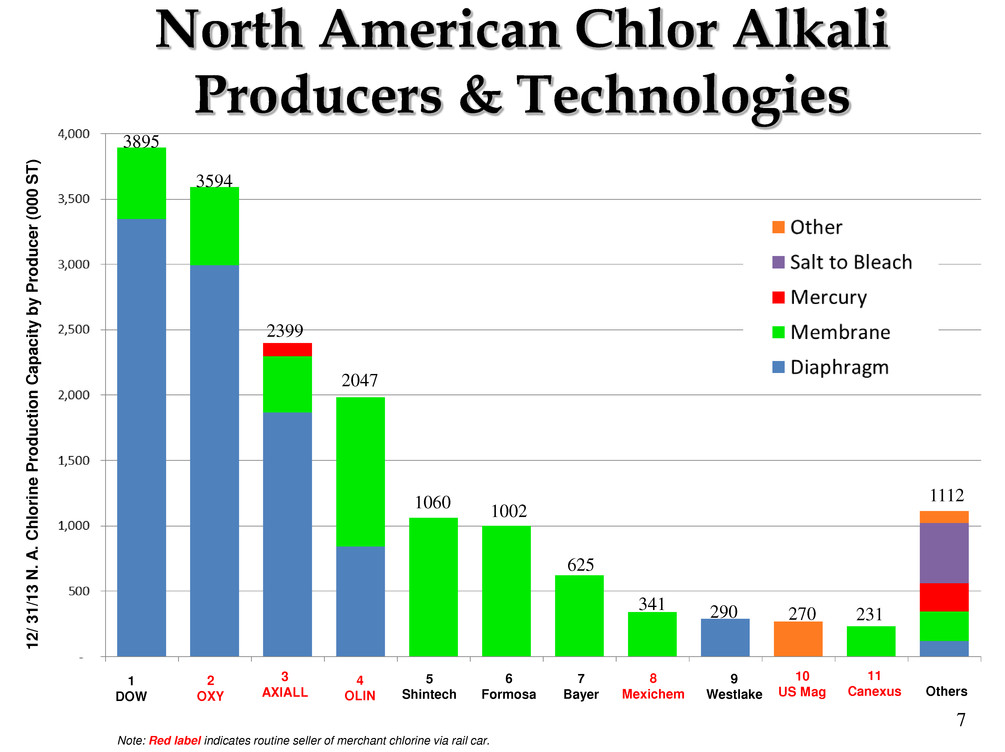
7 Note: Red label indicates routine seller of merchant chlorine via rail car. 1 2 / 3 1 /1 3 N. A . Chlor ine P roduction C a pa c it y b y P roduc e r (0 0 0 S T ) 1 DOW 2 OXY 3 AXIALL 4 OLIN 5 Shintech 6 Formosa 7 Bayer 8 Mexichem 9 Westlake 11 Canexus Others 10 US Mag North American Chlor Alkali Producers & Technologies 3895 2047 1060 1002 625 341 290 270 231 1112 3594 2399
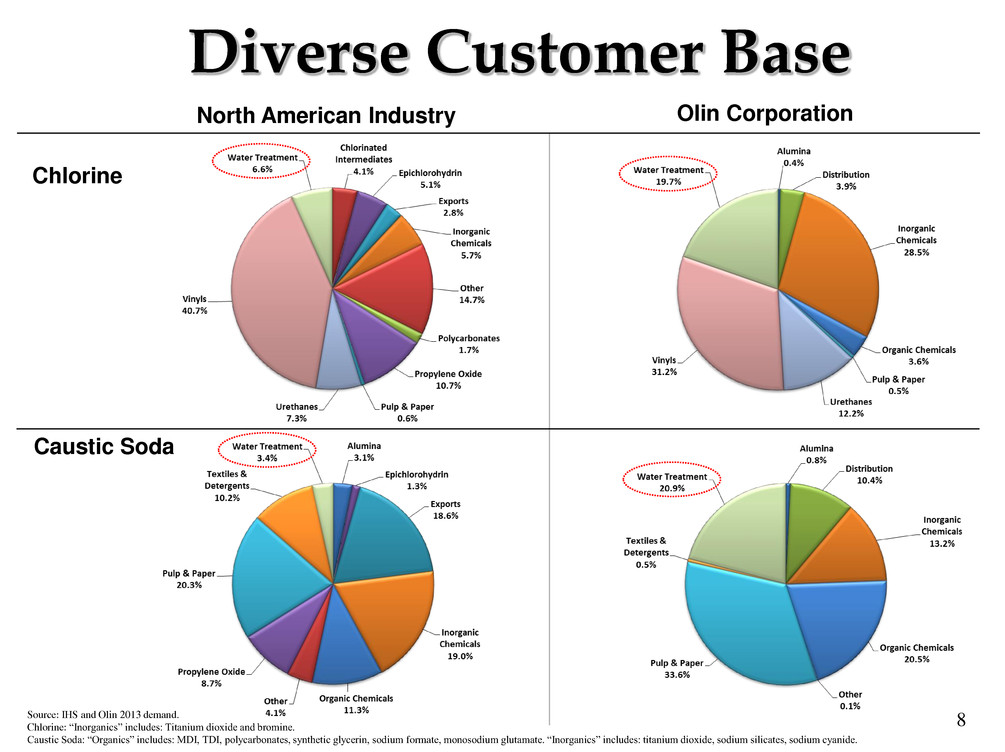
8 Diverse Customer Base Chlorine Caustic Soda North American Industry Olin Corporation Source: IHS and Olin 2013 demand. Chlorine: “Inorganics” includes: Titanium dioxide and bromine. Caustic Soda: “Organics” includes: MDI, TDI, polycarbonates, synthetic glycerin, sodium formate, monosodium glutamate. “Inorganics” includes: titanium dioxide, sodium silicates, sodium cyanide.
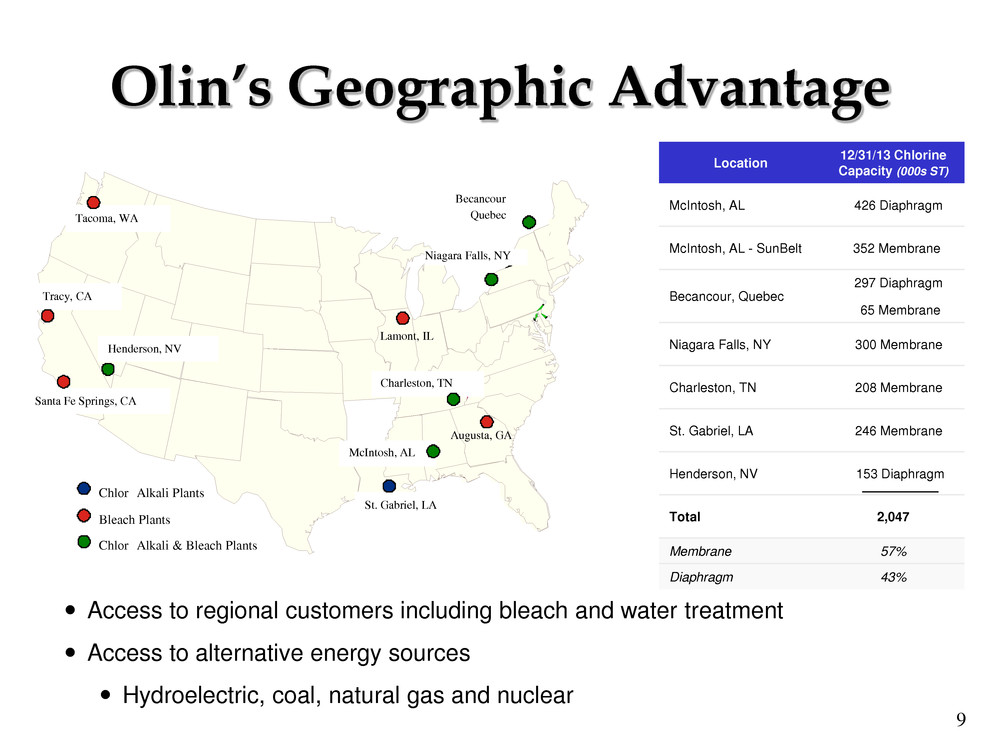
9 Location 12/31/13 Chlorine Capacity (000s ST) McIntosh, AL 426 Diaphragm McIntosh, AL - SunBelt 352 Membrane Becancour, Quebec 297 Diaphragm 65 Membrane Niagara Falls, NY 300 Membrane Charleston, TN 208 Membrane St. Gabriel, LA 246 Membrane Henderson, NV 153 Diaphragm Total 2,047 Membrane 57% Diaphragm 43% Olin’s Geographic Advantage Access to regional customers including bleach and water treatment Access to alternative energy sources Hydroelectric, coal, natural gas and nuclear 32 49 55 25 57 18 60 8 29 2 53 30 35 43 39 44 54 41 17 Chlor Alkali Plants Bleach Plants Chlor Alkali & Bleach Plants Tacoma, WA Tracy, CA Santa Fe Springs, CA Henderson, NV St. Gabriel, LA McIntosh, AL Charleston, TN Niagara Falls, NY Becancour Quebec Augusta, GA Lamont, IL
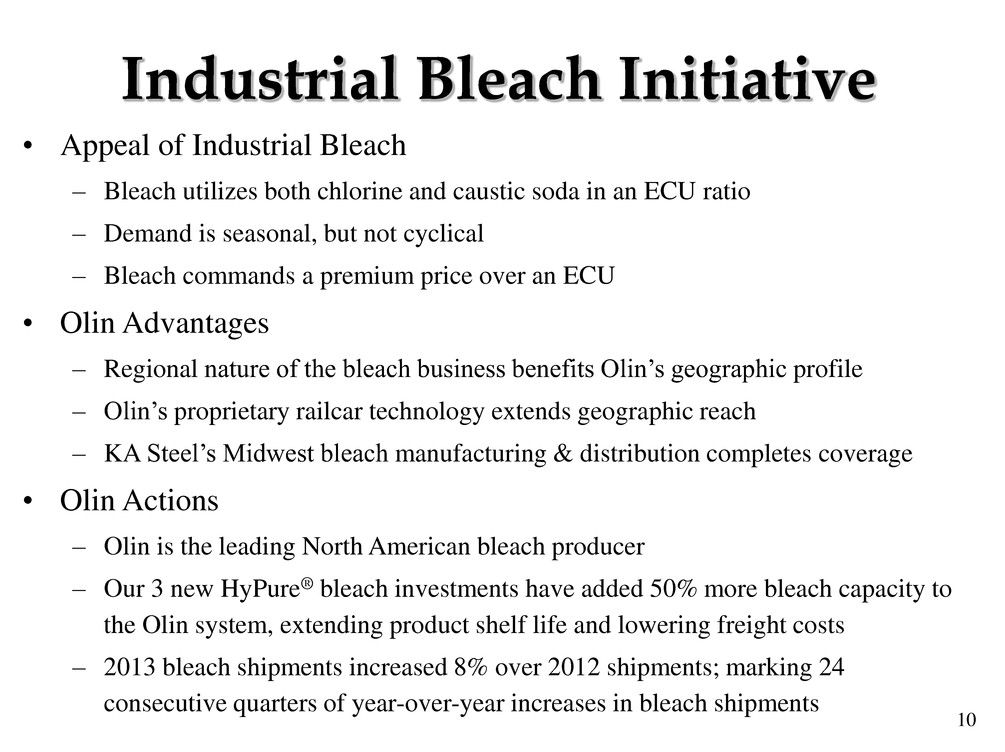
10 Industrial Bleach Initiative • Appeal of Industrial Bleach – Bleach utilizes both chlorine and caustic soda in an ECU ratio – Demand is seasonal, but not cyclical – Bleach commands a premium price over an ECU • Olin Advantages – Regional nature of the bleach business benefits Olin’s geographic profile – Olin’s proprietary railcar technology extends geographic reach – KA Steel’s Midwest bleach manufacturing & distribution completes coverage • Olin Actions – Olin is the leading North American bleach producer – Our 3 new HyPure® bleach investments have added 50% more bleach capacity to the Olin system, extending product shelf life and lowering freight costs – 2013 bleach shipments increased 8% over 2012 shipments; marking 24 consecutive quarters of year-over-year increases in bleach shipments
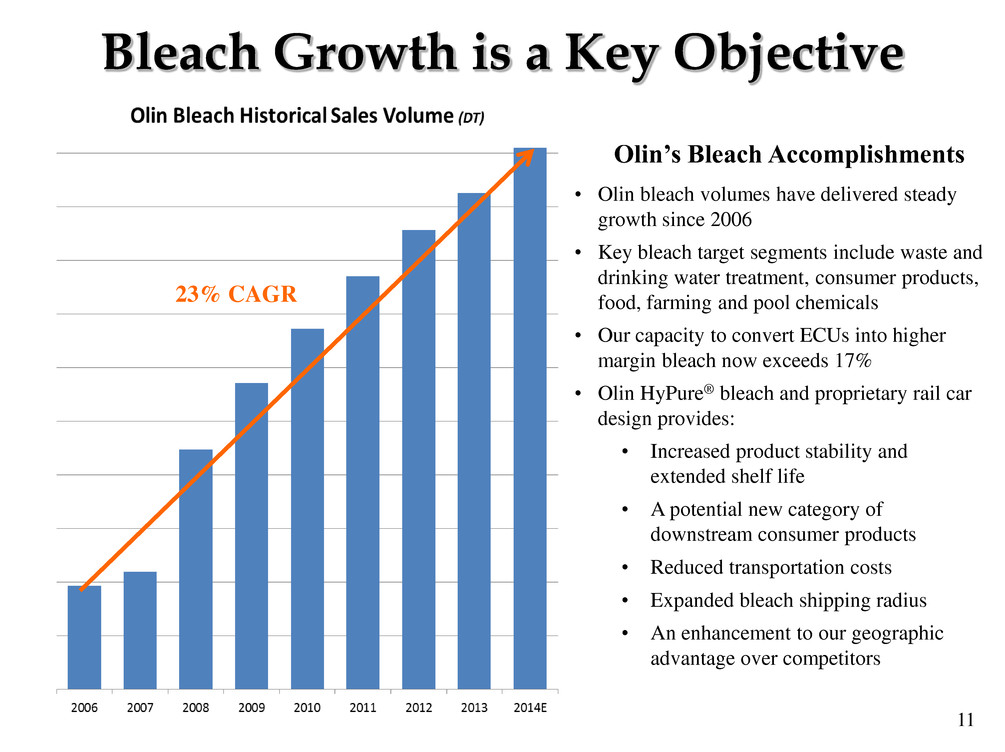
11 23% CAGR Bleach Growth is a Key Objective • Olin bleach volumes have delivered steady growth since 2006 • Key bleach target segments include waste and drinking water treatment, consumer products, food, farming and pool chemicals • Our capacity to convert ECUs into higher margin bleach now exceeds 17% • Olin HyPure® bleach and proprietary rail car design provides: • Increased product stability and extended shelf life • A potential new category of downstream consumer products • Reduced transportation costs • Expanded bleach shipping radius • An enhancement to our geographic advantage over competitors Olin’s Bleach Accomplishments
12 Hydrochloric Acid • Olin is the leading producer of Burner-grade HCl in North America with 5 manufacturing facilities in the United States and Canada • Currently 25% of HCl supply is “Burner-grade” or “on-purpose” HCl • By-product HCl accounts for 75% of the market supply, but availability is subject to urethane and fluorocarbon demand • Burner grade HCl is a reliable source, and while a small cost component in oil and gas exploration, is critical to the process • HCl is used in processing steel, artificial sweeteners, pharmaceuticals, food, ores and minerals; and in water, wastewater and brine treatments • Olin converted 7% of its chlorine capacity into higher margin HCl and now has the capability to consume 13% of its chlorine into HCl
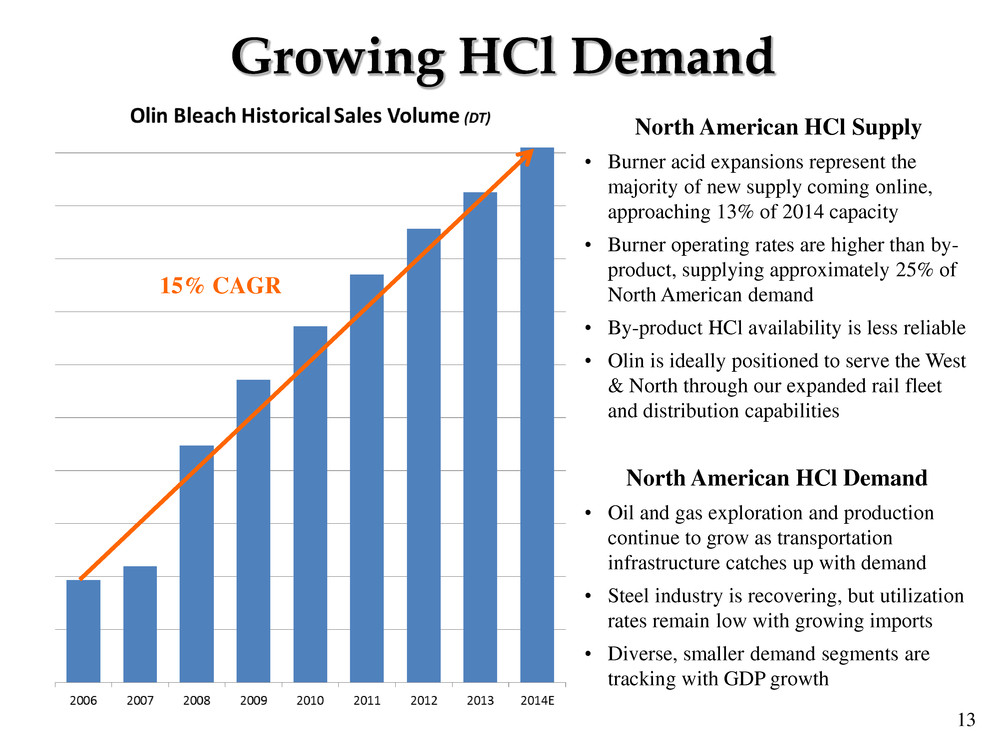
13 Growing HCl Demand North American HCl Supply • Burner acid expansions represent the majority of new supply coming online, approaching 13% of 2014 capacity • Burner operating rates are higher than by- product, supplying approximately 25% of North American demand • By-product HCl availability is less reliable • Olin is ideally positioned to serve the West & North through our expanded rail fleet and distribution capabilities North American HCl Demand • Oil and gas exploration and production continue to grow as transportation infrastructure catches up with demand • Steel industry is recovering, but utilization rates remain low with growing imports • Diverse, smaller demand segments are tracking with GDP growth 15% CAGR
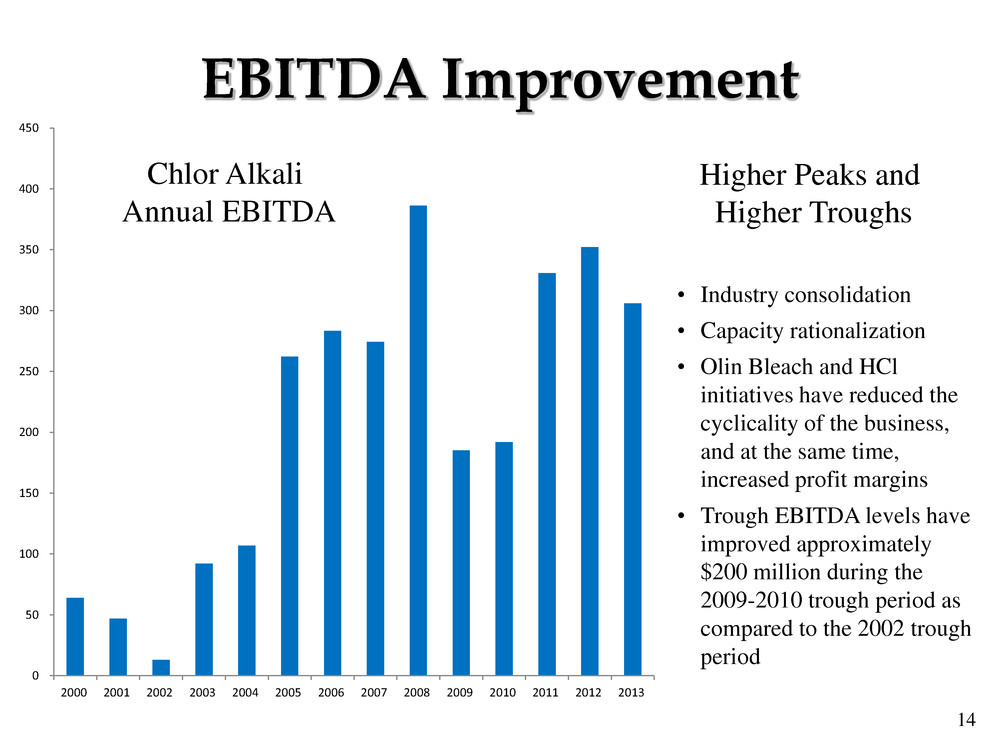
14 EBITDA Improvement 0 50 100 150 200 250 300 350 400 450 2000 2001 2002 2003 2004 2005 2006 2007 2008 2009 2010 2011 2012 2013 • Industry consolidation • Capacity rationalization • Olin Bleach and HCl initiatives have reduced the cyclicality of the business, and at the same time, increased profit margins • Trough EBITDA levels have improved approximately $200 million during the 2009-2010 trough period as compared to the 2002 trough period Higher Peaks and Higher Troughs Chlor Alkali Annual EBITDA
15 • KA Steel is one of the largest distributors of caustic soda in North America and manufactures and sells bleach in the Midwest • On August 22, 2012, we acquired KA Steel for $312 million in cash, subject to post-closing adjustments, and created Chemical Distribution segment • The Section 338(h)(10) tax election provides a $60 million NPV tax benefit to Olin; when considering this and the expected synergies, Olin paid an EBITDA multiple of approximately 4 times • 2013 Chemical Distribution sales were $406 million and Adjusted EBITDA was $25 million • The combination of the Chlor Alkali and Chemical Distribution segments is expected to generate approximately $35 million of synergies each year by the end of the third year of ownership (Q3 2015) • The transaction was financed through the sale of $200 million of 5.5%, 10- year notes and cash on hand KA Steel Acquisition
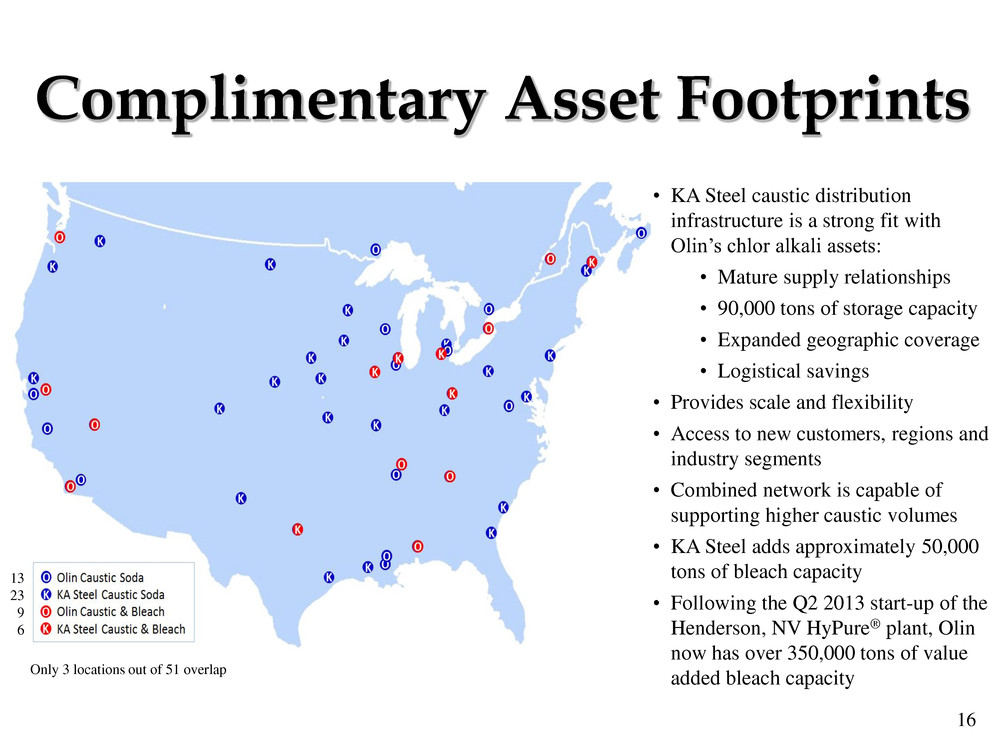
16 Complimentary Asset Footprints • KA Steel caustic distribution infrastructure is a strong fit with Olin’s chlor alkali assets: • Mature supply relationships • 90,000 tons of storage capacity • Expanded geographic coverage • Logistical savings • Provides scale and flexibility • Access to new customers, regions and industry segments • Combined network is capable of supporting higher caustic volumes • KA Steel adds approximately 50,000 tons of bleach capacity • Following the Q2 2013 start-up of the Henderson, NV HyPure® plant, Olin now has over 350,000 tons of value added bleach capacity 13 23 9 6 Only 3 locations out of 51 overlap
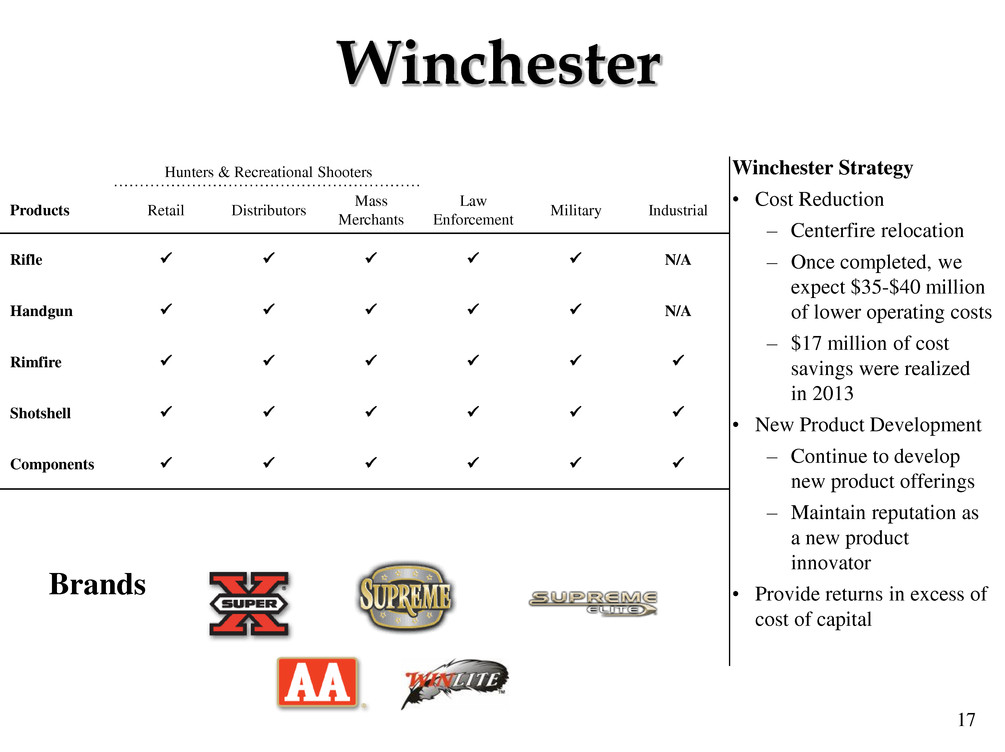
17 Winchester Winchester Strategy • Cost Reduction – Centerfire relocation – Once completed, we expect $35-$40 million of lower operating costs – $17 million of cost savings were realized in 2013 • New Product Development – Continue to develop new product offerings – Maintain reputation as a new product innovator • Provide returns in excess of cost of capital Hunters & Recreational Shooters Products Retail Distributors Mass Merchants Law Enforcement Military Industrial Rifle N/A Handgun N/A Rimfire Shotshell Components Brands
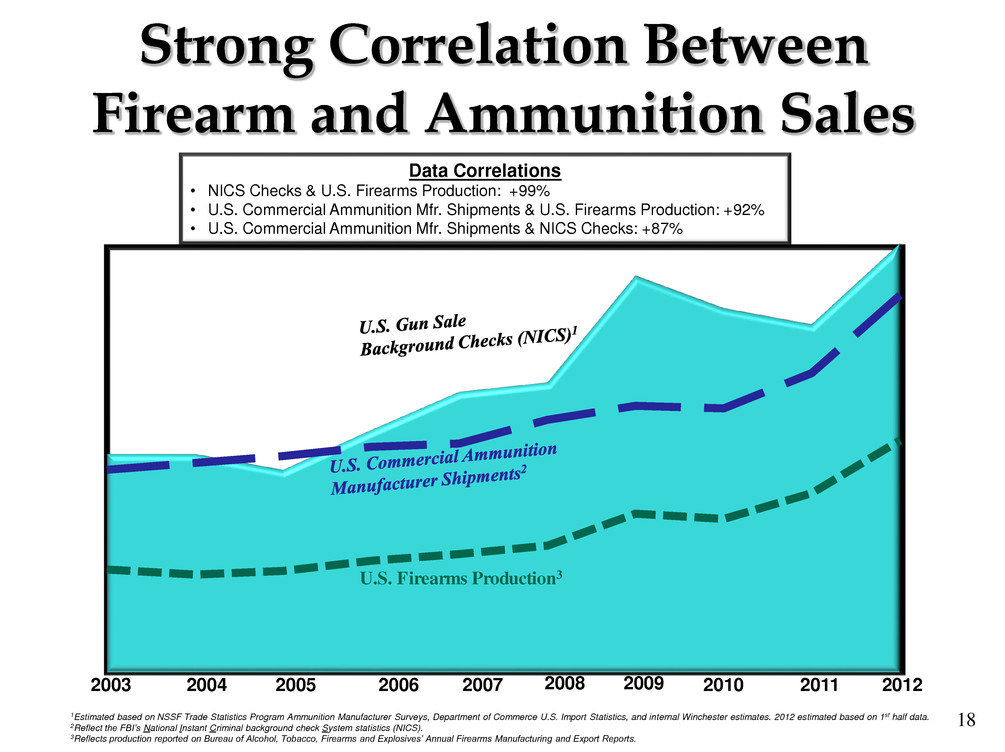
18 Strong Correlation Between Firearm and Ammunition Sales Data Correlations • NICS Checks & U.S. Firearms Production: +99% • U.S. Commercial Ammunition Mfr. Shipments & U.S. Firearms Production: +92% • U.S. Commercial Ammunition Mfr. Shipments & NICS Checks: +87% 1Estimated based on NSSF Trade Statistics Program Ammunition Manufacturer Surveys, Department of Commerce U.S. Import Statistics, and internal Winchester estimates. 2012 estimated based on 1st half data. 2Reflect the FBI’s National Instant Criminal background check System statistics (NICS). 3Reflects production reported on Bureau of Alcohol, Tobacco, Firearms and Explosives’ Annual Firearms Manufacturing and Export Reports. 2003 2004 2005 2006 2007 2008 2009 2010 2011 2012 U.S. Firearms Production3
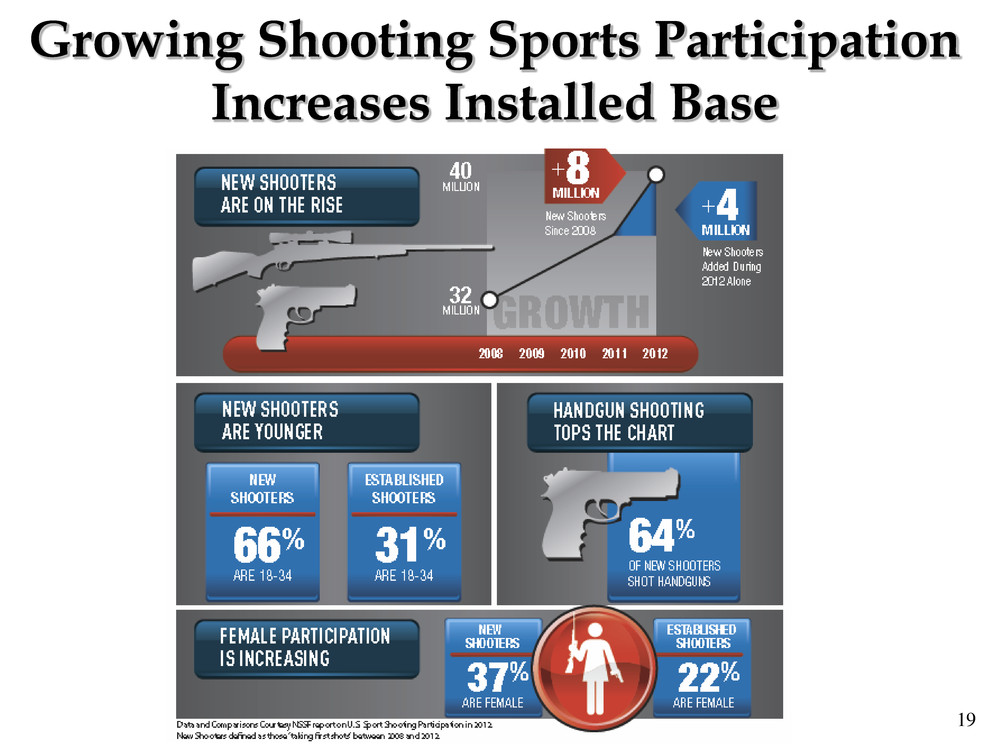
19 Growing Shooting Sports Participation Increases Installed Base
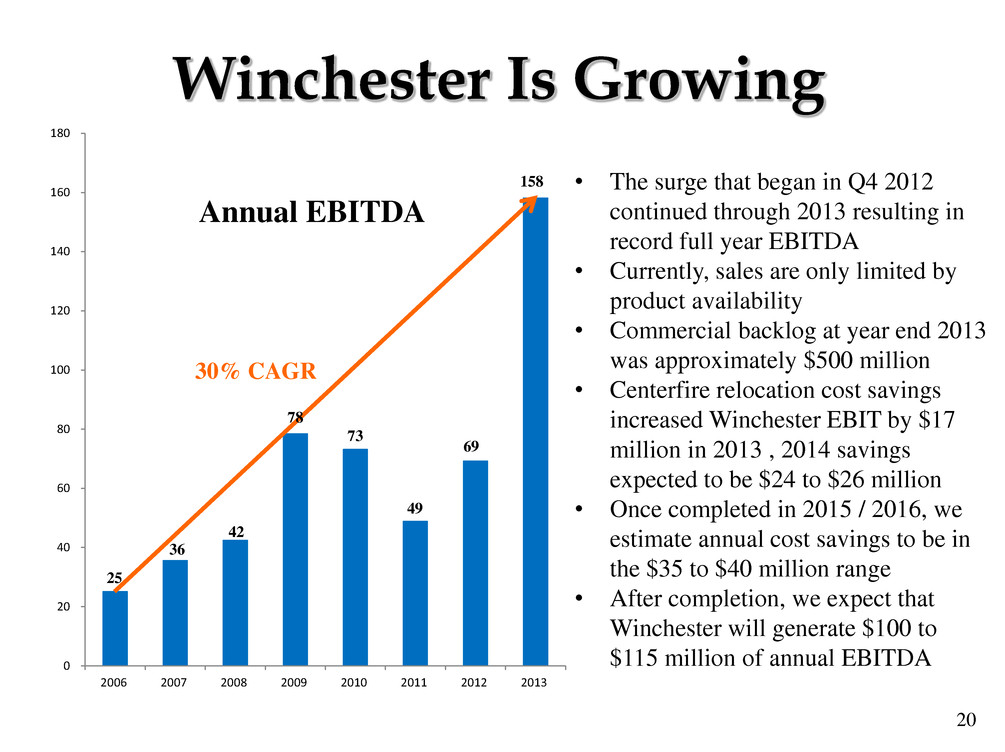
20 0 20 40 60 80 100 120 140 160 180 2006 2007 2008 2009 2010 2011 2012 2013 Winchester Is Growing • The surge that began in Q4 2012 continued through 2013 resulting in record full year EBITDA • Currently, sales are only limited by product availability • Commercial backlog at year end 2013 was approximately $500 million • Centerfire relocation cost savings increased Winchester EBIT by $17 million in 2013 , 2014 savings expected to be $24 to $26 million • Once completed in 2015 / 2016, we estimate annual cost savings to be in the $35 to $40 million range • After completion, we expect that Winchester will generate $100 to $115 million of annual EBITDA 30% CAGR Annual EBITDA 158 69 73 78 42 36 25 49
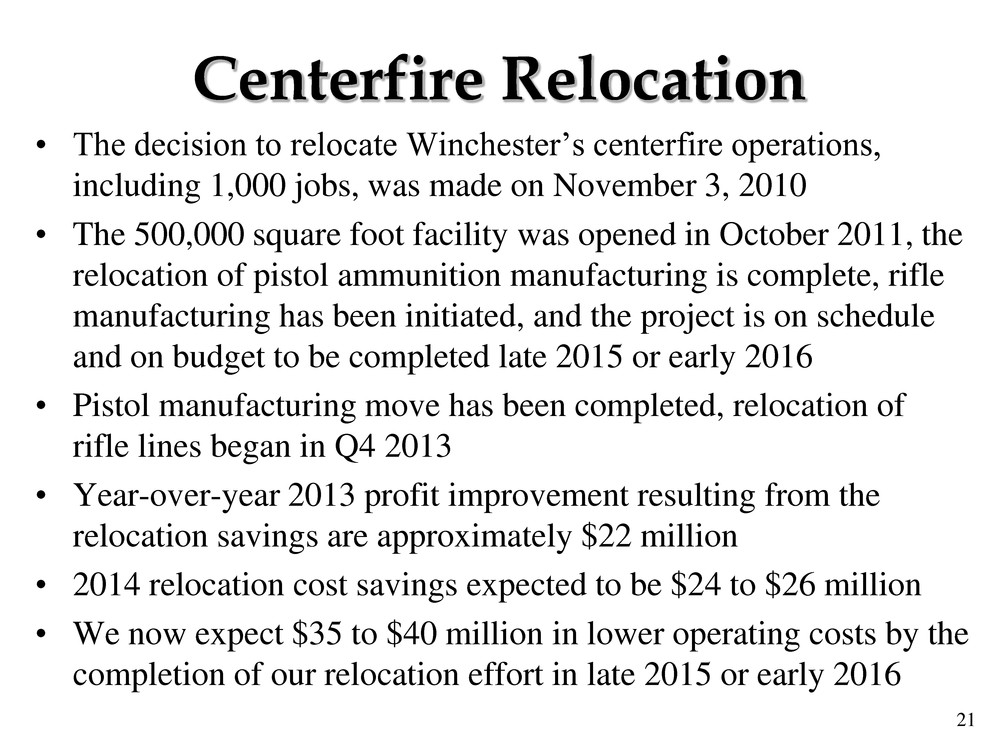
21 Centerfire Relocation • The decision to relocate Winchester’s centerfire operations, including 1,000 jobs, was made on November 3, 2010 • The 500,000 square foot facility was opened in October 2011, the relocation of pistol ammunition manufacturing is complete, rifle manufacturing has been initiated, and the project is on schedule and on budget to be completed late 2015 or early 2016 • Pistol manufacturing move has been completed, relocation of rifle lines began in Q4 2013 • Year-over-year 2013 profit improvement resulting from the relocation savings are approximately $22 million • 2014 relocation cost savings expected to be $24 to $26 million • We now expect $35 to $40 million in lower operating costs by the completion of our relocation effort in late 2015 or early 2016
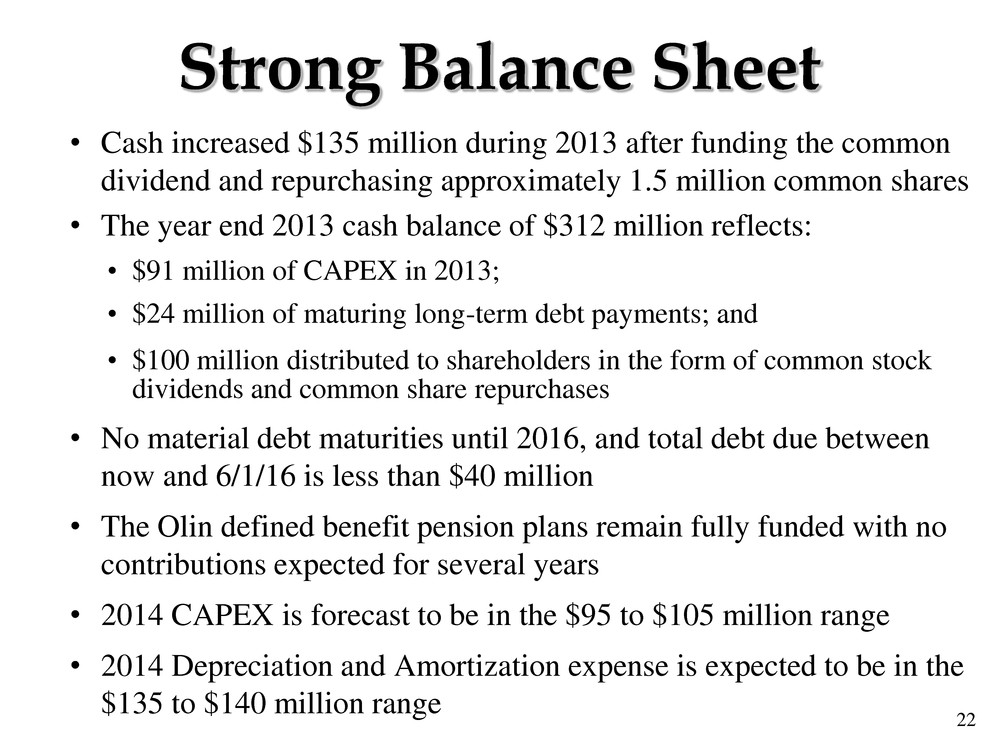
22 Strong Balance Sheet • Cash increased $135 million during 2013 after funding the common dividend and repurchasing approximately 1.5 million common shares • The year end 2013 cash balance of $312 million reflects: • $91 million of CAPEX in 2013; • $24 million of maturing long-term debt payments; and • $100 million distributed to shareholders in the form of common stock dividends and common share repurchases • No material debt maturities until 2016, and total debt due between now and 6/1/16 is less than $40 million • The Olin defined benefit pension plans remain fully funded with no contributions expected for several years • 2014 CAPEX is forecast to be in the $95 to $105 million range • 2014 Depreciation and Amortization expense is expected to be in the $135 to $140 million range
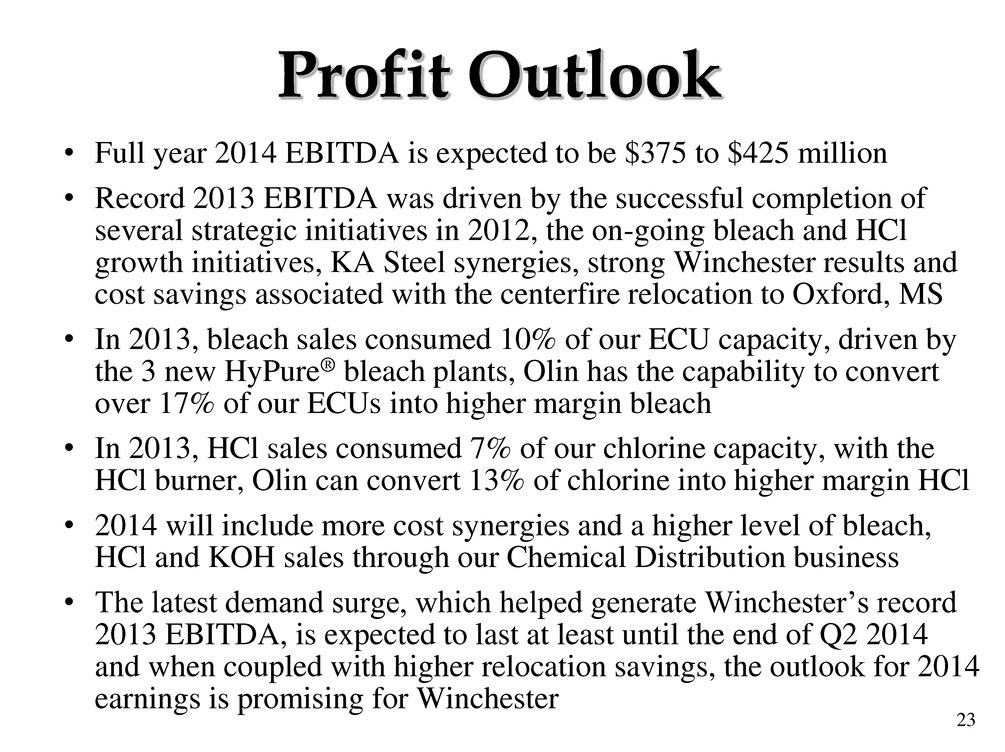
23 • Full year 2014 EBITDA is expected to be $375 to $425 million • Record 2013 EBITDA was driven by the successful completion of several strategic initiatives in 2012, the on-going bleach and HCl growth initiatives, KA Steel synergies, strong Winchester results and cost savings associated with the centerfire relocation to Oxford, MS • In 2013, bleach sales consumed 10% of our ECU capacity, driven by the 3 new HyPure® bleach plants, Olin has the capability to convert over 17% of our ECUs into higher margin bleach • In 2013, HCl sales consumed 7% of our chlorine capacity, with the HCl burner, Olin can convert 13% of chlorine into higher margin HCl • 2014 will include more cost synergies and a higher level of bleach, HCl and KOH sales through our Chemical Distribution business • The latest demand surge, which helped generate Winchester’s record 2013 EBITDA, is expected to last at least until the end of Q2 2014 and when coupled with higher relocation savings, the outlook for 2014 earnings is promising for Winchester Profit Outlook
24 Forward-Looking Statements This presentation contains estimates of future performance, which are forward-looking statements and actual results could differ materially from those anticipated in the forward-looking statements. Some of the factors that could cause actual results to differ are described in the business and outlook sections of Olin’s Form 10-K for the year ended December 31, 2012 and in Olin’s Third Quarter 2013 Form 10-Q. These reports are filed with the U.S. Securities and Exchange Commission.
