Attached files
| file | filename |
|---|---|
| 8-K - DELUXE CORPORATION 8-K 02-10-2014 - DELUXE CORP | a201402108-k.htm |

Deluxe Corporation Investor Presentation February 10, 2014 Exhibit 99.1
2 Forward Looking Statements This presentation contains forward-looking statements based upon information available to management as of the date hereof and management assumes no obligation to update or revise any such forward-looking statements. All estimates and projections are subject to risks and uncertainties that could cause actual future results to differ materially from those results estimated or projected. Additional information about various factors that could cause actual results to differ from those projected can be found in the Company’s Form 10-K for the year ended December 31, 2012. Non-GAAP financial measures discussed in this presentation are reconciled to the comparable GAAP financial measure at the end of this presentation in the appendix.

3 Lee Schram Chief Executive Officer Terry Peterson Senior Vice President, Chief Financial Officer Deluxe Investor Contacts Ed Merritt Treasurer, Vice President of Investor Relations Business Overview Strategy – Corporate & Segment Looking Ahead Summary
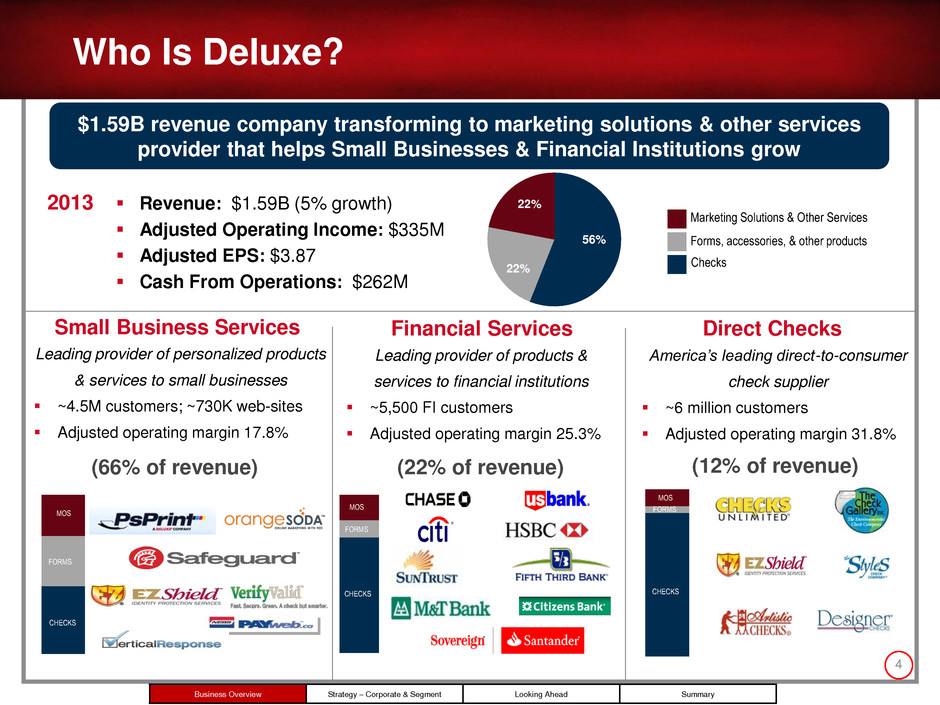
4 Who Is Deluxe? Financial Services Small Business Services Direct Checks Leading provider of products & services to financial institutions ~5,500 FI customers Adjusted operating margin 25.3% America’s leading direct-to-consumer check supplier ~6 million customers Adjusted operating margin 31.8% (22% of revenue) (12% of revenue) Marketing Solutions & Other Services Forms, accessories, & other products Checks 56% 22% 22% Revenue: $1.59B (5% growth) Adjusted Operating Income: $335M Adjusted EPS: $3.87 Cash From Operations: $262M 2013 (66% of revenue) Leading provider of personalized products & services to small businesses ~4.5M customers; ~730K web-sites Adjusted operating margin 17.8% MOS MOS FORMS CHECKS MOS FORMS CHECKS FORMS CHECKS $1.59B revenue company transforming to marketing solutions & other services provider that helps Small Businesses & Financial Institutions grow Business Overview Strategy – Corporate & Segment Looking Ahead Summary
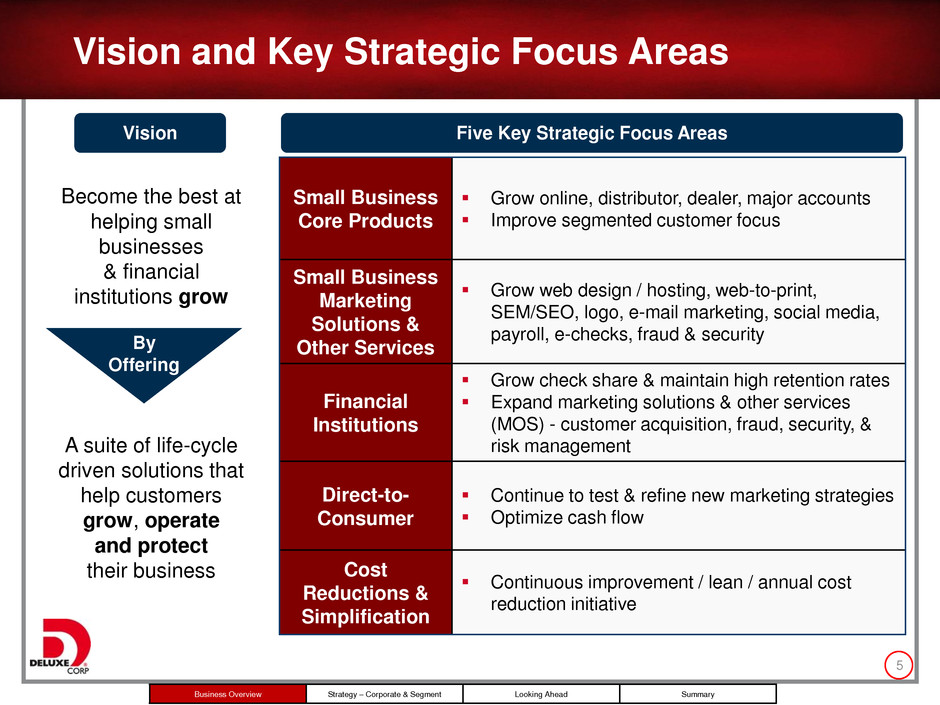
Small Business Core Products Grow online, distributor, dealer, major accounts Improve segmented customer focus Small Business Marketing Solutions & Other Services Grow web design / hosting, web-to-print, SEM/SEO, logo, e-mail marketing, social media, payroll, e-checks, fraud & security Financial Institutions Grow check share & maintain high retention rates Expand marketing solutions & other services (MOS) - customer acquisition, fraud, security, & risk management Direct-to- Consumer Continue to test & refine new marketing strategies Optimize cash flow Cost Reductions & Simplification Continuous improvement / lean / annual cost reduction initiative 5 Become the best at helping small businesses & financial institutions grow By Offering A suite of life-cycle driven solutions that help customers grow, operate and protect their business Vision and Key Strategic Focus Areas Vision Five Key Strategic Focus Areas Business Overview Strategy – Corporate & Segment Looking Ahead Summary
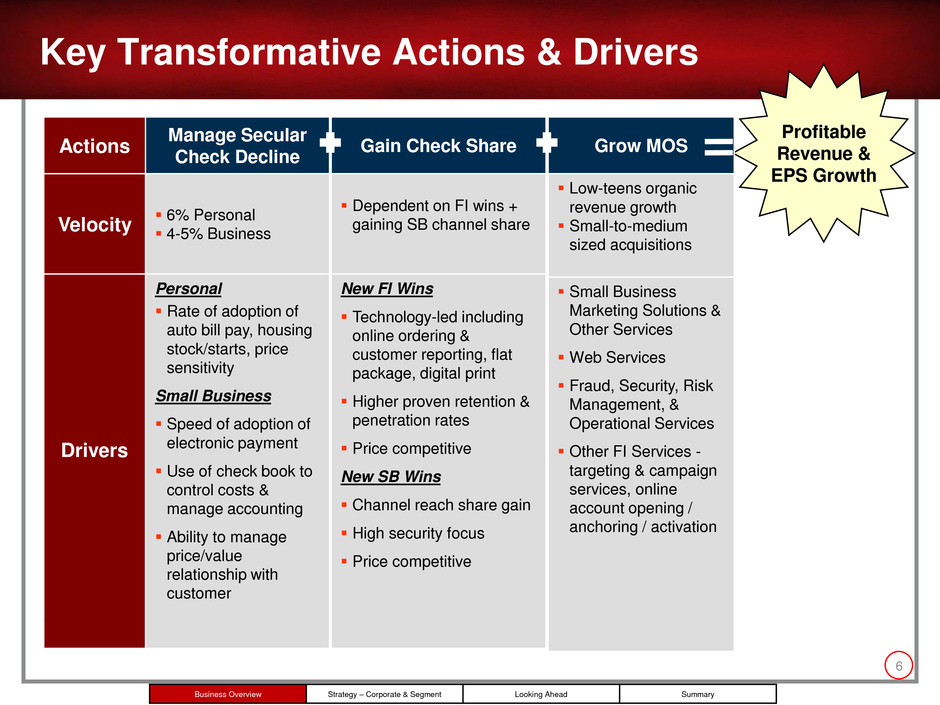
6 Key Transformative Actions & Drivers Actions Manage Secular Check Decline Velocity 6% Personal 4-5% Business Drivers Personal Rate of adoption of auto bill pay, housing stock/starts, price sensitivity Small Business Speed of adoption of electronic payment Use of check book to control costs & manage accounting Ability to manage price/value relationship with customer Business Overview Strategy – Corporate & Segment Looking Ahead Summary Profitable Revenue & EPS Growth Gain Check Share Dependent on FI wins + gaining SB channel share New FI Wins Technology-led including online ordering & customer reporting, flat package, digital print Higher proven retention & penetration rates Price competitive New SB Wins Channel reach share gain High security focus Price competitive Grow MOS Low-teens organic revenue growth Small-to-medium sized acquisitions Small Business Marketing Solutions & Other Services Web Services Fraud, Security, Risk Management, & Operational Services Other FI Services - targeting & campaign services, online account opening / anchoring / activation

7 Marketing Solutions & Other Services Revenue 7 Categories / Examples 2012 % of Total 2013 % of Total 2014 Expected % of Total & Growth Rates Key Revenue Growth Initiatives SBS Marketing − Web-to-print − Apparel − Promotional Products − Bags & Bows®, Safeguard® and Healthcare Services 41% 40% 38% Mid-Teens Growth Scale web-to-print – cross sell base + add new customers including distributors, dealers, major accounts / partners Web Services − Logo and Web Design / Hosting − SEM, SEO, Social, Email Marketing, Payroll Services 30% 32% ~32% Low-Teens Organic Growth Add wholesale telcos / major accounts Cross sell retail base (bundled presence packages); add new customers, resellers & partners Reduce web design & SEM campaign cycle times and churn rates Tuck-in acquisition focus Fraud, Security and Risk Mgmt & Operational Svcs − Consumer Protection / Security − Account Screening Services − Profitability 24% 22% ~19% Mid-Single Growth Scale Provent® to national / community FIs Fraud & security offers for small businesses & direct-to-consumers Add Banker’s Dashboard® FIs Other FI Services − Targeting & Campaign Services − Online Account Opening/Anchoring − Account Activation & Retention 5% 6% ~11% Very Strong Double-Digit Growth Add new Cornerstone SolutionsSM, Acton Marketing, SwitchAgentSM FIs Scaling Destination Rewards® 19% $285M 22% $343M ~25% | ~$400-$410M Low-Teens Organic Growth Business Overview Strategy – Corporate & Segment Looking Ahead Summary 7
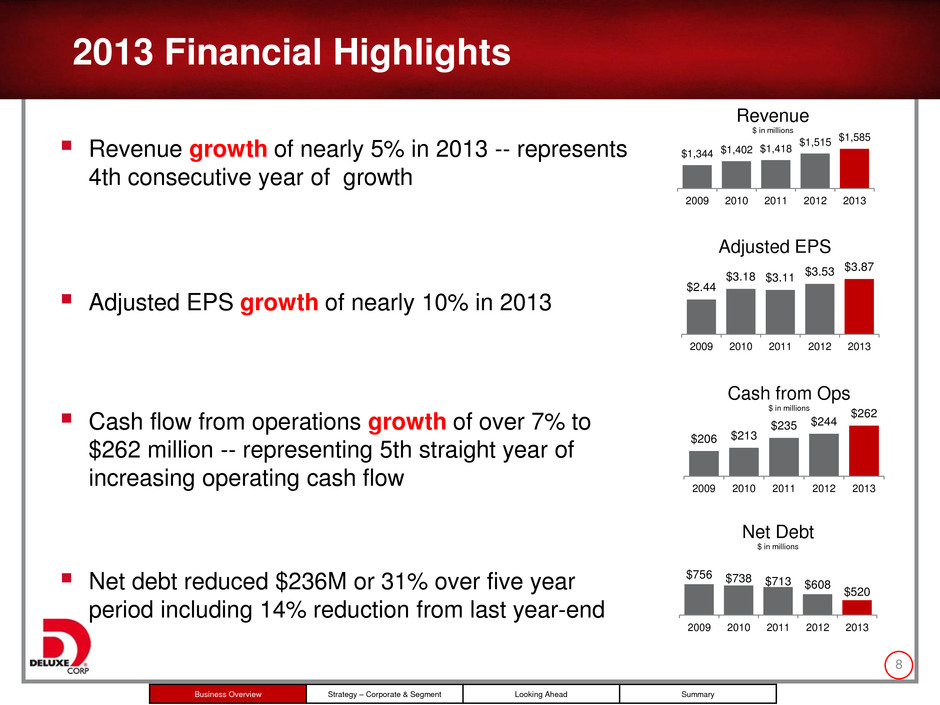
2013 Financial Highlights MOS FORMS Revenue growth of nearly 5% in 2013 -- represents 4th consecutive year of growth Adjusted EPS growth of nearly 10% in 2013 Cash flow from operations growth of over 7% to $262 million -- representing 5th straight year of increasing operating cash flow Net debt reduced $236M or 31% over five year period including 14% reduction from last year-end 8 $1,344 $1,402 $1,418 $1,515 $1,585 2009 2010 2011 2012 2013 Revenue $ in millions $206 $213 $235 $244 $262 2009 2010 2011 2012 2013 Cash from Ops $ in millions $2.44 $3.18 $3.11 $3.53 $3.87 2009 2010 2011 2012 2013 Adjusted EPS $756 $738 $713 $608 $520 2009 2010 2011 2012 2013 Net Debt $ in millions Business Overview Strategy – Corporate & Segment Looking Ahead Summary

9 Growth Driven by Diversified Product Mix Revenue by Product Type Revenue Penetration by Product Type $ in millions $854 $897 $872 $890 $885 $328 $317 $323 $339 $357 $162 $188 $223 $286 $343 0 200 400 600 800 1,000 1,200 1,400 2009 2010 2011 2012 2013 64% 64% 61% 59% 56% 24% 23% 23% 22% 22% 12% 13% 16% 19% 22% 0% 20% 40% 60% 80% 100% 2009 2010 2011 2012 2013 $1,344 $1,402 $1,418 $1,515 $1,585 SBS FS Direct 2013 Product Type by Segment Business Overview Strategy – Corporate & Segment Looking Ahead Summary MOS Forms, Accessories & Other Checks Legend
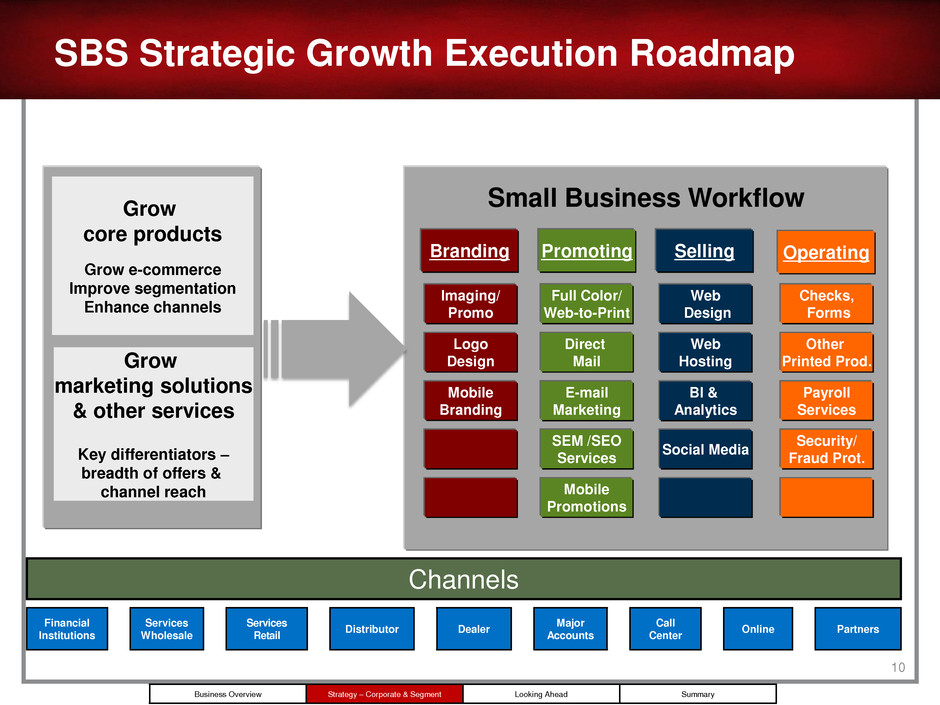
10 Social Media BI & Analytics Branding Promoting Operating Mobile Branding Logo Design Imaging/ Promo Mobile Promotions SEM /SEO Services E-mail Marketing Direct Mail Full Color/ Web-to-Print Security/ Fraud Prot. Payroll Services Other Printed Prod. Checks, Forms Web Hosting Web Design Selling Small Business Workflow Grow core products Grow e-commerce Improve segmentation Enhance channels Grow marketing solutions & other services Key differentiators – breadth of offers & channel reach SBS Strategic Growth Execution Roadmap Channels Financial Institutions Services Wholesale Services Retail Distributor Dealer Major Accounts Call Center Online Partners Business Overview Strategy – Corporate & Segment Looking Ahead Summary
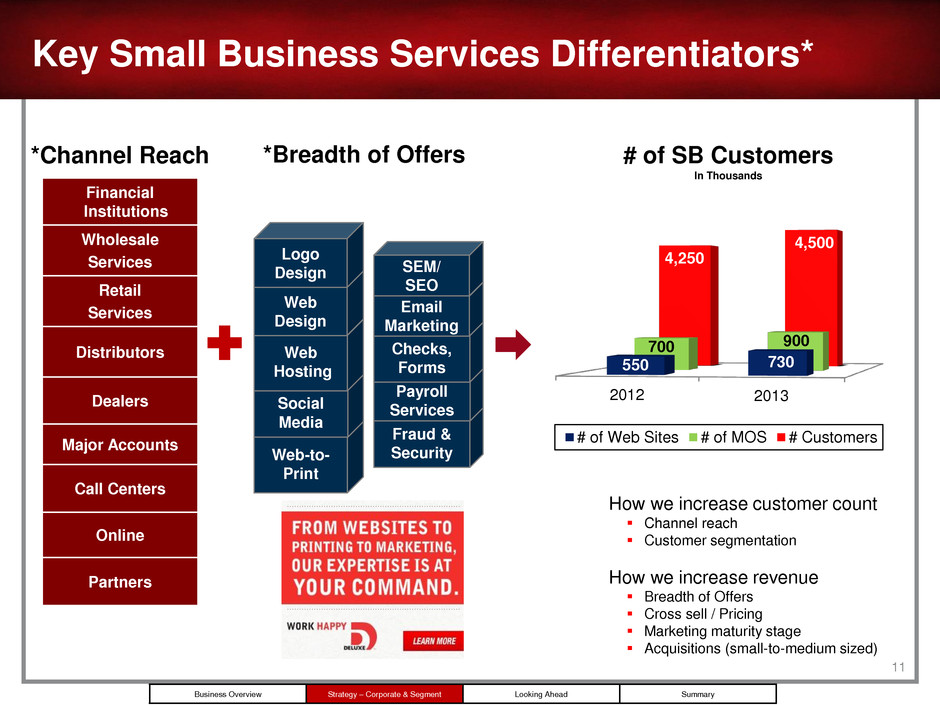
11 Key Small Business Services Differentiators* In Thousands 2012 2013 550 730 700 900 4,250 4,500 # of Web Sites # of MOS # Customers Financial Institutions Wholesale Services Retail Services Distributors Dealers Major Accounts Call Centers Online Partners Web-to- Print Social Media Web Hosting Web Design Logo Design Fraud & Security Payroll Services Checks, Forms Email Marketing SEM/ SEO How we increase customer count Channel reach Customer segmentation How we increase revenue Breadth of Offers Cross sell / Pricing Marketing maturity stage Acquisitions (small-to-medium sized) *Channel Reach *Breadth of Offers # of SB Customers Business Overview Strategy – Corporate & Segment Looking Ahead Summary
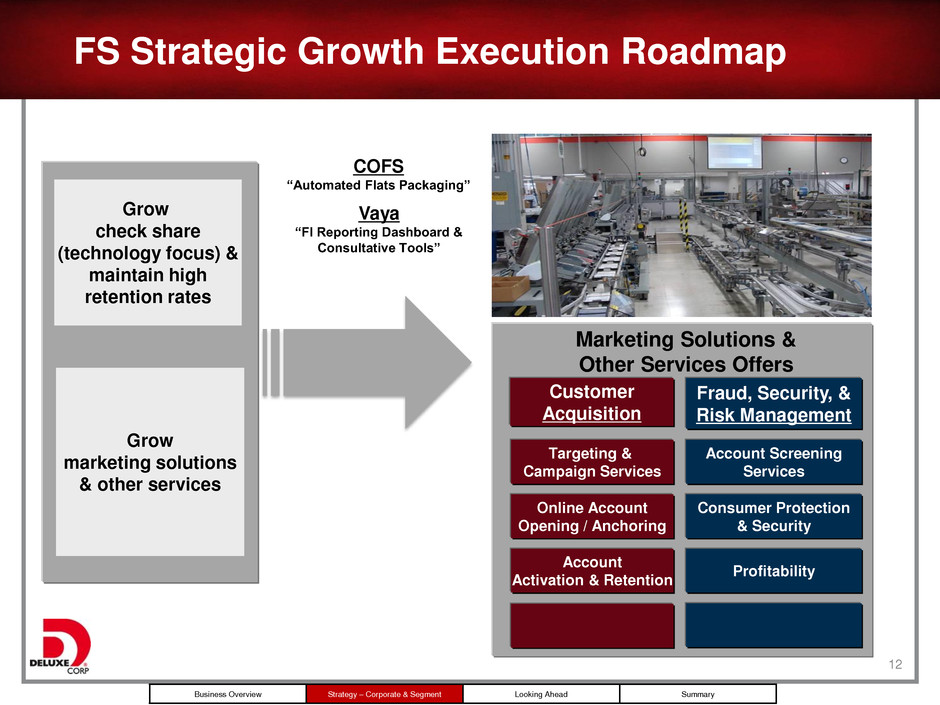
12 Grow check share (technology focus) & maintain high retention rates FS Strategic Growth Execution Roadmap Grow marketing solutions & other services Customer Acquisition Fraud, Security, & Risk Management Account Activation & Retention Online Account Opening / Anchoring Targeting & Campaign Services Profitability Consumer Protection & Security Account Screening Services Marketing Solutions & Other Services Offers COFS “Automated Flats Packaging” Vaya “FI Reporting Dashboard & Consultative Tools” Business Overview Strategy – Corporate & Segment Looking Ahead Summary
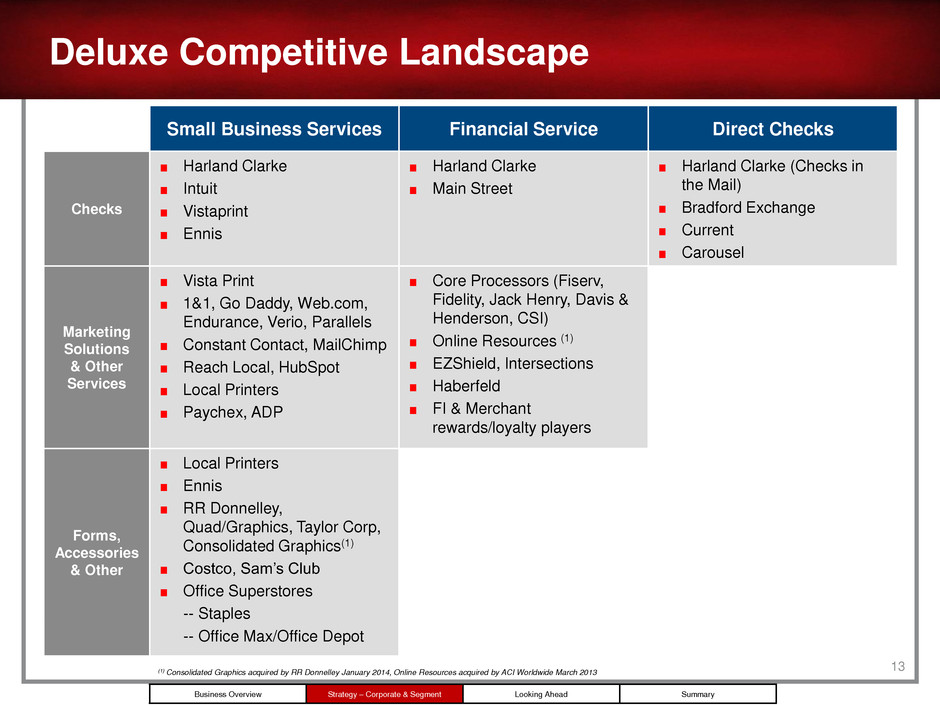
13 Deluxe Competitive Landscape Small Business Services Financial Service Direct Checks Checks Harland Clarke Intuit Vistaprint Ennis Harland Clarke Main Street Harland Clarke (Checks in the Mail) Bradford Exchange Current Carousel Marketing Solutions & Other Services Vista Print 1&1, Go Daddy, Web.com, Endurance, Verio, Parallels Constant Contact, MailChimp Reach Local, HubSpot Local Printers Paychex, ADP Core Processors (Fiserv, Fidelity, Jack Henry, Davis & Henderson, CSI) Online Resources (1) EZShield, Intersections Haberfeld FI & Merchant rewards/loyalty players Forms, Accessories & Other Local Printers Ennis RR Donnelley, Quad/Graphics, Taylor Corp, Consolidated Graphics(1) Costco, Sam’s Club Office Superstores -- Staples -- Office Max/Office Depot (1) Consolidated Graphics acquired by RR Donnelley January 2014, Online Resources acquired by ACI Worldwide March 2013 Business Overview Strategy – Corporate & Segment Looking Ahead Summary
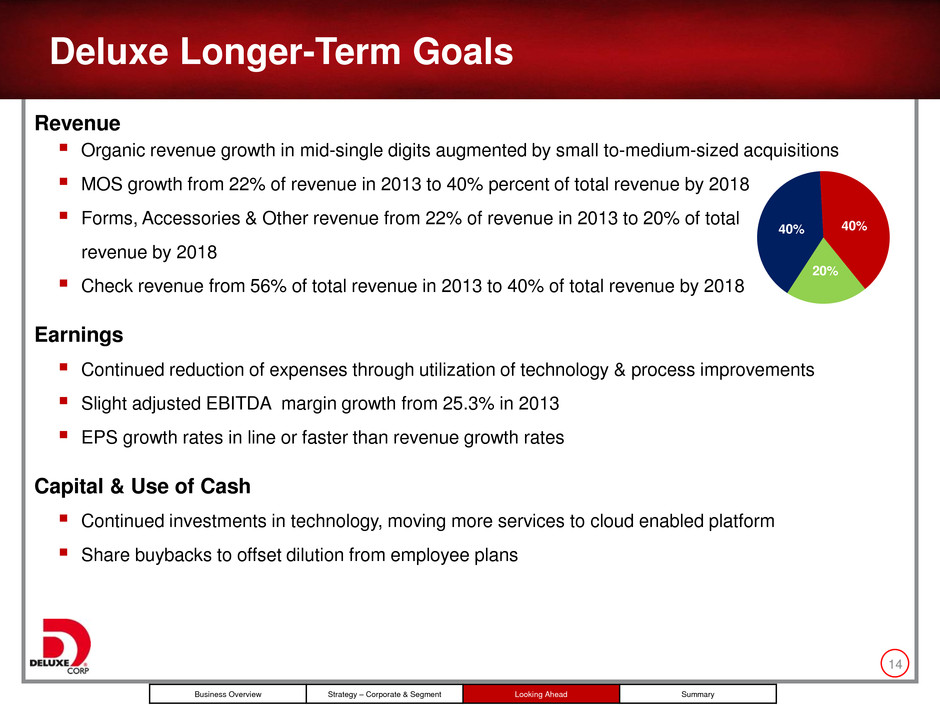
14 Revenue Organic revenue growth in mid-single digits augmented by small to-medium-sized acquisitions MOS growth from 22% of revenue in 2013 to 40% percent of total revenue by 2018 Forms, Accessories & Other revenue from 22% of revenue in 2013 to 20% of total revenue by 2018 Check revenue from 56% of total revenue in 2013 to 40% of total revenue by 2018 Earnings Continued reduction of expenses through utilization of technology & process improvements Slight adjusted EBITDA margin growth from 25.3% in 2013 EPS growth rates in line or faster than revenue growth rates Capital & Use of Cash Continued investments in technology, moving more services to cloud enabled platform Share buybacks to offset dilution from employee plans Deluxe Longer-Term Goals Business Overview Strategy – Corporate & Segment Looking Ahead Summary 40% 40% 40% 20%
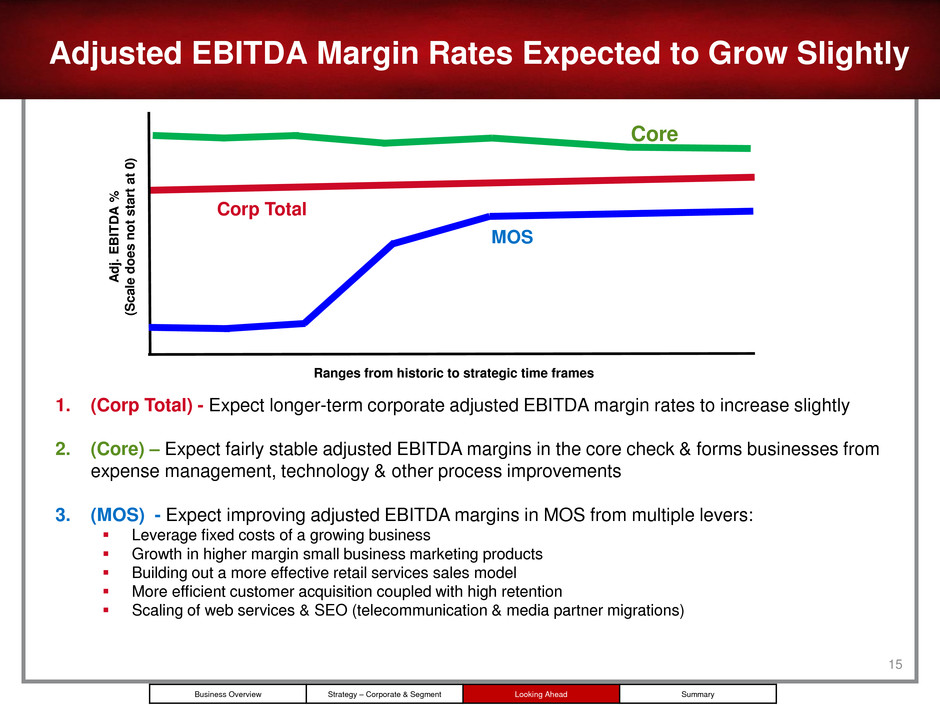
Adjusted EBITDA Margin Rates Expected to Grow Slightly 15 Core Corp Total MOS A d j. E BI T D A % (S c a le d o e s n o t sta rt at 0 ) Ranges from historic to strategic time frames 1. (Corp Total) - Expect longer-term corporate adjusted EBITDA margin rates to increase slightly 2. (Core) – Expect fairly stable adjusted EBITDA margins in the core check & forms businesses from expense management, technology & other process improvements 3. (MOS) - Expect improving adjusted EBITDA margins in MOS from multiple levers: Leverage fixed costs of a growing business Growth in higher margin small business marketing products Building out a more effective retail services sales model More efficient customer acquisition coupled with high retention Scaling of web services & SEO (telecommunication & media partner migrations) Business Overview Strategy – Corporate & Segment Looking Ahead Summary

16 Capital Structure & Priorities Strong balance sheet and cash flow provides for a flexible capital structure - continue advancing our transformation Expected use(s) of cash: ‒ Invest organically ‒ Small to medium-sized acquisitions ‒ Maintain current dividend level ‒ Repurchase shares to off-set dilution ‒ Excess cash accumulated in advance of 2014 senior note maturity $641 million of total debt outstanding as of 12/31/13 (3) $200 million revolver undrawn $121 million in cash and equivalents as of 12/31/13 Year and Amount of Debt Maturity (1) Face value of 2014 notes is $254M - carrying amount increased $1M due to changes in fair-value of hedge (2) Face value of 2020 notes is $200M - carrying amount has decreased $16M due to changes in fair-value of hedge (3) Includes approximately $1.9 million in capital leases $255M (1) $200M $200M $184M (2) `14 `15 `16 `17 `18 `19 `20 5 1/8% 7.00% 6.00% $0 drawn on revolver L+ ~2% Business Overview Strategy – Corporate & Segment Looking Ahead Summary

17 Positioning Deluxe for Long-Term Growth Management team continues to deliver improving results 2013 marks our fourth consecutive year of revenue growth with 2014 guidance for fifth year Growing MOS at double-digit rates and now 22% of revenue Existing customer base provides foundation for growth of new products and services Maintain multiple levers to drive profitability Aggressive cost management through technology and efficiencies provides funding for organic growth Expect to generate increasing cash flow Adjusted EPS expected to grow inline or faster than revenue Long history of paying dividends Transformation On-Track and Driving Growth Strong Customer Base Aggressive Cost Management Strong Cash Flow & Long History of Dividends Business Overview Strategy – Corporate & Segment Looking Ahead Summary
18 Investor Contact Ed Merritt Treasurer & Vice President of Investor Relations ed.merritt@deluxe.com Tel: 651-787-1370
19 Thank You

Appendix - Reconciliations
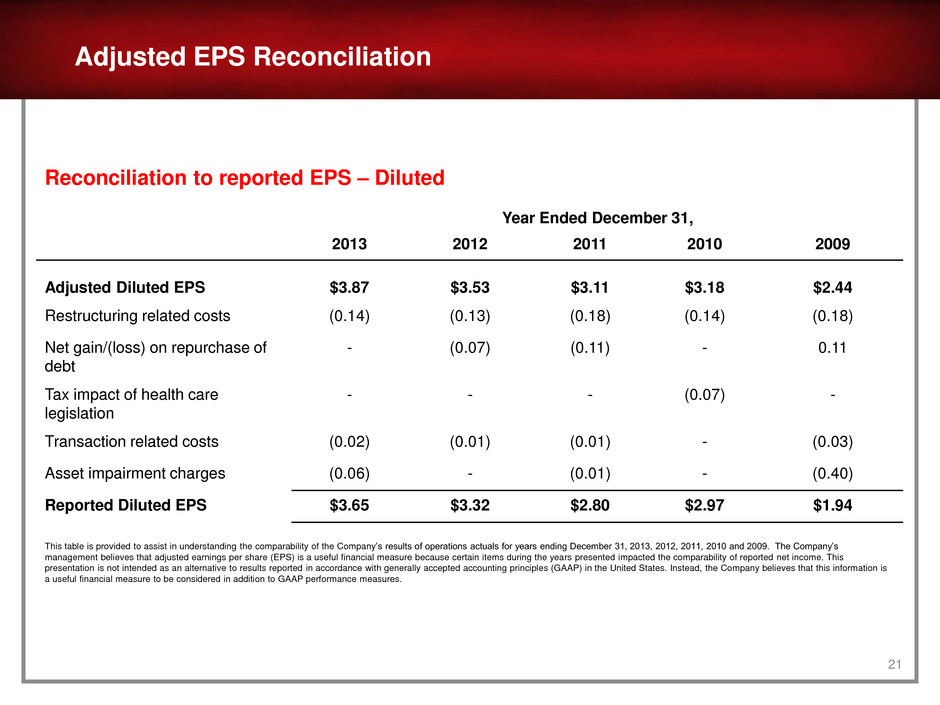
21 Reconciliation to reported EPS – Diluted Year Ended December 31, 2013 2012 2011 2010 2009 Adjusted Diluted EPS $3.87 $3.53 $3.11 $3.18 $2.44 Restructuring related costs (0.14) (0.13) (0.18) (0.14) (0.18) Net gain/(loss) on repurchase of debt - (0.07) (0.11) - 0.11 Tax impact of health care legislation - - - (0.07) - Transaction related costs (0.02) (0.01) (0.01) - (0.03) Asset impairment charges (0.06) - (0.01) - (0.40) Reported Diluted EPS $3.65 $3.32 $2.80 $2.97 $1.94 This table is provided to assist in understanding the comparability of the Company’s results of operations actuals for years ending December 31, 2013, 2012, 2011, 2010 and 2009. The Company’s management believes that adjusted earnings per share (EPS) is a useful financial measure because certain items during the years presented impacted the comparability of reported net income. This presentation is not intended as an alternative to results reported in accordance with generally accepted accounting principles (GAAP) in the United States. Instead, the Company believes that this information is a useful financial measure to be considered in addition to GAAP performance measures. Adjusted EPS Reconciliation
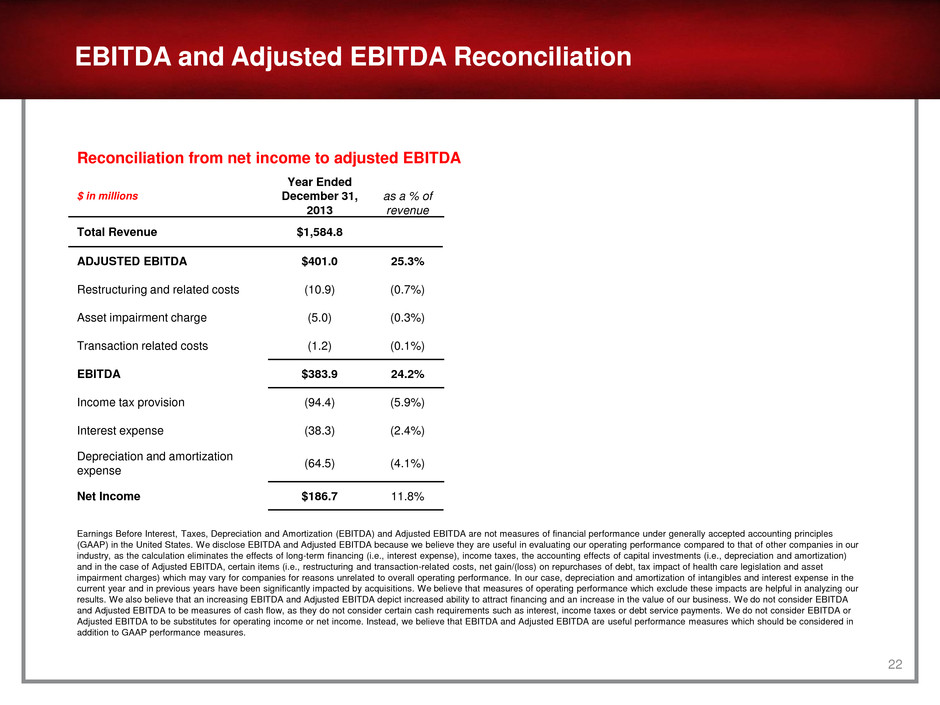
22 EBITDA and Adjusted EBITDA Reconciliation Reconciliation from net income to adjusted EBITDA $ in millions Year Ended December 31, 2013 as a % of revenue Total Revenue $1,584.8 ADJUSTED EBITDA $401.0 25.3% Restructuring and related costs (10.9) (0.7%) Asset impairment charge (5.0) (0.3%) Transaction related costs (1.2) (0.1%) EBITDA $383.9 24.2% Income tax provision (94.4) (5.9%) Interest expense (38.3) (2.4%) Depreciation and amortization expense (64.5) (4.1%) Net Income $186.7 11.8% Earnings Before Interest, Taxes, Depreciation and Amortization (EBITDA) and Adjusted EBITDA are not measures of financial performance under generally accepted accounting principles (GAAP) in the United States. We disclose EBITDA and Adjusted EBITDA because we believe they are useful in evaluating our operating performance compared to that of other companies in our industry, as the calculation eliminates the effects of long-term financing (i.e., interest expense), income taxes, the accounting effects of capital investments (i.e., depreciation and amortization) and in the case of Adjusted EBITDA, certain items (i.e., restructuring and transaction-related costs, net gain/(loss) on repurchases of debt, tax impact of health care legislation and asset impairment charges) which may vary for companies for reasons unrelated to overall operating performance. In our case, depreciation and amortization of intangibles and interest expense in the current year and in previous years have been significantly impacted by acquisitions. We believe that measures of operating performance which exclude these impacts are helpful in analyzing our results. We also believe that an increasing EBITDA and Adjusted EBITDA depict increased ability to attract financing and an increase in the value of our business. We do not consider EBITDA and Adjusted EBITDA to be measures of cash flow, as they do not consider certain cash requirements such as interest, income taxes or debt service payments. We do not consider EBITDA or Adjusted EBITDA to be substitutes for operating income or net income. Instead, we believe that EBITDA and Adjusted EBITDA are useful performance measures which should be considered in addition to GAAP performance measures.
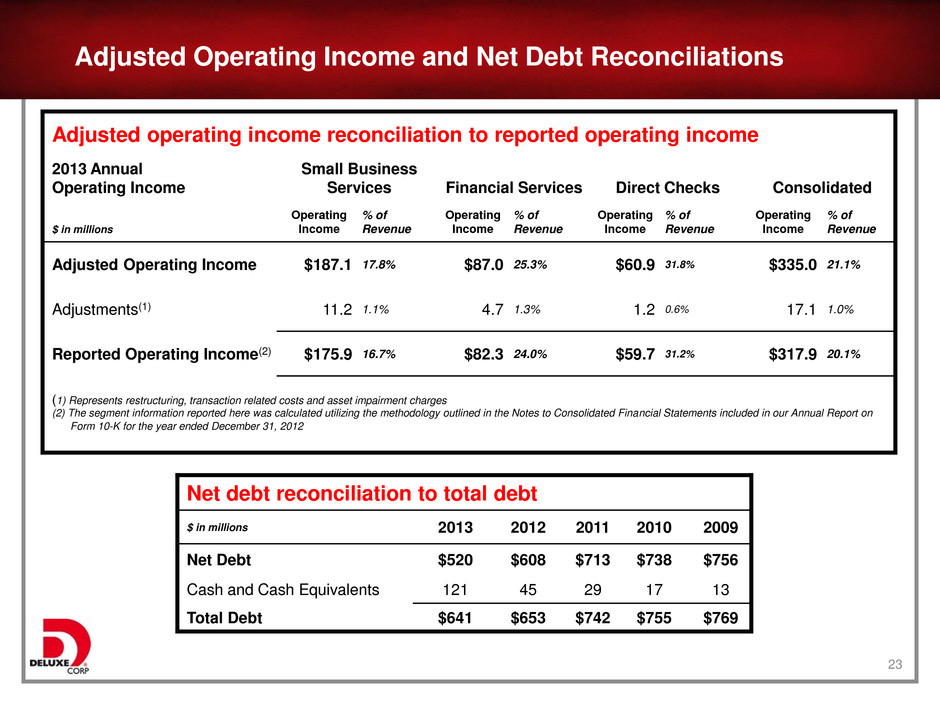
23 Adjusted Operating Income and Net Debt Reconciliations Adjusted operating income reconciliation to reported operating income 2013 Annual Operating Income Small Business Services Financial Services Direct Checks Consolidated $ in millions Operating Income % of Revenue Operating Income % of Revenue Operating Income % of Revenue Operating Income % of Revenue Adjusted Operating Income $187.1 17.8% $87.0 25.3% $60.9 31.8% $335.0 21.1% Adjustments(1) 11.2 1.1% 4.7 1.3% 1.2 0.6% 17.1 1.0% Reported Operating Income(2) $175.9 16.7% $82.3 24.0% $59.7 31.2% $317.9 20.1% (1) Represents restructuring, transaction related costs and asset impairment charges (2) The segment information reported here was calculated utilizing the methodology outlined in the Notes to Consolidated Financial Statements included in our Annual Report on Form 10-K for the year ended December 31, 2012 Net debt reconciliation to total debt $ in millions 2013 2012 2011 2010 2009 Net Debt $520 $608 $713 $738 $756 Cash and Cash Equivalents 121 45 29 17 13 Total Debt $641 $653 $742 $755 $769
