Attached files
| file | filename |
|---|---|
| EXCEL - IDEA: XBRL DOCUMENT - PRETIUM PACKAGING L L C | Financial_Report.xls |
| EX-31.2 - EXHIBIT - PRETIUM PACKAGING L L C | pretium1231201310qex312.htm |
| EX-32.1 - EXHIBIT - PRETIUM PACKAGING L L C | pretium1231201310qex321.htm |
| EX-32.2 - EXHIBIT - PRETIUM PACKAGING L L C | pretium1231201310qex322.htm |
| EX-31.1 - EXHIBIT - PRETIUM PACKAGING L L C | pretium1231201310qex311.htm |
UNITED STATES
SECURITIES AND EXCHANGE COMMISSION
Washington, D.C. 20549
_____________________________________
FORM 10-Q
(Mark One)
ý | QUARTERLY REPORT PURSUANT TO SECTION 13 OR 15(d) OF THE SECURITIES EXCHANGE ACT OF 1934 |
For the quarterly period ended December 31, 2013
o | TRANSITION REPORT PURSUANT TO SECTION 13 OR 15(d) OF THE SECURITIES EXCHANGE ACT OF 1934 |
For the transition period from to
_____________________________________
PRETIUM PACKAGING, L.L.C.
PRETIUM FINANCE, INC.
PRETIUM FINANCE, INC.
(Exact name as specified in its charter)
_____________________________________
15450 South Outer Forty Drive
Chesterfield, Missouri 63017
(314) 727-8200
(314) 727-8200
Commission File Number | Registrant | IRS Employer Identification Number | State or other jurisdiction of incorporation or organization |
333-176592 | Pretium Packaging, L.L.C. | 43-1817802 | Delaware |
333-176592-08 | Pretium Finance, Inc. | 30-0668528 | Delaware |
Securities registered under Section 12(b) of the Exchange Act: None
Securities registered under Section 12(g) of the Exchange Act: None
_____________________________________
Indicate by check mark whether the Registrant (1) has filed all reports required to be filed by Section 13 or 15 (d) of the Securities Exchange Act of 1934 during the preceding 12 months (or for such shorter period that the registrant was required to file such reports), and (2) has been subject to such filing requirements for the past 90 days.
Pretium Packaging, L.L.C | Yes ý | No ¨ |
Pretium Finance, Inc. | Yes ý | No ¨ |
Indicate by check mark whether the registrant has submitted electronically and posted on its corporate Website, if any, every Interactive Data File required to be submitted and posted pursuant to Rule 405 of Regulation S-T (§232.405 of this chapter) during the preceding 12 months (or for such shorter period that the registrant was required to submit and post such files).
Pretium Packaging, L.L.C | Yes ý | No ¨ |
Pretium Finance, Inc. | Yes ý | No ¨ |
Indicate by check mark whether the Registrant is a large accelerated filer, an accelerated filer, a non-accelerated filer or a smaller reporting company. See the definitions of “large accelerated filer,” “accelerated filer,” and smaller reporting company” in Rule 12b-2 of the Exchange Act.
Pretium Packaging, L.L.C. | Large accelerated filer | o | Accelerated Filer | o |
Non-accelerated filer | ý | Smaller reporting company | o | |
Pretium Finance, Inc. | Large accelerated filer | o | Accelerated Filer | o |
Non-accelerated filer | ý | Smaller reporting company | o | |
Indicate by check mark whether the Registrant is a shell company (as defined in Rule 12b-2 of the Exchange Act).
Pretium Packaging, L.L.C | Yes o | No ý |
Pretium Finance, Inc. | Yes o | No ý |
As of February 7, 2014:
Pretium Packaging, L.L.C. | 100% of Membership Interests owned by Pretium Intermediate Holding, LLC. |
Pretium Finance, Inc. | 100 shares of Common Stock, par value $0.01 per share outstanding. |
This Form 10-Q is a combined quarterly report being filed separately by two registrants: Pretium Packaging, L.L.C. and Pretium Finance, Inc. Pretium Finance, Inc. meets the conditions set forth in general instruction H(1)(a) and (b) of Form 10-Q and is therefore filing this form with the reduced disclosure format.
Index to Form 10-Q
Page | ||
i
Unless otherwise noted, references to the terms “the Company”, “Pretium”, “we,” “us” and “our” refer to Pretium Packaging, L.L.C. and its consolidated subsidiaries. “Pretium Finance” refers to Pretium Finance, Inc. “PVC” refers to PVC Container Corporation. “Robb” refers to Robb Container Corporation. “Pretium Intermediate” refers to Pretium Intermediate Holding, LLC. “Pretium Holding” and “our parent” refer to Pretium Holding, LLC, an entity controlled by Castle Harlan and its affiliates. “Castle Harlan” refers to Castle Harlan, Inc. The “PVC Acquisition” refers to Pretium's acquisition of PVC on February 16, 2010. The “Acquisition” refers collectively to Pretium Holding's acquisition of Pretium, the PVC Acquisition and the restructuring of Pretium's equity and debt on February 16, 2010. The "Notes" means the senior secured notes issued on March 31, 2011 in an aggregate principal amount of $150.0 million. The "ABL Facility" means our asset backed revolving credit facility.
FORWARD LOOKING STATEMENTS
This Quarterly Report on Form 10-Q contains statements which may be "forward-looking statements" within the meaning of the federal securities laws. All of the statements other than historical facts are forward-looking statements. As a general matter, forward-looking statements are those focused upon anticipated events or trends, expectations, and beliefs relating to matters that are not historical in nature. The words “could,” “anticipate,” “preliminary,” “expect,” “believe,” “estimate,” “intend,” “plan,” “will,” “foresee,” “project,” “forecast,” or the negative thereof or variations thereon, and similar expressions, identify forward-looking statements.
Although we believe that these statements are based on reasonable assumptions, they are subject to numerous risks, uncertainties and other factors that may be beyond our control. These known and unknown risks, uncertainties and other factors could cause actual results to differ materially from those matters expressed in, anticipated by or implied by such forward-looking statements.
These risks, uncertainties and other factors include, but are not limited to:
• | our substantial indebtedness and ability to incur more debt; |
• | our liquidity and capital resources; |
• | macroeconomic conditions in the United States, Canada and elsewhere; |
• | competitive pressures and trends in the plastic packaging industry; |
• | changes in the prevailing prices and availability of resin and other raw materials and our ability to pass on increases in raw material prices on a timely basis; |
• | changes in the demand for, supply of or prices of our products; |
• | changes in U.S. dollar and Canadian dollar exchange rates; |
• | our ability to successfully implement our business strategy; |
• | increases in the cost of compliance with laws and regulations; |
• | catastrophic loss or shutdown of one of our manufacturing facilities; |
• | our ability to attract and retain qualified management personnel; and |
• | increased labor costs or prolonged work stoppages at any of our facilities with unionized labor. |
The foregoing factors should not be construed as exhaustive and should be read together with important information regarding risks and factors that may affect the Company’s future performance set forth under Item 1A “Risk Factors” in the Company’s Annual Report on Form 10-K for the fiscal year ended September 30, 2013 (under "Item 1A Risk Factors").
These statements reflect the current views and assumptions of management with respect to future events. We do not undertake and specifically decline any obligation to update any such statements or to publicly announce the results of any revisions to any such statements to reflect future events or developments, except as required by law. Readers are cautioned not to place undue reliance on forward-looking statements, which speak only as of the date of this Quarterly Report on Form 10-Q. The inclusion of any statement in this Quarterly Report on Form 10-Q does not constitute an admission by the Company or any other person that the events or circumstances described in such statement are material.
ii
PART I
Item 1. | Financial Statements and Supplementary Data |
PRETIUM PACKAGING, L.L.C. AND SUBSIDIARIES
CONDENSED CONSOLIDATED BALANCE SHEETS
(in thousands)
December 31, 2013 | September 30, 2013 | ||||||
Assets | (unaudited) | ||||||
Current assets: | |||||||
Cash | $ | 2,408 | $ | 1,179 | |||
Accounts receivable, net of allowances of $691 and $611 | 23,779 | 27,537 | |||||
Inventories | 27,030 | 25,759 | |||||
Prepaid expenses and other assets | 3,341 | 4,862 | |||||
Deferred tax assets | 532 | 445 | |||||
Total current assets | 57,090 | 59,782 | |||||
Property, plant and equipment, net | 64,463 | 61,963 | |||||
Other assets: | |||||||
Goodwill | 40,309 | 40,408 | |||||
Other intangibles, net | 32,884 | 33,403 | |||||
Deferred financing fees, net | 4,295 | 4,789 | |||||
Other non current assets | 361 | 371 | |||||
Total other assets | 77,849 | 78,971 | |||||
Total assets | $ | 199,402 | $ | 200,716 | |||
Liabilities and Members' Deficit | |||||||
Current liabilities: | |||||||
Current maturities of long-term debt | $ | 638 | $ | 25 | |||
Accounts payable | 21,002 | 25,010 | |||||
Accrued expenses | 8,188 | 7,468 | |||||
Accrued interest and bank fees | 4,377 | 8,674 | |||||
Total current liabilities | 34,205 | 41,177 | |||||
Long-term liabilities: | |||||||
Long-term debt, less current maturities | 168,732 | 155,490 | |||||
Deferred tax liabilities | 8,970 | 9,166 | |||||
Other long-term liabilities | 812 | 594 | |||||
Total long-term liabilities | 178,514 | 165,250 | |||||
Members' deficit: | |||||||
Members' deficit | (13,355 | ) | (6,112 | ) | |||
Accumulated other comprehensive income | 38 | 401 | |||||
Total members' deficit | (13,317 | ) | (5,711 | ) | |||
Total liabilities and members' deficit | $ | 199,402 | $ | 200,716 | |||
See accompanying notes to condensed consolidated financial statements.
1
PRETIUM PACKAGING, L.L.C. AND SUBSIDIARIES
CONDENSED CONSOLIDATED STATEMENTS OF OPERATIONS
(in thousands)
(Unaudited)
Three Months Ended | |||||||
December 31, | |||||||
2013 | 2012 | ||||||
Net sales | $ | 57,125 | $ | 52,720 | |||
Cost of sales | 50,528 | 46,018 | |||||
Gross profit | 6,597 | 6,702 | |||||
Operating expenses: | |||||||
Selling, general and administrative expenses | 4,818 | 4,585 | |||||
Restructuring costs | 3,108 | — | |||||
Transaction-related fees and expenses | — | 895 | |||||
Loss on foreign currency exchange | 100 | 53 | |||||
Depreciation | 87 | 129 | |||||
Amortization of intangibles | 322 | 325 | |||||
Total operating expenses | 8,435 | 5,987 | |||||
Income (loss) from operations | (1,838 | ) | 715 | ||||
Other expenses: | |||||||
Interest | 4,931 | 4,909 | |||||
Loss before income tax provision | (6,769 | ) | (4,194 | ) | |||
Income tax provision | 474 | 483 | |||||
Net loss | $ | (7,243 | ) | $ | (4,677 | ) | |
See accompanying notes to condensed consolidated financial statements.
2
PRETIUM PACKAGING, L.L.C. AND SUBSIDIARIES
CONDENSED CONSOLIDATED STATEMENTS OF COMPREHENSIVE LOSS
(in thousands)
(Unaudited)
Three Months Ended | |||||||
December 31, | |||||||
2013 | 2012 | ||||||
Comprehensive Loss: | |||||||
Net loss | $ | (7,243 | ) | $ | (4,677 | ) | |
Other comprehensive loss, net of tax: | |||||||
Foreign currency translation adjustments, net | (363 | ) | (258 | ) | |||
Total Comprehensive Loss | $ | (7,606 | ) | $ | (4,935 | ) | |
See accompanying notes to condensed consolidated financial statements.
3
PRETIUM PACKAGING, L.L.C. AND SUBSIDIARIES
CONDENSED CONSOLIDATED STATEMENTS OF CASH FLOWS
(in thousands)
(Unaudited)
Three Months Ended | |||||||
December 31, | |||||||
2013 | 2012 | ||||||
Cash Flows From Operating Activities | |||||||
Net loss | $ | (7,243 | ) | $ | (4,677 | ) | |
Adjustments to reconcile net loss to net cash used in operating activities: | |||||||
Depreciation | 4,146 | 3,979 | |||||
Amortization of intangibles | 322 | 325 | |||||
Amortization of deferred financing fees | 494 | 488 | |||||
Deferred taxes | (259 | ) | (182 | ) | |||
Changes in assets and liabilities: | |||||||
Accounts receivable | 3,631 | 3,313 | |||||
Inventories | (1,379 | ) | (3,284 | ) | |||
Prepaid expenses and other assets | 1,519 | 1,367 | |||||
Accounts payable and accrued expenses | (3,140 | ) | (1,734 | ) | |||
Accrued interest and bank fees | (4,297 | ) | (4,297 | ) | |||
Other | (110 | ) | (50 | ) | |||
Net cash used in operating activities | (6,316 | ) | (4,752 | ) | |||
Cash Flows From Investing Activities | |||||||
Purchase of property, plant and equipment | (6,402 | ) | (2,900 | ) | |||
Net cash used in investing activities | (6,402 | ) | (2,900 | ) | |||
Cash Flows From Financing Activities | |||||||
Proceeds from sale-leaseback transaction | 2,925 | — | |||||
Repayments of revolving line of credit | (13,033 | ) | (15,493 | ) | |||
Proceeds from revolving line of credit | 23,988 | 23,473 | |||||
Repayments of other debt obligations | (25 | ) | (44 | ) | |||
Net cash provided by financing activities | 13,855 | 7,936 | |||||
Net increase in cash | 1,137 | 284 | |||||
Effect of foreign currency translation adjustment | 92 | (6 | ) | ||||
Cash - beginning of period | 1,179 | 913 | |||||
Cash - end of period | $ | 2,408 | $ | 1,191 | |||
Supplemental Disclosure of Cash Flow Information | |||||||
Interest paid | $ | 8,730 | $ | 8,713 | |||
Income taxes paid | $ | 32 | $ | 277 | |||
See accompanying notes to condensed consolidated financial statements.
4
PRETIUM PACKAGING, L.L.C. AND SUBSIDIARIES
NOTES TO CONDENSED CONSOLIDATED FINANCIAL STATEMENTS
(in thousands)
(Unaudited)
Note 1. | Summary of Significant Accounting Policies |
Basis of Presentation
Pretium Packaging, L.L.C. (the “Company”) was formed in 1998 (its origins date back to 1992) as a Delaware limited liability company for the purpose of acquiring and operating plastics manufacturing related businesses. The Company is a wholly owned subsidiary of Pretium Intermediate Holding, LLC (“Pretium Intermediate”), which is a wholly owned subsidiary of Pretium Holding, LLC (“Pretium Holding”).
The Company conducts its business from its corporate headquarters in Chesterfield, Missouri, with nine manufacturing plants in the United States and one in Canada (“Pretium Canada”). The Company manufactures a variety of injection blow molded (“IBM”), extrusion blow molded (“EBM”), injection stretch blow molded (“SBM”) and injection molded (“IM”) plastic bottles, jars, containers, preforms, and closures.
The accompanying condensed consolidated financial statements have been prepared in accordance with accounting principles generally accepted in the United States of America (“GAAP”) for interim financial information and with the instructions to Form 10-Q and Article 10 of Regulation S-X. Accordingly, they do not include all of the information and notes required by GAAP for complete financial statements. In the opinion of management, the condensed consolidated financial statements include all adjustments, consisting only of normal recurring adjustments, necessary for a fair presentation of such financial statements.
The unaudited interim condensed consolidated financial statements should be read in conjunction with the complete consolidated financial statements and notes thereto included in the Company’s Annual Report on Form 10-K for the fiscal year ended September 30, 2013.
Other than as specifically indicated in these “Notes to Condensed Consolidated Financial Statements” included in this Quarterly Report on Form 10-Q, the Company has not materially changed its significant accounting policies from those disclosed in its Annual Report on Form 10-K for the fiscal year ended September 30, 2013.
Recently Issued Accounting Pronouncements
In February 2013, the FASB issued ASU No. 2013-02, Comprehensive Income ("ASU 2013-02"). ASU 2013-02 requires an entity to provide information about the amounts reclassified out of accumulated other comprehensive income by component. In addition, an entity is required to present, either in the consolidated statements of operations or in the notes, significant amounts reclassified out of accumulated other comprehensive income by the respective line items of net income, but only if the amount reclassified is required to be reclassified to net income in its entirety in the same reporting period. For other amounts that are not required to be reclassified in their entirety to net income, an entity is required to cross-reference to other disclosures required that provide additional detail about those amounts. The disclosures required by ASU 2013-02 are required for public entities for annual periods beginning after December 15, 2012 and interim periods within those years. The adoption of this update did not have any effect on the consolidated financial statements and related disclosures of the Company.
In July 2013, the FASB issued ASU No. 2013-11, Income Taxes (Topic 740) — Presentation of an Unrecognized Tax Benefit When a Net Operating Loss Carryforward, a Similar Tax Loss, or a Tax Credit Carryforward Exists (“ASU 2013-11”). ASU 2013-11 requires an entity to present an unrecognized tax benefit as a reduction of a deferred tax asset for a net operating loss (NOL) carryforward, or similar tax loss or tax credit carryforward, rather than as a liability when (1) the uncertain tax position would reduce the NOL or other carryforward under the tax law of the applicable jurisdiction and (2) the entity intends to use the deferred tax asset for that purpose. ASU 2013-11 is effective prospectively for fiscal years, and interim periods within those years, beginning after December 15, 2013, with early adoption and retrospective application permitted. The Company does not currently expect the adoption of this update in fiscal 2015 to have a significant effect on its consolidated financial statements and related disclosures.
5
Note 2. | Inventories |
Inventories, stated at lower of cost or market, consisted of the following at December 31, 2013 and September 30, 2013:
December 31, 2013 | September 30, 2013 | ||||||
Finished goods | $ | 14,238 | $ | 13,699 | |||
Raw materials | 12,792 | 12,060 | |||||
Inventories | $ | 27,030 | $ | 25,759 | |||
Note 3. | Property, Plant, and Equipment, Net |
Property, plant, and equipment consist of the following:
December 31, 2013 | September 30, 2013 | |||||||
Land | $ | 2,352 | $ | 1,645 | ||||
Buildings and improvements | 24,713 | 21,538 | ||||||
Machinery and equipment | 57,474 | 60,336 | ||||||
Capitalized leases - machinery and equipment | 2,994 | — | ||||||
Molds | 30,093 | 28,674 | ||||||
Capital improvements in progress | 3,329 | 2,741 | ||||||
Property, plant and equipment, gross | 120,955 | 114,934 | ||||||
Accumulated depreciation | (56,492 | ) | (52,971 | ) | ||||
Property, plant and equipment, net | $ | 64,463 | $ | 61,963 | ||||
Depreciation expense was $4.1 million and $4.0 million during the three month periods ended December 31, 2013, and December 31, 2012, respectively. The $4.1 million of depreciation expense recognized during the three months ended December 31, 2013 included $0.2 million of accelerated depreciation related to the announced closure of the Pointe Claire, Quebec manufacturing facility discussed further in Note 8.
In November 2013, the Company exercised its option to purchase its leased manufacturing facility in Manchester, Pennsylvania for $3.6 million.
In December 2013, the Company entered into a sale-leaseback transaction pursuant to which it sold and leased back manufacturing equipment located at its facilities in Hazleton, Pennsylvania, and Hermann, Missouri under a four year lease agreement containing a bargain purchase option at the end of the lease term. The future minimum lease payments of the capital lease are $0.6 million, $0.8 million, $0.8 million, $0.8 million, and $0.2 million in fiscal years 2014, 2015, 2016, 2017 and 2018, respectively. This equipment is reflected within capitalized leases in the above table. The Company received net proceeds from the sale-leaseback transaction of $2.9 million, which resulted in a deferred gain of $0.3 million that will be offset against the future amortization of the leased assets beginning in Q2 2014.
6
Note 4. | Goodwill and Other Intangible Assets |
Goodwill
The changes in the carrying amount of goodwill for three month period ended December 31, 2013 and the year ended September 30, 2013 are presented in the table below:
December 31, 2013 | September 30, 2013 | |||||||
Beginning balance | $ | 40,408 | $ | 40,561 | ||||
Currency translation adjustment | (99 | ) | (153 | ) | ||||
Ending balance | $ | 40,309 | $ | 40,408 | ||||
Other Intangible Assets
The following table presents the gross carrying amount and accumulated amortization of other intangible assets at December 31, 2013:
Gross carrying amount | Weighted average amortization period | Accumulated Amortization | Currency Translation Adjustment | Net Book Value | ||||||||||||||
Customer relationships | $ | 25,800 | 20 years | $ | (5,028 | ) | $ | (34 | ) | $ | 20,738 | |||||||
Trademarks | 12,280 | Indefinite | (80 | ) | (54 | ) | 12,146 | |||||||||||
Total | $ | 38,080 | $ | (5,108 | ) | $ | (88 | ) | $ | 32,884 | ||||||||
The following table presents the gross carrying amount and accumulated amortization of other intangible assets at September 30, 2013:
Gross carrying amount | Weighted average amortization period | Accumulated Amortization | Currency Translation Adjustment | Net Book Value | ||||||||||||||
Customer relationships | $ | 25,800 | 20 years | $ | (4,706 | ) | $ | 73 | $ | 21,167 | ||||||||
Trademarks | 12,280 | Indefinite | (80 | ) | 36 | 12,236 | ||||||||||||
Total | $ | 38,080 | $ | (4,786 | ) | $ | 109 | $ | 33,403 | |||||||||
Customer relationships are amortized over 20 years. The accumulated amortization related to the Trademarks is related to the subsequent amortization of the PVC trademarks. The Pretium trademark is not amortized and has an indefinite useful life.
Amortization expense was $0.3 million during each of the three month periods ended December 31, 2013 and 2012.
7
Note 5. | Long-term Debt |
At December 31, 2013 and September 30, 2013, long-term debt obligations consisted of the following:
December 31, | September 30, | ||||||
2013 | 2013 | ||||||
Long-term debt: | |||||||
ABL Facility | $ | 16,445 | $ | 5,490 | |||
Senior Secured Notes | 150,000 | 150,000 | |||||
Total Senior Debt | 166,445 | 155,490 | |||||
Capital leases and other | 2,925 | 25 | |||||
Total long-term debt | 169,370 | 155,515 | |||||
Less current maturities of long-term debt | 638 | 25 | |||||
Total long-term debt, less current maturities | $ | 168,732 | $ | 155,490 | |||
Under the terms of the Company’s debt agreements, at December 31, 2013, the scheduled interest rates and maturity dates were as follows:
Interest rates | Scheduled maturity dates | ||
ABL Facility | Prime plus 0.5% * | September 30, 2015 | |
Senior Secured Notes | 11.5% | April 1, 2016 | |
* | The revolving line of credit also has interest rate options based on LIBOR plus a margin of 1.5%. At December 31, 2013, the applicable rate under the prime and LIBOR options was 3.75% and 1.66%, respectively. |
Note 6. | Pretium Capital Structure |
At December 31, 2013, the Company’s capital structure consisted of 1 share of its Class A Member units, held by Pretium Intermediate. Pretium Intermediate is 100% owned by Pretium Holding as of December 31, 2013. The membership units of Pretium Holding are designated Class A units, Class B-1 units, Class B-2 units and Class B-3 units. The Class A and B-2 units contain certain distribution and liquidation preferences, the Class B-1 units contain voting rights and the Class B-3 units are non-voting units intended for employees and directors.
Note 7. | Income Taxes |
The Company is a pass-through tax entity except with respect to certain states in which it conducts business. No provision for income taxes has been made in these condensed consolidated financial statements other than for certain subsidiaries which are Subchapter C Corporations.
The effective tax rate differs from the statutory tax rate for the Company primarily due to the Company’s pass-through entity treatment for tax purposes. Losses before income tax at the partnership level exceeded the income before income tax at the subsidiary level and the Company recorded an income tax provision of $0.5 million during each of the three month periods ended December 31, 2013 and 2012.
The Company evaluates the net realizable value of its deferred tax assets each reporting period. The Company must consider all objective evidence, both positive and negative, in evaluating the future realization of its deferred tax assets, including tax loss carry forwards. Historical information is supplemented by all currently available information about future tax years. Realization requires sufficient taxable income to use deferred tax assets. The Company records a valuation allowance for each deferred tax asset for which realization is assessed as not more likely than not. In particular, the Company’s assessment that deferred tax assets will be realized considered the estimate of future taxable income generated from various sources, including the expected recovery of operations from the Canadian subsidiary, and increased profitability due to prior cost reductions, plant restructuring, and revenue growth. If the current estimates of future taxable income are not realized, or future estimates of taxable income are
8
reduced, then the assessment regarding the realization of deferred tax assets could change and have a material impact on the statement of operations. As of December 31, 2013, the Company’s valuation allowance of $5.9 million increased $0.8 million from September 30, 2013.
At December 31, 2013 and September 30, 2013, the total balance of unrecognized tax benefits was $0.1 million.
Note 8. | Restructuring Costs |
On July 15, 2013, the Company announced the closure of its manufacturing operations located in Pointe Claire, Quebec, Canada. This decision was directly related to the Company's decision in fiscal 2010 to de-emphasize the sale of preforms as a product category and to focus on growth in its core product line of plastic bottles. The Pointe Claire site was primarily a preform manufacturing site and did not fit within the Company's current and long term market strategy.
During the three month period ended December 31, 2013, the Company recorded a restructuring charge of $3.1 million related to these initiatives. In addition, approximately $0.2 million of costs related to these initiatives were recorded in cost of sales, representing accelerated depreciation as a result of a change in the estimated useful lives of plant assets directly related to the plant closure.
The following table presents a summary of restructuring costs and other charges related to this initiative that we expect to incur in total, the cumulative amount recognized as of December 31, 2013, and the remaining costs to be recognized:
Summary of Restructuring Costs
Total | Recognized | Remaining | |||||||||
Estimated | as of | Costs to be | |||||||||
Costs | December 31, 2013 | Recognized | |||||||||
Severance pay and benefits | $ | 1,118 | $ | 1,118 | $ | — | |||||
Other exit costs | 932 | 647 | 285 | ||||||||
Leased facility costs (1) | 2,203 | 2,203 | — | ||||||||
Total restructuring costs | 4,253 | 3,968 | 285 | ||||||||
Accelerated depreciation | 2,262 | 2,262 | — | ||||||||
Inventory markdowns | 286 | 286 | — | ||||||||
Total restructuring and related costs | $ | 6,801 | $ | 6,516 | $ | 285 | |||||
(1) | This represents the present value of the future minimum lease payments of the facility operating lease as of the cease-use date, October 31, 2013, reduced by the estimated future sublease rentals. |
Of the aggregate $6.8 million of pre-tax costs, the Company expects approximately $4.3 million will be cash expenditures, of which $1.8 million was paid during the three month period ended December 31, 2013. The Company expects to incur future cash expenditures of $0.3 million related to payment of employee termination and retention benefits, and other associated exit costs, while the remaining lease payments will continue through the expiration of the lease agreement in October 2016.
A summary of the restructuring activity and related reserves for the three month period ended December 31, 2013 is as follows:
Accrued | Accrued | ||||||||||||||||||
Balance at | Cash | Other | Balance at | ||||||||||||||||
September 30, 2013 | Charges | Payments | Adjustments | December 31, 2013 | |||||||||||||||
Severance pay and benefits | $ | 678 | $ | 307 | $ | (953 | ) | $ | — | $ | 32 | ||||||||
Leased facility costs | — | 2,203 | (229 | ) | (58 | ) | 1,916 | ||||||||||||
Other exit costs | — | 598 | (598 | ) | — | — | |||||||||||||
Total | $ | 678 | $ | 3,108 | $ | (1,780 | ) | $ | (58 | ) | $ | 1,948 | |||||||
There were no such costs incurred during the three month period ended December 31, 2012.
9
Note 9. | Contingencies |
The Company is involved in various claims and legal proceedings and administrative actions arising in the ordinary course of business. In the opinion of management, the ultimate conclusion of these matters will not have a material effect on the Company's consolidated results of operations financial position, or cash flows.
Note 10. | Fair Value Measurement |
The Company's financial instruments consist primarily of cash equivalents, trade receivables, trade payables and debt instruments. The following methods and assumptions were used to estimate fair values of each class of financial instruments:
Cash and Cash Equivalents, Accounts Receivable and Accounts Payable
The fair values of these financial instruments approximate their carrying amounts due to the short term nature of these instruments.
Long-Term Debt
The Company’s Senior Secured Notes are fixed rate debt. The fair value of the $150 million Senior Secured Notes was 107% and 108% of face value at December 31, 2013 and September 30, 2013, respectively. The fair value of the Senior Secured Notes is based on market price information and is measured using the last available trade in each respective period. The fair value is not indicative of the amount that the Company would have to pay to redeem these notes since they are infrequently traded and are not callable at this value. The fair value of the Company's capital lease obligation approximates its carrying amount based on estimated borrowing rates to discount the cash flows to their present value.
Recurring Fair Value Measurements
The Company does not have any financial assets or liabilities measured at fair value on a recurring basis as of December 31, 2013.
Non-recurring Fair value Measurements
Non-financial assets and liabilities, such as goodwill and long-lived assets, are tested for impairment on the occurrence of a triggering event or in the case of goodwill and other indefinite-lived intangible assets, on at least an annual basis. The Company completed its annual impairment test of the carrying values of goodwill and indefinite-lived trademarks as of December 31, 2013 and concluded there was no impairment.
The Company does not have any other financial instruments within the scope of the fair value disclosure requirements as of December 31, 2013.
Note 11. | Related Party Transactions |
On February 17, 2010, the former majority owner of the Company, who now serves on the Company's Board of Directors, entered into a seven year consulting agreement (including a non-competition clause). The Company's cost for these services was $0.3 million during each of the three month periods ended December 31, 2013 and 2012.
The Company has entered into a management agreement to retain Castle Harlan, Inc. to provide business and organizational strategy, financial and investment management, advisory, and merchant and investment banking services to the Company. In exchange for these services, the Company pays management fees of $2.3 million, annually. The Company recorded total expense related to this agreement of $0.6 million during each of the three month periods ended December 31, 2013 and 2012.
The fees for both of these related party agreements are included within selling, general and administrative expenses in the condensed consolidated statements of operations.
10
Note 12. | Segment Information |
The Company operates as a single reportable segment based on the “management” approach. This approach designates the internal reporting used by management for making decisions and assessing performance as the source of the reportable segments. The following table provides the geographic distributions of the Company's net sales during the three month periods ended December 31, 2013 and 2012:
Net Sales | U.S. | Canada | Total | |||||||||
Quarter ended December 31, 2013 | $ | 50,591 | $ | 6,534 | $ | 57,125 | ||||||
Quarter ended December 31, 2012 | $ | 43,741 | $ | 8,979 | $ | 52,720 | ||||||
The following table provides the geographic distributions of the Company's long-lived assets as of December 31, 2013 and September 30, 2013:
Total Long-lived Assets | U.S. | Canada | Total | |||||||||
December 31, 2013 | $ | 125,663 | $ | 11,993 | $ | 137,656 | ||||||
September 30, 2013 | $ | 122,868 | $ | 12,906 | $ | 135,774 | ||||||
11
Item 2. | Management's Discussion and Analysis of Financial Condition and Results of Operations. |
The following management’s discussion and analysis of financial condition and results of operations should be read in conjunction with the Company’s Annual Report on Form 10-K for the fiscal year ended September 30, 2013, including the financial statements, accompanying notes and management’s discussion and analysis of financial condition and results of operations, and the interim condensed consolidated financial statements and accompanying notes included in this Quarterly Report on Form 10-Q.
Overview
We are one of the nation’s largest manufacturers of customized, high performance rigid plastic bottles and containers. The principal resins used in our production processes are PET and HDPE, although we use other resins based on customer requirements. We market our products largely into the food, personal care, household products, healthcare and pharmaceutical end markets. We currently operate 10 manufacturing facilities; nine in the United States and one in Canada.
Plant Closure
On July 15, 2013, we announced that we were closing our manufacturing operations located in Pointe Claire, Quebec, Canada. The Pointe Claire facility was primarily a preform manufacturing facility and did not fit within our current and long term market strategy. We have substantially completed the consolidation activities during the first quarter of fiscal 2014.
During the three months ended December 31, 2013, we recorded a restructuring charge of $3.1 million related to these initiatives. In addition, we incurred approximately $0.2 million of accelerated depreciation as a result of a change in the estimated useful lives of plant assets and $0.8 million of incremental production costs related to the shut down and closure of the Pointe Claire manufacturing facility which were recorded in cost of goods sold during the three months ended December 31, 2013.
The following table presents a summary of restructuring costs and other charges related to this initiative that we expect to incur in total, the cumulative amount recognized as of December 31, 2013, and the remaining costs to be recognized:
Summary of Restructuring and Other Costs
Total | Recognized | Remaining | |||||||||
Estimated | as of | Costs to be | |||||||||
Costs | December 31, 2013 | Recognized | |||||||||
Severance pay and benefits | $ | 1,118 | $ | 1,118 | $ | — | |||||
Leased facility costs (1) | 2,203 | 2,203 | — | ||||||||
Other exit costs | 932 | 647 | 285 | ||||||||
Total restructuring costs | 4,253 | 3,968 | 285 | ||||||||
Accelerated depreciation | 2,262 | 2,262 | — | ||||||||
Inventory markdowns | 286 | 286 | — | ||||||||
Total restructuring and related costs | 6,801 | 6,516 | 285 | ||||||||
Incremental production costs due to plant closure | 1,496 | 1,496 | — | ||||||||
Total restructuring and other costs | $ | 8,297 | $ | 8,012 | $ | 285 | |||||
(1) | This represents the present value of the future minimum lease payments of the facility operating lease as of the cease-use date, October 31, 2013, reduced by the estimated future sublease rentals. |
Of the aggregate $8.3 million of pre-tax costs, the Company expects approximately $5.7 million will be cash expenditures, of which $2.6 million was paid during the first quarter of fiscal 2014 and $0.9 million was paid during the fourth quarter of fiscal 2013. The Company expects to incur future cash expenditures of $0.3 million related to payment of employee termination and retention benefits and other associated exit costs, while the remaining lease payments will continue through the expiration of the lease agreement in October 2016.
The Company expects that the result of this plan will improve its adjusted EBITDA by greater than $2 million in fiscal 2014, beginning in its second quarter, assuming current market conditions.
12
Selected Factors Affecting Our Results
Our net sales are derived from the manufacture and sale of plastic containers to our customers. We operate manufacturing facilities which are typically located in close proximity to our customers. Our profitability is driven by several factors including, but not limited to, (i) the number of units produced, (ii) the amount of resin consumed, (iii) the efficiency of our manufacturing operations, (iv) the level of customization of our products, and (v) the product mix of the book of business in any given period. The number of units produced is driven by both packaging market trends, such as the long term trend of conversion towards plastic packaging, as well as customer specific demand.
Our product mix is reasonably stable with most products providing a similar material margin (defined as sales price minus raw material costs) and contribution margin (defined as sales price minus variable costs), though lighter weight units have lower transaction costs. The only significant exception is with regard to preforms sold. While we utilize most of the preforms we manufacture internally to produce bottles for customers, we also sell preforms to customers who then manufacture their own bottles. This enables us to utilize already established capital assets. Preforms are manufactured by the injection molding process and generally have the lowest material margin of any product we sell. Due to the low margins realized on the sale of preforms, we made a decision in 2010 to de-emphasize the sale of preforms as a product category and to focus our development, design and investment on growth in our core product line of plastic bottles.
Our raw materials consist of resins, colorants and packaging materials. Over the past several years there have been significant fluctuations in the price of resin, which is our largest component of cost of goods sold. Various factors including changes in the prices of natural gas, crude oil and other petrochemical intermediates from which resins are produced have contributed to these price fluctuations. Primary resins used in our products are PET and HDPE. Our other manufacturing costs consist of labor, utilities and facilities maintenance.
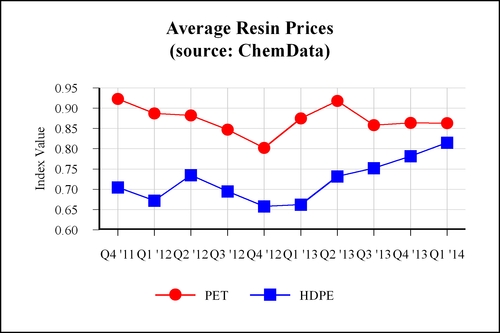
The average industry prices per pound of PET and HDPE, as published by Chemical Data as of December 31, 2013, were as follows during the fiscal periods indicated:
PET | HDPE | ||||||
FY 2014 | FY 2013 | FY 2014 | FY 2013 | ||||
October | $0.878 | $0.865 | $0.815 | $0.675 | |||
November | 0.855 | 0.880 | 0.815 | 0.655 | |||
December | 0.855 | 0.880 | 0.815 | 0.655 | |||
1st quarter average cost | $0.863 | $0.875 | $0.815 | $0.662 | |||
13
A chart of the quarterly average industry prices per pound of PET and HDPE, as published by Chemical Data as of December 31, 2013, were as follows during the fiscal periods indicated:
Our raw material costs and product unit sales prices fluctuate with changes in the prices of the resins utilized in production. When resin prices increase, our raw materials costs increase, and when resin prices decrease, our raw materials costs decline. We pass through 100% of the changes in resin costs by means of corresponding changes in product pricing, in accordance with our customer contracts and agreements with these customers and industry practice. These pass through mechanisms are typically subject to a one to four month timing delay.
As a result of this timing delay, there can be a lag between changes in market prices and when that price change is passed through to customers. For example, in periods of rising resin prices, increases in unit sales pricing lag the increases in raw material costs. Therefore the analysis of trends in our net sales and raw material costs must take this effect into consideration. We believe that material margin, which ultimately is reflected within gross profit, is a key measure of profitability, as it is reflective of our ability to pass-through resin costs. In addition, our net sales will fluctuate as we pass along changes in resin costs to customers with often limited effects to gross profit due to mechanisms to pass through increased costs, which mechanisms are typically subject to a one to four month timing delay.
Selling, general and administrative costs consist primarily of management and clerical salaries, legal, accounting and other professional fees, insurance, commissions, travel and various other costs.
We have a disciplined capital expenditures policy, investing in new projects and equipment only when we believe it will result in incremental net sales with our customers. Our maintenance capital expenditures, which we identify as the minimum capital expenditures to service current customer volumes and initiatives, are approximately $3-3.5 million annually.
Effects of Inflation
While inflationary increases in certain costs, such as freight, transportation, utilities, health insurance and wages, have had an effect on our operating results over the past three years, changes in general inflation have had a minimal effect on our operating results. Sales prices are primarily impacted by changes in resin prices which are driven by fluctuations in petrochemicals, feedstock, and in foreign currency and the general impact of supply and demand. Our costs, especially resin, can fluctuate substantially, sometimes within a relatively short period of time, and can have a significant effect on our business, financial condition and results of operations.
14
Results of Operations
Performance during the Quarter Ended December 31, 2013 (“Q1 2014”) Compared with the Quarter Ended December 31, 2012 (“Q1 2013”)
The following is a discussion of the results of operations for Q1 2014 and Q1 2013:
Net Sales
Q1 2014 | Q1 2013 | $ Change | % Change | |||||||||||
In thousands | ||||||||||||||
Net sales | $ | 57,125 | $ | 52,720 | $ | 4,405 | 8.4 | % | ||||||
Net sales were $57.1 million during Q1 2014, which represents an increase of $4.4 million, or 8.4%, as compared to $52.7 million during Q1 2013. The increase in net sales was the combination of a 1.9% increase in volume combined with a 6.5% increase in the average price per unit driven by a significant shift in mix to a higher percentage of bottles versus preforms compared to Q1 2013. We experienced an 8.0% increase in bottle sales and a 43.3% decline in sales of preforms, which we have strategically de-emphasized over the past three years culminating with the shutdown of our primary preform manufacturing facility in Pointe Claire, Quebec during Q1 2014.
Gross Profit
Q1 2014 | Q1 2013 | $ Change | % Change | |||||||||||
In thousands | ||||||||||||||
Gross profit | $ | 6,597 | $ | 6,702 | $ | (105 | ) | (1.6 | )% | |||||
Accelerated depreciation in cost of sales | 160 | — | 160 | 100.0 | % | |||||||||
Incremental production costs due to plant closure | 780 | — | 780 | 100.0 | % | |||||||||
Gross profit excluding costs associated with plant closure | $ | 7,537 | $ | 6,702 | $ | 835 | 12.5 | % | ||||||
Gross profit was $6.6 million during Q1 2014, which represents a decrease of $0.1 million compared to Q1 2013. During Q1 2014, approximately $0.9 million of costs related to the closure of our Pointe Claire, Quebec, Canada manufacturing facility were recorded in cost of sales, representing accelerated depreciation, as a result of a change in the estimated useful lives of plant assets, and incremental production costs directly related to the plant closure. Gross profit excluding the impact of the plant closure was $7.5 million during Q1 2014, which represents an increase of $0.8 million, or 12.5%, compared to Q1 2013, due primarily to the increase in net sales.
Operating Expenses
Q1 2014 | Q1 2013 | $ Change | % Change | |||||||||||
In thousands | ||||||||||||||
Selling, general and administrative expenses | $ | 4,818 | $ | 4,585 | $ | 233 | 5.1 | % | ||||||
Other operating expenses | 3,617 | 1,402 | 2,215 | 158.0 | % | |||||||||
Total operating expenses | $ | 8,435 | $ | 5,987 | $ | 2,448 | 40.9 | % | ||||||
SG&A Expenses
SG&A expenses were $4.8 million during Q1 2014, which represents an increase of $0.2 million, or 5.1%, compared to Q1 2013. The increase compared to Q1 2013 was driven by higher incentive compensation costs. The Company bonus plan is based on incentives for achieving certain annual objectives, primarily adjusted EBITDA, and the performance towards those objectives was better in Q1 2014 compared to Q1 2013. SG&A expense decreased as a percentage of net sales from 8.7% to 8.4% as we continue to effectively manage costs.
15
Other Operating Expenses
Other operating expenses during Q1 2014 were $3.6 million, which represents an increase of $2.2 million compared to Q1 2013. The increase in other operating expenses is primarily due to $3.1 million of restructuring costs incurred during Q1 2014 related to the closure of our Pointe Claire, Quebec, Canada manufacturing facility. Additionally, transaction related fees and expenses associated with our exploration of acquisition opportunities decreased $0.9 million compared to Q1 2013.
Other Expenses
Q1 2014 | Q1 2013 | $ Change | % Change | |||||||||||
In thousands | ||||||||||||||
Interest expense | $ | 4,931 | $ | 4,909 | $ | 22 | 0.4 | % | ||||||
Interest expense during Q1 2014 was $4.9 million, which increased slightly from Q1 2013 due to the increase in borrowing under the ABL Facility.
Income Tax Provision
Q1 2014 | Q1 2013 | $ Change | % Change | |||||||||||
In thousands | ||||||||||||||
Income tax provision | $ | 474 | $ | 483 | $ | (9 | ) | (1.9 | )% | |||||
As a limited liability company, we are a pass-through tax entity. No provision, except for certain states in which we conduct business, as well as certain of our subsidiaries, is made in the financial statements for income taxes. Our subsidiaries, Robb and PVC, are subject to corporate income taxes under Subchapter C of the Internal Revenue Code. We recognized an income tax provision of $0.5 million during Q1 2014 and Q1 2013, for Robb and PVC based on their pre-tax income or loss.
16
Non-GAAP Financial Measures
We have included information concerning EBITDA and Adjusted EBITDA in this quarterly report because they are the bases upon which our management assesses our operating performance and are components of certain covenants in our ABL Facility. Furthermore, we believe these measures are frequently used by securities analysts, investors and other interested parties in the evaluation of debt issuers, many of which present EBITDA and Adjusted EBITDA when reporting their results. Our presentation of EBITDA and Adjusted EBITDA should not be construed as an inference that our future results will be unaffected by other noteworthy items.
We define EBITDA as net income (loss) plus interest expense, tax expense (benefit), and depreciation and amortization, and Adjusted EBITDA as EBITDA further adjusted to eliminate the impact of certain noteworthy items that we do not consider indicative of our ongoing operating performance.
The following table presents a reconciliation of net loss to EBITDA and Adjusted EBITDA for the periods indicated below:
Three Months Ended | |||||||
Net Loss to Adjusted EBITDA Reconciliation (in thousands): | December 31, | ||||||
2013 | 2012 | ||||||
Net loss | $ | (7,243 | ) | $ | (4,677 | ) | |
Interest expense | 4,931 | 4,909 | |||||
Income tax (benefit) provision | 474 | 483 | |||||
Depreciation and amortization expense | 4,468 | 4,304 | |||||
EBITDA | 2,630 | 5,019 | |||||
Management fees (a) | 563 | 563 | |||||
Consulting fees (b) | 250 | 250 | |||||
Transaction related fees and expenses (c) | — | 895 | |||||
Restructuring (d) | 3,108 | — | |||||
Incremental production costs due to plant closure (e) | 780 | — | |||||
Carrying costs of closed facility (f) | 47 | — | |||||
Adjusted EBITDA | $ | 7,378 | $ | 6,727 | |||
(a) | In connection with the Acquisition, we entered into a management services agreement with Castle Harlan to provide business and organizational strategy, financial and investment management, advisory, and merchant and investment banking services. |
(b) | In connection with the Acquisition, we entered into a consulting agreement with Keith S. Harbison, the controlling equity holder of Pretium prior to the Acquisition, and an equity co-investor in Pretium Holding. |
(c) | Represents professional fees associated the exploration of acquisition opportunities. |
(d) | Represents restructuring costs incurred in connection with the closure of our Pointe Claire, Quebec, Canada manufacturing facility. |
(e) | As a result of winding down operations at our Pointe Claire, Quebec, Canada manufacturing facility during Q1 2014, we incurred incremental costs to manufacture our products. These costs are considered noteworthy as the plant ceased manufacturing operations during Q1 2014 and these costs will not continue to be incurred. |
(f) | Represents carrying costs associated with our closed facility in Pointe Claire, Quebec, Canada. |
17
EBITDA and Adjusted EBITDA are supplemental measures to assess our operating performance that are not required by, or presented in accordance with, GAAP. EBITDA and Adjusted EBITDA are not measures of our financial performance under GAAP and should not be considered as alternatives to net income or any other performance measures derived in accordance with GAAP or as an alternative to cash flow from operating activities as measures of our liquidity. Our measurements of EBITDA and Adjusted EBITDA and the ratios related thereto may not be comparable to similarly titled measures of other companies. Furthermore, EBITDA and Adjusted EBITDA have limitations as analytical tools and you should not consider them in isolation or as substitutes for analysis of our operating results or cash flows as reported under GAAP. Some of these limitations are:
• | EBITDA and Adjusted EBITDA do not reflect our cash expenditures, or future requirements, for capital expenditures or contractual commitments; |
• | EBITDA and Adjusted EBITDA do not reflect changes in, or cash requirements for, our working capital needs; |
• | EBITDA and Adjusted EBITDA do not reflect the significant interest expense or the cash requirements necessary to service interest or principal payments, on our debt; |
• | although depreciation and amortization are non-cash charges, the assets being depreciated or amortized may have to be replaced in the future, EBITDA and Adjusted EBITDA do not reflect any cash requirements for such replacements; |
• | EBITDA and Adjusted EBITDA are adjusted for certain noteworthy and non-cash income or expense items that are reflected in our statements of cash flows; and |
• | other companies in our industry will calculate the measures differently than we do, limiting their usefulness as comparative measures. |
Because of these limitations, EBITDA and Adjusted EBITDA should not be considered as measures of discretionary cash available to us to invest in the growth of our business. We compensate for these limitations by relying primarily on our GAAP results and using EBITDA and Adjusted EBITDA only for supplemental purposes.
We have presented a reconciliation of gross profit to gross profit excluding costs associated with plant closure, which is a non-GAAP financial measure. We consider this measure to be noteworthy as the associated costs were directly associated with the closure of our Pointe Claire, Quebec facility, and not indicative of costs to manufacture our products.
Liquidity and Capital Resources
Liquidity
Our principal ongoing source of operating liquidity is cash generated by our business operations and borrowings from our ABL Facility.
The ABL Facility provides senior secured financing of up to $30.0 million, subject to borrowing base and certain other restrictions on availability. As of December 31, 2013, there were $16.4 million of borrowings outstanding under our ABL Facility, which bears interest at variable rates and matures on September 30, 2015. At December 31, 2013, letters of credit issued and outstanding were $2.1 million and borrowing availability under the ABL Facility was $11.4 million.
We believe that cash flows from operations and borrowings from the ABL Facility will be sufficient to meet our existing liquidity needs for the next 12 months.
On March 31, 2011, the Company and Pretium Finance issued $150.0 million aggregate principal amount of the Notes. The Notes are guaranteed by all of the Company's existing and future domestic subsidiaries (other than Pretium Finance) and mature on April 1, 2016.
We were in compliance with all of the covenants contained in our Notes and ABL Facility as of December 31, 2013.
18
Cash Flows
Our cash flows from operating, investing and financing activities for the three month periods ended December 31, 2013 and 2012 are summarized in the following table:
Q1 2014 | Q1 2013 | ||||||
Net cash (used in) provided by: | |||||||
Operating activities | $ | (6,316 | ) | $ | (4,752 | ) | |
Investing activities | (6,402 | ) | (2,900 | ) | |||
Financing activities | 13,855 | 7,936 | |||||
Effect of exchange rates | 92 | (6 | ) | ||||
Net increase in cash | $ | 1,229 | $ | 278 | |||
As of December 31, 2013, we had cash and cash equivalents of $2.4 million. We consider all highly liquid investments with original maturities of three months or less to be cash equivalents. The carrying value of these investments approximates fair value.
Cash used in operating activities was $6.3 million during Q1 2014, compared to $4.8 million of cash used in operating activities during Q1 2013. The increase in cash used in operating activities was primarily due to $1.8 million of cash expenditures related to the closure of the Pointe Claire, Quebec, Canada manufacturing facility during Q1 2014. Additionally, operating assets and liabilities used $3.8 million of cash during Q1 2014 and used $4.7 million of cash during Q1 2013. The changes in operating assets and liabilities included:
• | Accounts receivable provided $3.6 million of cash during Q1 2014 and provided $3.3 million of cash during Q1 2013. This change compared to Q1 2013 is reflective of differences in the volume and timing of sales and collections within these periods. The generation of cash during both periods reflects lower sales during Q1 2014 and Q1 2013 compared to the quarters ended September 30, 2013 and 2012. |
• | Cash used in inventories was $1.4 million during Q1 2014 primarily due to increasing resin costs during the period. Inventories required $3.3 million of cash during Q1 2013, which reflects inventory build during the period due to delays in timing of expected shipments, which were impacted by several customer shutdowns as a result of hurricane Sandy in the Northeast. |
• | Prepaid expenses and other current assets provided $1.5 million of cash during Q1 2014 and provided $1.4 million of cash during Q1 2013. The cash generated during both periods was primarily due to collection of vendor rebates and a decrease in income taxes receivable and prepaid insurance. |
• | Accounts payable and accrued expenses required $3.1 million and $1.7 million of cash during Q1 2014 and Q1 2013, respectively. The increase in cash used in accounts payable and accrued expenses compared to Q1 2013 primarily reflects changes in the volume of inventory purchases and the timing of related payments to vendors at December 31. |
• | The $4.3 million of cash used for accrued interest and bank fees during Q1 2014 and Q1 2013 reflects the semi-annual interest payment made in the quarter on the Notes. |
Net cash used in investing activities was $6.4 million and $2.9 million during Q1 2014 and Q1 2013, respectively, resulting from specific cash purchases of property, plant and equipment. The increase in cash used in investing activities compared to Q1 2013, was primarily due to the purchase of our leased manufacturing facility in Manchester, Pennsylvania for $3.6 million.
Financing activities provided $13.9 million of cash during Q1 2014 and provided $7.9 million of cash during Q1 2013. The generation of cash during Q1 2014 was primarily due to net borrowings of $11.0 million under our ABL Facility to fund our operating and investing activities including the $8.6 million semi-annual interest payment on the Notes. In addition, during Q1 2014, we received $2.9 million of net proceeds from a sale-leaseback transaction, which were primarily used to finance the purchase of our leased facility in Manchester, PA. The generation of cash during Q1 2013 primarily represented borrowings under our ABL Facility to fund operating and investing activities.
19
Off Balance Sheet Arrangements
We do not have any off balance sheet arrangements as defined in Regulation S-K, Item 303(a)(4)(ii).
New Accounting Standards
Refer to "Note 1 Summary of Significant Accounting Policies” in the “Notes to Condensed Consolidated Financial Statements” included in this Quarterly Report on Form 10-Q, for a description of new accounting pronouncements, including the expected impact on the Company’s condensed consolidated financial statements and related disclosures.
Critical Accounting Policies
Management has evaluated the accounting policies used in the preparation of the Company’s condensed financial statements and related notes and believes those policies to be reasonable and appropriate. Certain of these accounting policies require the application of significant judgment by management in selecting appropriate assumptions for calculating financial estimates. By their nature, these judgments are subject to an inherent degree of uncertainty. These judgments are based on historical experience, trends in the industry, information provided by customers and information available from other outside sources, as appropriate. The most significant areas involving management judgments and estimates may be found in the Company’s Annual Report on Form 10-K for the fiscal year ended September 30, 2013, in the Critical Accounting Policies and Estimates section of Management’s Discussion and Analysis and in "Note 1 Summary of Significant Accounting Policies” in the “Notes to Consolidated Financial Statements.” There were no significant changes to the Company’s critical accounting policies during the three month period ended December 31, 2013.
20
Item 3. | Quantitative and Qualitative Disclosures about Market Risk |
We are exposed to market risk in connection with changes in foreign exchange rates and interest rates, primarily in connection with interest on the outstanding balance under our ABL Facility.
Foreign Exchange Risk
We are exposed to fluctuations in foreign currency cash flows related to our Canadian operations, intercompany product shipments and intercompany loans. Additionally, we are exposed to volatility in the translation of foreign currency earnings to U.S. dollars. Primary exposures include the U.S. dollar versus functional currencies of our major markets, which include the Canadian dollar. We assess foreign currency risk based on transactional cash flows, identify naturally offsetting positions and purchase hedging instruments to protect anticipated exposures. We do not consider the potential loss arising from a hypothetical 10% adverse change in quoted foreign currency exchange rates, as of December 31, 2013, to be material.
Interest Rate Risk
We are exposed to interest rate volatility with regard to the current existing issuances of variable rate debt under our ABL Facility. Primary exposure includes movements in the U.S. prime rate and LIBOR. We manage interest rate risk by incurring a mix of indebtedness bearing interest at both floating and fixed rates at inception and maintain an ongoing balance between floating and fixed rates on this mix of indebtedness through the use of interest rate swaps when necessary. At December 31, 2013, approximately 10%, or $16.4 million, of our debt was floating rate debt and the weighted average interest rate for all debt was 10.5%.
Item 4. | Controls and Procedures |
Evaluation of Disclosure Controls and Procedures
The Company's management carried out an evaluation (as required by Rule 13a-15(b) of the Securities Exchange Act of 1934, as amended (the “Exchange Act”)), with the participation of the Chief Executive Officer and the Chief Financial Officer, of the effectiveness of the design and operation of the Company's disclosure controls and procedures (as defined in Rule 13a-15(e) of the Exchange Act), as of the end of the period covered by this Quarterly Report on Form 10-Q. Based upon this evaluation, the Chief Executive Officer and the Chief Financial Officer concluded that the Company's disclosure controls and procedures were effective as of the end of the period covered by this Quarterly Report on Form 10-Q, such that the information relating to the Company and its consolidated subsidiaries required to be disclosed by the Company in the reports that it files or submits under the Exchange Act (i) is recorded, processed, summarized, and reported, within the time periods specified in the Securities and Exchange Commission's rules and forms, and (ii) is accumulated and communicated to the Company's management, including its principal executive and financial officers, or persons performing similar functions, as appropriate to allow timely decisions regarding required disclosure.
Changes in Controls and Procedures
In addition, the Company's management carried out an evaluation, as required by Rule 13a-15(d) of the Exchange Act, with the participation of the Chief Executive Officer and the Chief Financial Officer, of changes in the Company's internal control over financial reporting. Based on this evaluation, the Chief Executive Officer and the Chief Financial Officer concluded that there were no changes in the Company's internal control over financial reporting that occurred during the quarter ended December 31, 2013 that have materially affected, or that are reasonably likely to materially affect, the Company's internal control over financial reporting.
21
PART II
Item 1. | Legal Proceedings |
The Company is involved in various legal proceedings and administrative actions arising in the ordinary course of business. The information regarding these proceedings and actions is included under "Note 8 Contingencies” to the Company’s Condensed Consolidated Financial Statements included in this Quarterly Report on Form 10-Q.
Item 1A. | Risk Factors |
There have been no material changes to any of the risk factors disclosed in the Company’s Annual Report on Form 10-K for the fiscal year ended September 30, 2013 (under "Item 1A Risk Factors").
Item 2. | Unregistered Sales of Equity Securities and Use of Proceeds |
None.
Item 3. | Defaults upon Senior Securities |
None.
Item 4. | Mine Safety Disclosures |
None.
Item 5. | Other Information |
None.
Item 6. | Exhibits |
See the list of exhibits in the Exhibit Index to this Quarterly Report on Form 10-Q, which is incorporated herein by reference.
22
SIGNATURES
Pursuant to the requirements of Section 13 or 15(d) of the Securities Exchange Act of 1934, the registrant has duly caused this report to be signed on its behalf by the undersigned, thereunto duly authorized.
PRETIUM PACKAGING, L.L.C. | |||
Date: | February 7, 2014 | By: | /s/ George A. Abd |
George A. Abd | |||
President and Chief Executive Officer | |||
Date: | February 7, 2014 | By: | /s/ Robert A. Robison |
Robert A. Robison | |||
Vice President and Chief Financial Officer | |||
PRETIUM FINANCE, INC. | |||
Date: | February 7, 2014 | By: | /s/ George A. Abd |
George A. Abd | |||
President | |||
Date: | February 7, 2014 | By: | /s/ Robert A. Robison |
Robert A. Robison | |||
Treasurer | |||
23
EXHIBIT INDEX
Exhibit No. | Description |
31.1 * | Certification of Chief Executive Officer pursuant to Rules 13a-14 and 15d-14, as adopted pursuant to Section 302 of the Sarbanes-Oxley Act of 2002 |
31.2 * | Certification of Chief Financial Officer pursuant to Rules 13a-14 and 15d-14, as adopted pursuant to Section 302 of the Sarbanes-Oxley Act of 2002 |
32.1 * | Certification of Chief Executive Officer pursuant to 18 U.S.C. Section 1350, as adopted pursuant to Section 906 of the Sarbanes-Oxley Act of 2002 |
32.2 * | Certification of Chief Financial Officer pursuant to 18 U.S.C. Section 1350, as adopted pursuant to Section 906 of the Sarbanes-Oxley Act of 2002 |
101.INS§ | XBRL Instance Document |
101.SCH§ | XBRL Taxonomy Extension Schema Document |
101.CAL§ | XBRL Taxonomy Extension Calculation Linkbase Document |
101.DEF§ | XBRL Taxonomy Extension Definition Linkbase Document |
101.LAB§ | XBRL Taxonomy Extension Label Linkbase Document |
101.PRE§ | XBRL Taxonomy Extension Presentation Linkbase Document |
* | Filed herewith. |
§ | In accordance with Rule 406T of Regulation S-T, these exhibits are not deemed to be filed or part of a registration statement or prospectus for purposes of Sections 11 or 12 of the Securities Act of 1933, as amended, are not deemed to be filed for purposes of Section 18 of the Securities Exchange Act of 1934, as amended, and otherwise are not subject to liability under these sections. |
24