Attached files
| file | filename |
|---|---|
| 8-K - 8-K - ASSOCIATED BANC-CORP | d672406d8k.htm |
 FIRST
QUARTER 2014 ASSOCIATED BANC-CORP
INVESTOR
PRESENTATION
Exhibit 99.1 |
 FORWARD-LOOKING STATEMENTS
1
Important note regarding forward-looking statements:
Statements made in this presentation which are not purely historical are forward-looking
statements, as defined in the Private Securities Litigation Reform Act of 1995. This includes
any statements regarding management’s plans, objectives, or goals for future operations,
products or services, and forecasts of its revenues, earnings, or other measures of
performance. Such forward-looking statements may be identified by the use of words such
as “believe”, “expect”, “anticipate”, “plan”,
“estimate”, “should”, “will”, “intend”, “outlook”, or
similar expressions. Forward-looking statements are based on current management
expectations and, by their nature, are subject to risks and uncertainties. Actual results may
differ materially from those contained in the forward-looking statements. Factors which may
cause actual results to differ materially from those contained in such forward-looking
statements include those identified in the company’s most recent Form 10-K and
subsequent SEC filings. Such factors are incorporated herein by reference. |
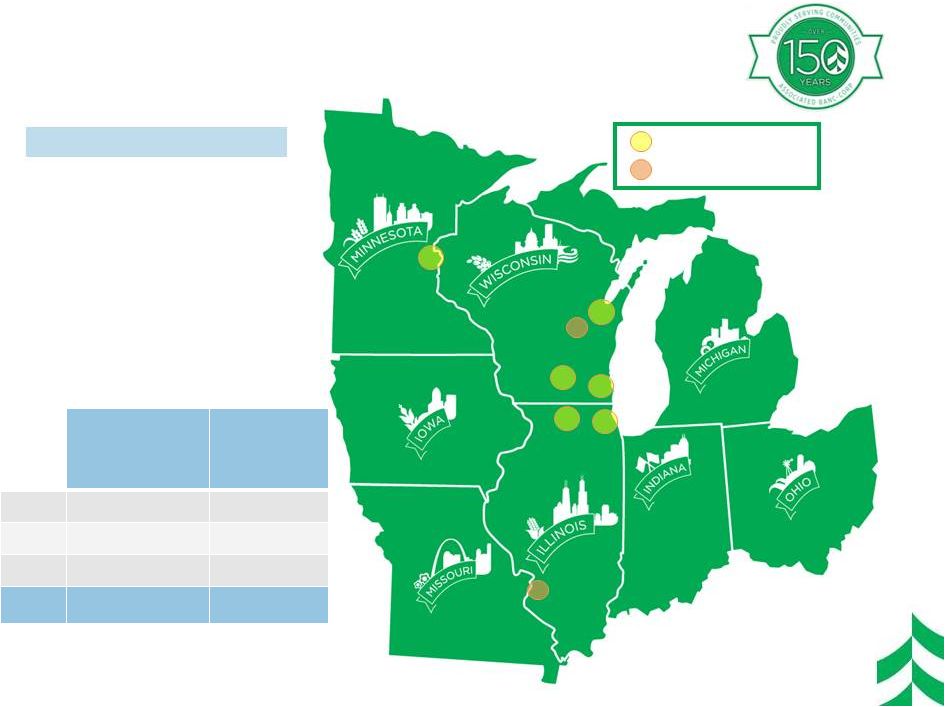 OUR
FOOTPRINT AND FRANCHISE •
Top 50, publicly traded,
U.S. bank holding
company
•
$24 billion in assets;
largest bank
headquartered in
Wisconsin
•
237 branches serving
approximately one
million customers
About Associated
ASBC
Deposits
²
($
in billions)
ASBC
Branches
²
WI
$11.6
169
IL
$4.2
45
MN
$1.5
23
Total
$17.3
237
1
FDIC market share data 6/30/13
2
As of 12/31/13 (Period End)
1861
1999
2006
1987
2011
2011
2012
>$1bn deposits
1
>$500mm deposits
1
2 |
 ATTRACTIVE MIDWEST MARKETS
3
•
Population:
Over 60 mm people live in our footprint (~ 20% of USA)
¹.
–
Favorable Credit:
Six of the top seven cities with the best consumer
credit scores are in our footprint.²
•
GDP Metrics:
$3.0 trillion in 2013 (18.4% of US GDP). 3.3% growth from
2012 is consistent with the national average.³
–
Recent Growth:
Economic growth in the Midwest was higher for
December 2013 than the growth rate of the national economy.
4
–
Manufacturing Concentrated:
Top 3 states (Indiana, Wisconsin, and
Iowa) for concentration of manufacturing jobs and two other states in the
top 10.
5
–
Manufacturing Growth:
Midwest Manufacturing output
6
has been
growing more than the national index over the last 2 years.
•
Favorable Outlook:
Chicago and Minneapolis districts reporting
manufacturing
and
construction
growth
along
with
optimism
for
2014.
7
1
US Census Bureau 2012 ;
2
Experian State of Credit Survey 2013
³
US Department of Commerce;
4
December 2013 Midwest Economy
Index; 5
March 2012 Brookings Paper ;
6
FRB Chicago Midwest Manufacturing Index, Oct 2013.Oct 2012, Oct
2011;
7
Summary of Commentary of Current
Economic
Conditions
by
Federal
Reserve
Districts
(“Beige
Book”)
–
January
2014 |
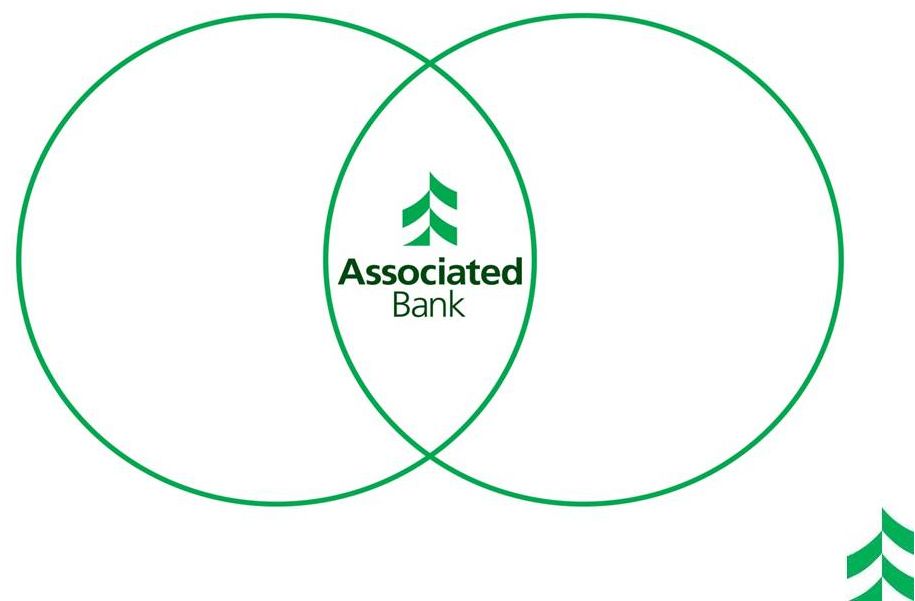 ASSOCIATED AT ITS CORE
4
Community
bank values,
flexibility,
decision-
making,
attention to
relationships
and service
Big bank
products,
strength,
lending limits,
efficiency,
innovation,
depth of
expertise |
 2013
HIGHLIGHTS AND OUTLOOK 5
•
Net income of $184 mm
•
EPS of $1.10, up 10% from 2012
•
Average loans of $15.7 bn, up 6%
compared to 2012
•
Average deposits up $1.9 bn from
2012 to $17.4 bn
•
4Q13 FTEs down 7% from 4Q12
•
T1CE
¹
ratio of 11.5%
•
Common Dividends up 43% YOY
•
Repurchased $120 mm of
common stock
2013 Highlights:
Outlook –
Growing the
Franchise & Creating Long-
Term Shareholder Value
•
Continued focus on organic
growth opportunities
•
Defending NIM compression
in low-rate environment
•
Strong focus on efficiency &
expense management
•
Disciplined focus on
deploying capital to drive
long-term shareholder value
1
Definition of Tier 1 Common Equity (T1CE) is in appendix on page 30.
|
 RESHAPING & REBUILDING THE LOAN
PORTFOLIO
1
6
1
Based on Average Annual Balances, $ in Billions
Installment
Home Equity
Residential
Mortgage &
HE 1 Liens
Construction
CRE
Investor
Commercial
& Business
Lending
$15.6
$13.2
$13.3
$14.7
$15.7
5%
6%
5%
3%
3%
9%
11%
12%
13%
12%
16%
20%
35%
8%
19%
21%
33%
4%
18%
29%
33%
4%
19%
30%
35%
7%
5%
19%
29%
37%
YTD 2009
YTD 2010
YTD 2011
YTD 2012
YTD 2013
st |
 YOY
LOAN PORTFOLIO GROWTH AVERAGE LOAN GROWTH OF $921 MILLION OR 6% FROM 2012
7
2013 YOY Average Net Loan Change
($ in millions)
+12%
% Change
+54%
(17%)
(15%)
+11%
+7%
+151%
Total
Commercial
& Business
Lending =
+13%
(+$671)
Home Equity & Installment
Commercial Real Estate
Residential Mortgage
Power & Utilities
Oil & Gas
Mortgage Warehouse
General Commercial Loans
($489)
($50)
$128
$289
$304
$355
$384 |
 GROWING
NET INTEREST INCOME WHILE MARGIN COMPRESSES
8
Yield on Interest-earning Assets
Cost of Interest-bearing Liabilities
Net Interest Income & Net Interest Margin
($ in millions)
$161
$158
$160
$161
$167
Net Interest Margin
3.70%
3.52%
3.47%
3.42%
3.50%
4Q 2012
1Q 2013
2Q 2013
3Q 2013
4Q 2013
0.51%
0.45%
0.41%
0.38%
0.35%
4Q 2012
1Q 2013
2Q 2013
3Q 2013
4Q 2013
3.32%
3.17%
3.16%
3.13%
3.23%
$160
$157
$159
$159
$163
$1
$0
$1
$1
$4
4Q 2012
1Q 2013
2Q 2013
3Q 2013
4Q 2013
Base Net Interest Income
Large Interest Recoveries
-20 bps
-16 bps |
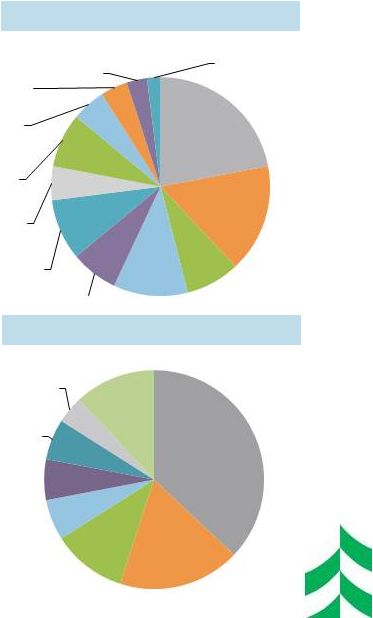 COMMERCIAL & BUSINESS LENDING
9
C&BL Loans by Industry
($6.0 billion –
Dec 2013)
•
More than 280 colleagues serving businesses,
municipal governments, and entrepreneurs:
–
Includes General Commercial and Specialized
Lending efforts
–
Offers unsecured and customized commercial
finance lending solutions secured by accounts
receivable, inventory, machinery, and
equipment
–
Capital Markets revenue of $13 million in 2013
•
Approximately 50 Commercial Deposit and
Treasury Management colleagues
–
Streamlined cash management solutions via
our Associated Connect platform for
businesses, municipalities, and correspondent
banks
•
Associated Financial Group : 240 colleagues
supporting our insurance brokerage
–
Leading benefits consultant in our markets
–
Providing Risk Management, HR, and Benefits
solutions for over 40 years
–
Revenue of $44 million in 2013
C&BL Loans by State
($6.0 billion –
Dec 2013)
1
Includes Missouri, Indiana, Ohio, Michigan, & Iowa
Manufacturing
22%
Other
16%
Finance &
Insurance
8%
Wholesale
11%
Real Estate 7%
Power &
Utilities 9%
Retail Trade
5%
Oil & Gas
8%
Health Care
Assist.
5%
Profsnl,
Scientific, and
Tech Svs
Rental and
Leasing Svs
3%
Transport. and
Whsing
2%
Trade
and Soc.
4%
Wisconsin
37%
Illinois
18%
Minnesota
11%
In
Footprint
6%
New York
6%
Texas
6%
North
Carolina
4%
Other
12%
-
1 |
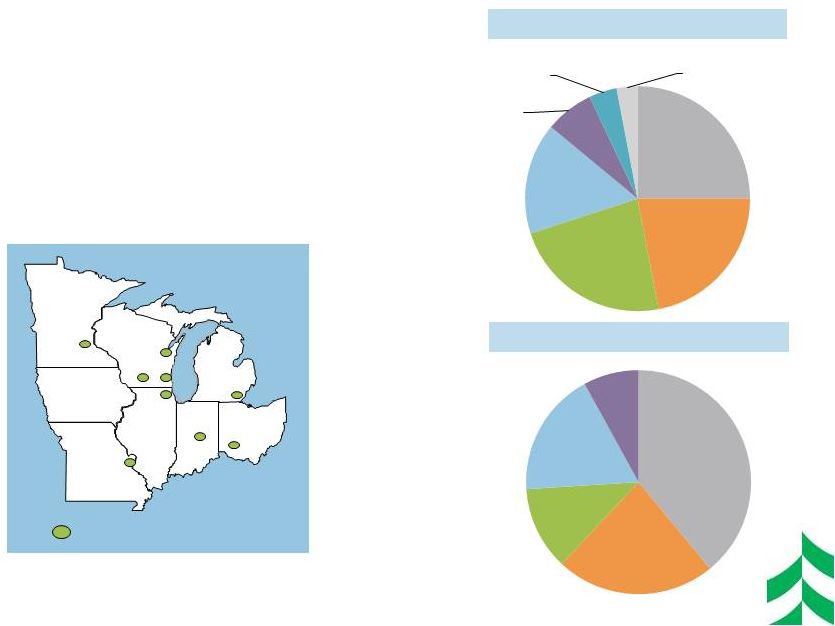 COMMERCIAL REAL ESTATE LENDING
10
CRE Loans by Industry
($3.8 billion –
Dec 2013)
•
More than 90 CRE colleagues:
–
Offices in Chicago, Cincinnati, Columbus,
Detroit, Green Bay, Madison, Milwaukee,
Minneapolis, and St. Louis
•
Recognized as:
–
#1 in US Syndicated CRE facilities under
$50MM transaction size
1
–
#13 in US Syndicated CRE facilities Overall
1
1
Thomson Reuters LPC-January, 2014
2
Includes Missouri, Indiana, Ohio, Michigan, & Iowa
CRE Loans by State
($3.8 billion –
Dec 2013)
Current CRE offices
Multi-Family
25%
Office /
Mixed Use
22%
Construction
23%
Retail
16%
Industrial
7%
Other
4%
Hotel / Motel
3%
Wisconsin
39%
Illinois
23%
Minnesota
12%
In
Footprint
2
18%
Other
8% |
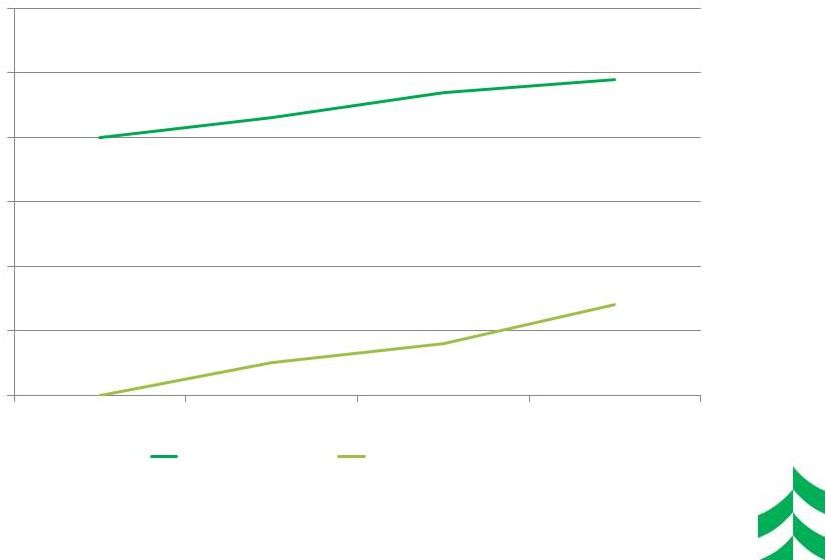
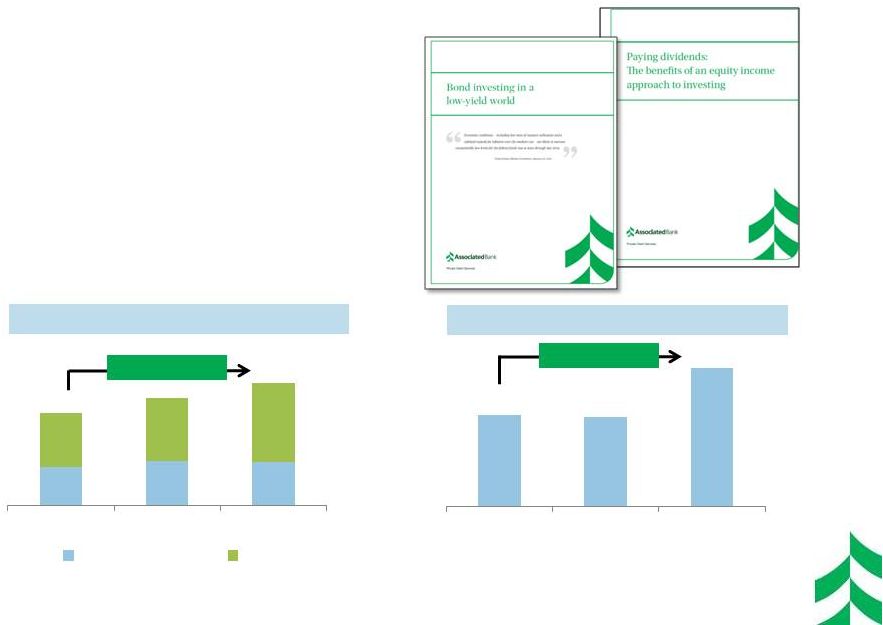 PRIVATE
CLIENT & INSTITUTIONAL SERVICES 11
•
Over 160 colleagues:
–
Private banking, personal trust, and
portfolio management services for
individuals ($500k to $10 million in
investible assets)
–
Corporate trust, asset management
and retirement plan services
–
$19.5 billion of AUM and AUA
Assets Under Management ($ in billions)
Assets Under Administration ($ in billions)
$5.6
$6.5
$7.4
CAGR = 14%
CAGR = 21%
(Thought Papers)
$2.3
$2.7
$2.6
$3.3
$3.8
$4.8
Dec 2011
Dec 2012
Dec 2013
Fixed and Cash
Equity
$8.0
$7.8
$12.1
Dec 2011
Dec 2012
Dec 2013 |
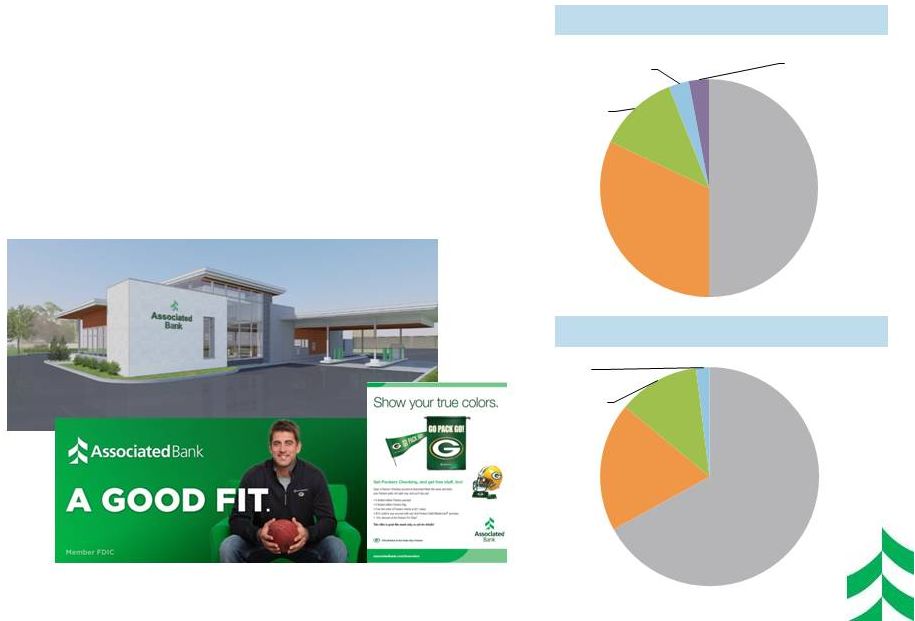 RETAIL
BANKING 12
•
Over 2,000 colleagues servicing individuals and
small business owners through five business units:
–
Consumer Banking, Business Banking,
Residential Lending, Retail Payments, and
Retail Brokerage
•
#1 mortgage originator in Wisconsin (in units)
•
A leading SBA lender in our markets
•
Official bank of the Green Bay Packers
Beloit, Wisconsin (2013)
Residential Mortgage Loans by State
($3.8
billion
–
Dec
2013)
1
Includes Missouri, Indiana, Ohio, Michigan, & Iowa
2
Approximately 40% is in first-lien position
Home
Equity
Loans
2
by
State
($1.8
billion
–
Dec
2013)
Wisconsin
50%
Illinois
32%
Minnesota
12%
In-Footprint
1
3%
Other
3%
Wisconsin
67%
Illinois
19%
Minnesota
12%
Other
2% |
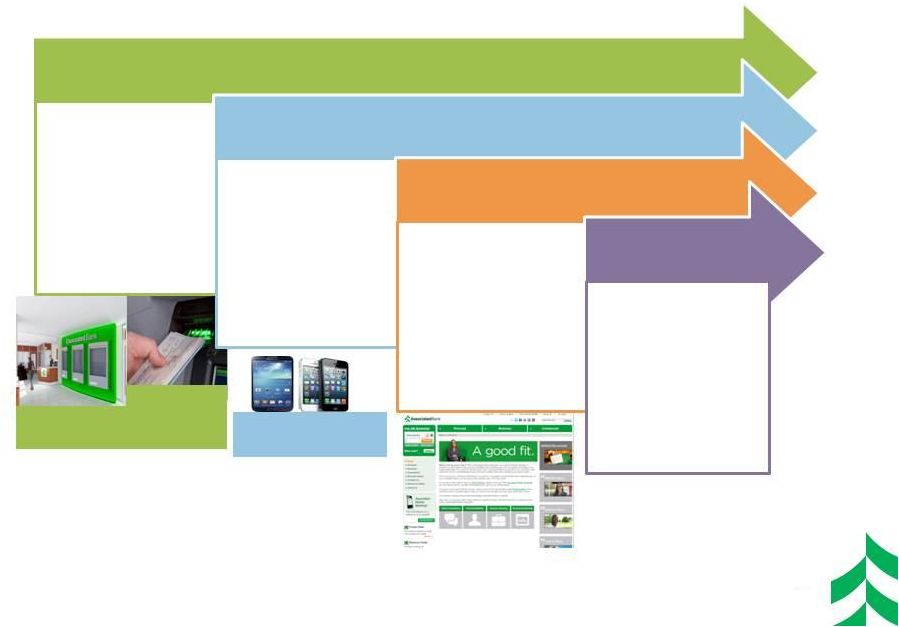 UPDATING OUR MODEL
13
1
Named Top 10 Mobile Banking App in August 2013 (The Financial Brand)
Deposit
Automation
ATM
Deploying Lower Cost Branch Concepts
Deposit
Automation
ATM
Transaction
Express
Financial
Outlets
Enhancing Virtual Banking
Online &
Mobile
Banking
1
Remote
Deposit
Person-to-
Person
Delivering Via Digital Channels
Digital
Shopping
Digital Sales
Digital Service
Selling Person
to Person
Inbound Sales
Outbound
Sales
Service to
Sales
Financial
Outlet
Mobile Banking &
Remote Deposit
Strategic Channel Evolution
•
•
•
•
•
•
•
•
•
•
•
• |
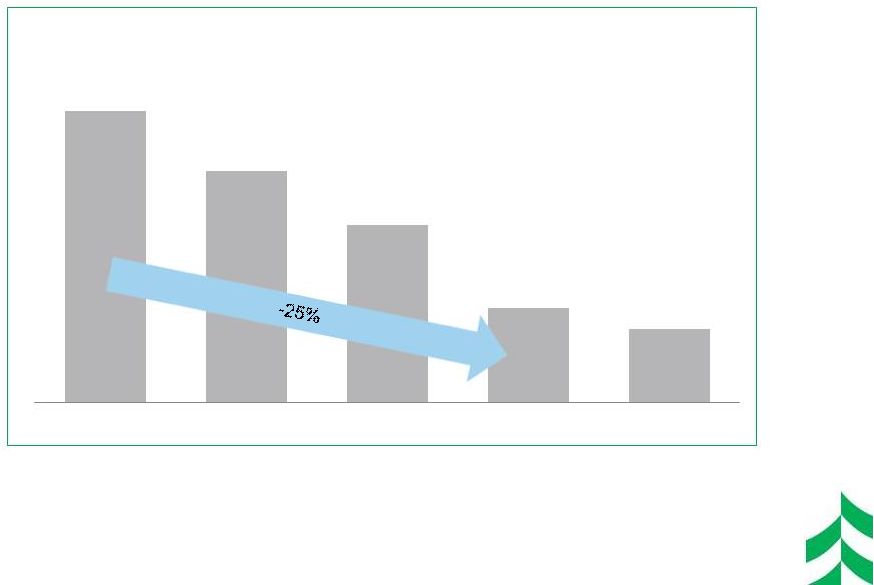 RATIONALIZING THE FOOTPRINT
14
*
< 230
* Projection based on eight branches closing 1Q 2014.
Consolidated or sold 25% of branches since 2007.
315
291
270
237
2Q 2007
2Q 2009
2Q 2011
4Q 2013
2Q 2014 |
 CHANGING CUSTOMER PREFERENCES
(PERCENTAGE OF TOTAL BANK DEPOSIT CUSTOMER BASE)
15
40%
43%
47%
49%
0%
5%
8%
14%
0%
10%
20%
30%
40%
50%
60%
2010
2011
2012
2013
Active On-line
Mobile Banking |
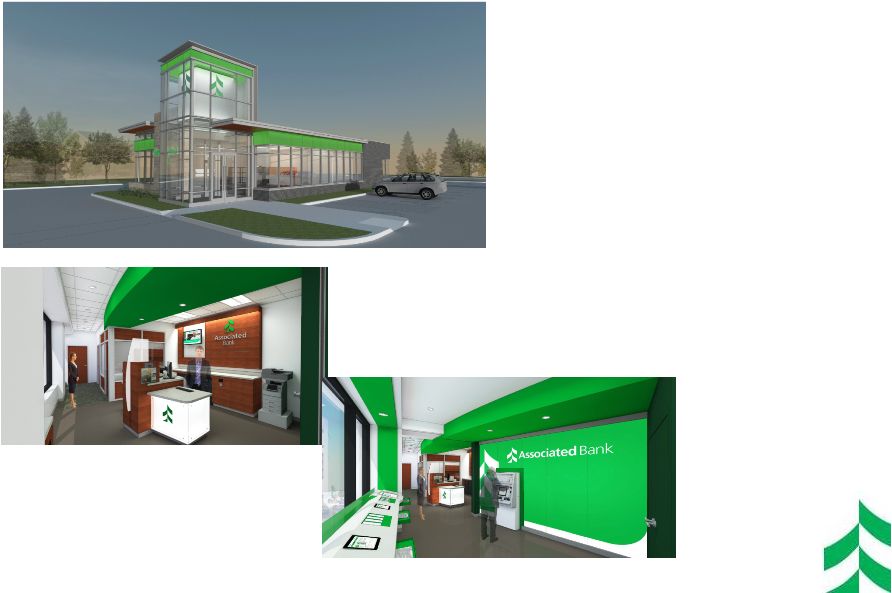 BRANCH
EVOLUTION 16
•
West Bend, Wisconsin
•
Being built in 2014
•
Lower construction costs,
higher visibility profile
•
Express Branch (Madison)
•
Demonstration Kiosk –
“Hands On”
experience
•
Automated Teller Machine |
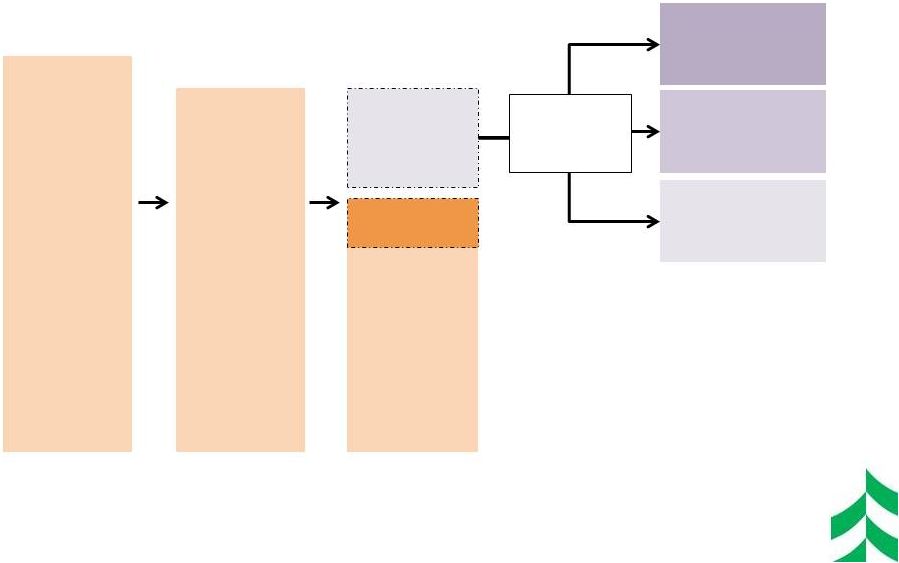
 PURSUING EFFICIENCY GAINS
17
Back Office Initiatives:
Implementing
technology solutions
in labor intensive
processes
Real Estate Initiatives:
Actions to optimize
our real estate
holdings and capacity
Distribution Model
Initiatives:
Optimize the ways
that we interact with
our customers
New commercial loan
system with end to
end processing
Outsourcing testing
and development
Right-sizing
mortgage processing
Consolidation of
corporate offices in
Green Bay and
Chicago
Consolidation of
certain operations in
Green Bay and
Stevens Point
Footprint
improvements
Channel
development and
optimization
Areas of Focus
•
•
•
•
Examples
Examples
Examples
•
•
•
•
•
• |
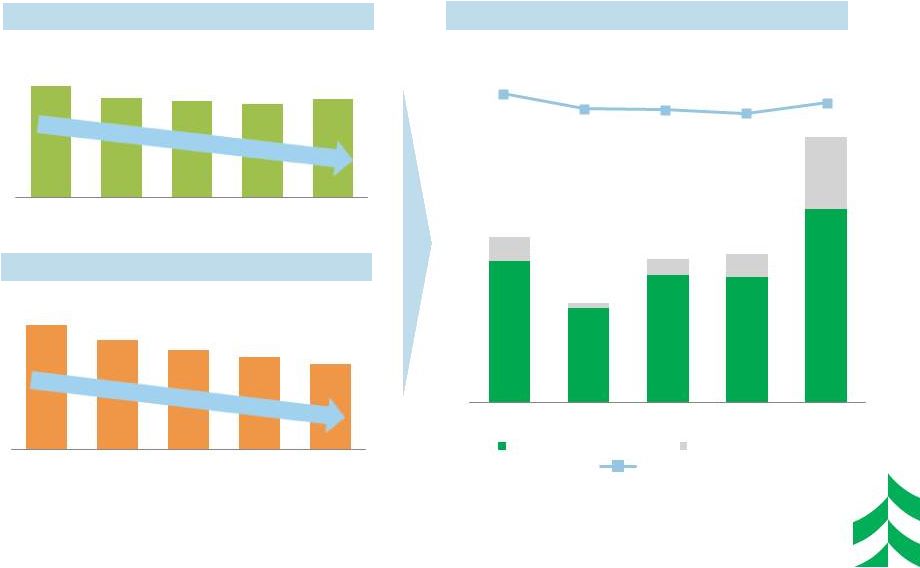
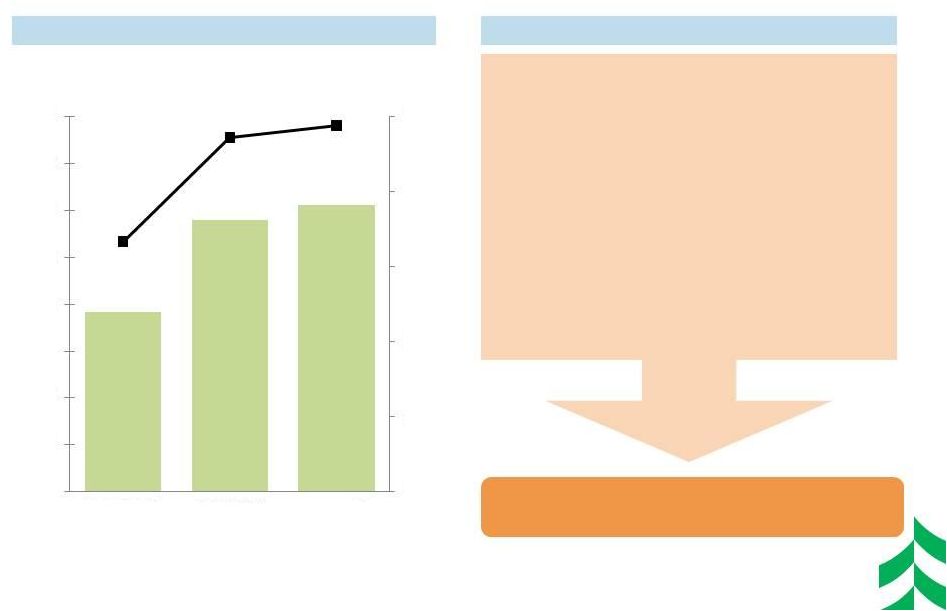
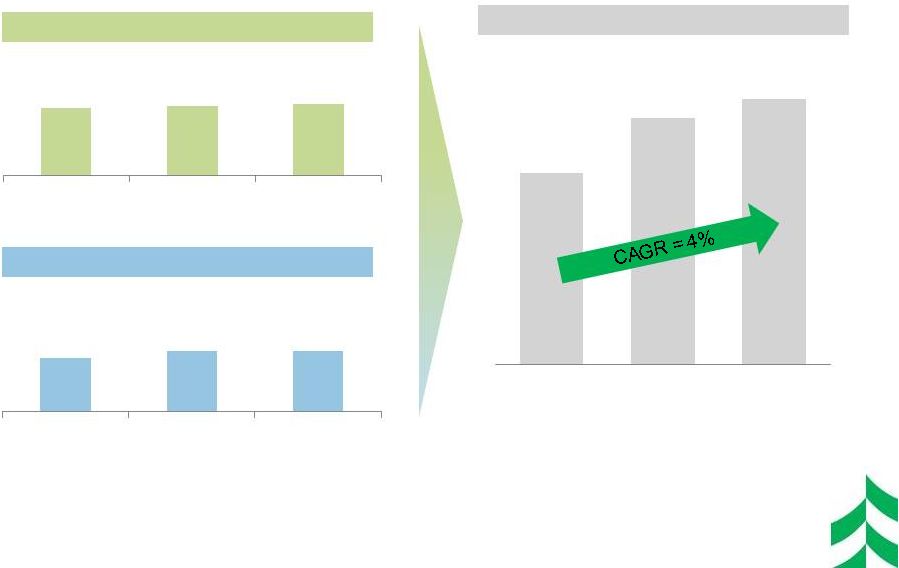 EFFICIENCY THROUGH GROWING REVENUES
$ IN MILLIONS
18
Noninterest Income Trend
Net Interest Income Trend
Net Revenue Trend
$886
$939
$959
2011
2012
2013
$613
$626
$646
2011
2012
2013
$273
$313
$313
2011
2012
2013 |
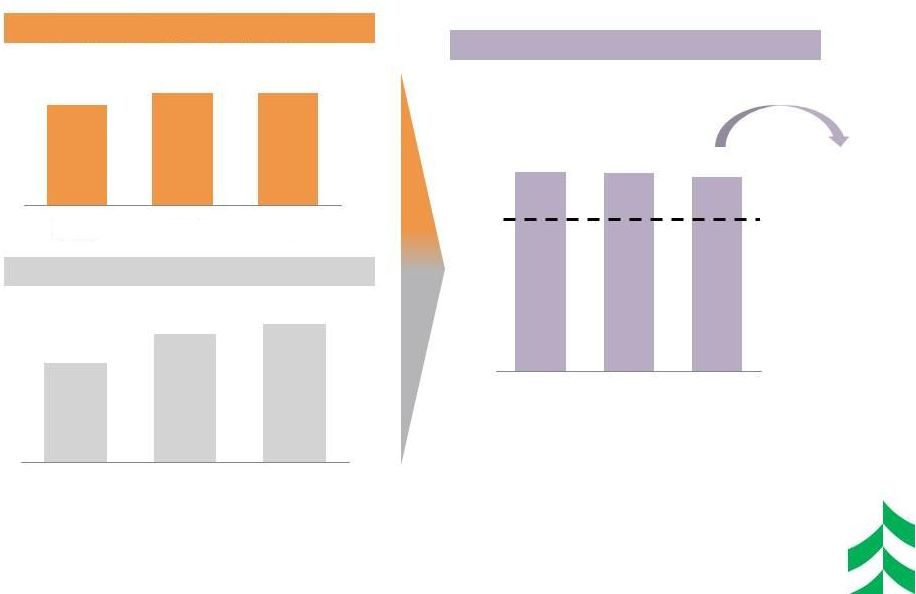
 EFFICIENCY THROUGH EXPENSE MANAGEMENT
$ IN MILLIONS
19
1
–
Other
Non-Personnel
Spend
=
Total
Noninterest
Expense
less
Personnel
and
Technology
spend
2
–
Technology
Spend
=
Data
Processing
and
Equipment
expenses
3
–
FTE
=
Average
Full
Time
Equivalent
Employees
–
At
each
fourth
quarter
for
2011,
2012,
&
2013
Other
Non-Personnel
1
Spend
Trend
Total Noninterest Expense Trend
Technology
2
Trend
Personnel
Spend
/
FTE
3
Trend
$238
$233
$209
2011
2012
2013
$52
$67
$75
2011
2012
2013
$360
$381
$397
5,056
4,915
4,584
2011
2012
2013
Personnel Spend
FTE
$651
$682
$681
2011
2012
2013 |
 COMMITTED TO EFFICIENCY IMPROVEMENTS
$ IN MILLIONS
20
%
%
%
1
–
Efficiency ratio
=
Noninterest
expense,
excluding
amortization
of
intangibles,
divided
by
sum
of
taxable
equivalent
net
interest income plus noninterest income, excluding investment securities gains,
net, and asset gains, net. This is a non-GAAP financial measure.
Please refer to the appendix for a reconciliation of this and other non-GAAP items.
2
–
Peer Average
=
based
on
ASBC’s
peer
group
and
sourced
from
SNL.
64.5%
Peer Average
2
Opportunity
$651
$682
$681
2011
2012
2013
$886
$939
$959
2011
2012
2013
70.2
70.0
69.6
2011
2012
2013
Efficiency Ratio
1
Trend
Net Revenue Trend
Total Noninterest Expense Trend |
 CAPITAL MANAGEMENT PRIORITIES
21
Funding
Organic Growth
Paying a
Competitive
Dividend
Non-organic
Growth
Opportunities
Share Buybacks
and
Redemptions
2012
•
Fund Loan Growth and other Capital Investments
•
Repurchased $60
mm of Common
Stock
•
Redeemed $205
mm in Trust
Preferred
•
Repurchased
$120 mm of
Common Stock
•
Retired $26 mm
in Sub-Debt
•
Increased
quarterly dividend
in Q4 2012
•
Paid $0.23/
common share
•
Increased
quarterly dividend
in Q4 2013
•
Paid $0.33/
common share
•
Focused on Cost Take-out Driven Depository M&A
•
Maintaining Discipline in Pricing of any Transaction
•
Repurchased $30
mm of Common
Stock in Q1 2014
•
Retiring $155 mm
in Senior Notes in
Q1 2014
•
Declared quarterly
common dividend
of $0.09/ share in
Q1 2014
2013
2014 |
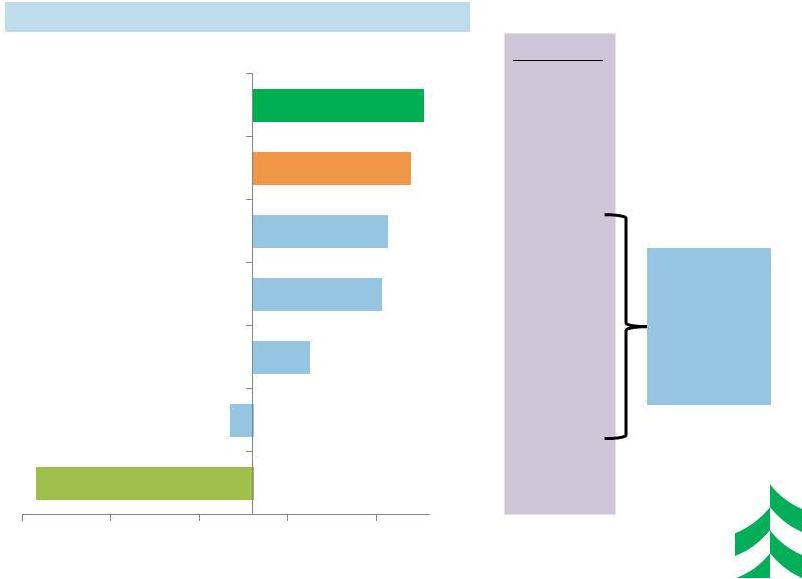
 CAPITAL
DEPLOYMENT OPPORTUNITIES 22
Basel I ASBC
4Q = 11.5%
4Q 11.0%
8% -
9.5%
Basel
III
ASBC
Basel III
=
7%
+1
–
25%
Potential
Excess Capital
1.5 –
3%
~
~
Organic
Asset Growth
Non Organic Cash
Acquisition
Repurchase /
Special Dividend
Capacity
Capital
Deployment
Options
2
1
3
1
Regional and Community Banks
2
Systematically Important Financial Institutions
3
In July 2013, the Federal Reserve and the OCC published final rules (the “Basel III Capital
Rules”) establishing a new comprehensive capital framework for U.S. banking
organizations. 11.0% is 3Q estimate of Basel III capital ratio. |
 WHY
ASSOCIATED 23
1
–
Return
on
Tier
1
Common
Equity
(ROT1CE)
=
Management
uses
Tier
1
common
equity,
along
with
other
capital measures, to assess and monitor our capital position. This is a
non-GAAP financial measure. Please refer to the appendix for a
definition of this and other non-GAAP items. Net Income Available
to Common
($ in millions)
Return on Tier 1
Common Equity
Management Team Focused on Creating
Long-Term Shareholder Value
•
Strong Capital Profile & Opportunities for
Capital Deployment
•
Committed to Efficiency Ratio Improvement
•
Leading Midwest Bank Operating in
Attractive Markets
•
Core Organic Growth Opportunity
•
Disciplined Loan and Deposit Pricing
•
Improving Credit Quality
•
Improving Earnings Profile
$115
$174
$184
6.7%
9.5%
9.8%
0.00%
2.00%
4.00%
6.00%
8.00%
10.00%
$0
$30
$60
$90
$120
$150
$180
$210
$240
YTD 2011
YTD 2012
YTD 2013
Net
Income
Available
to
Common
&
ROT1CE
1
Reasons to Invest |
 PROMOTING THE ASSOCIATED BRAND
24 |
 APPENDIX
25 |
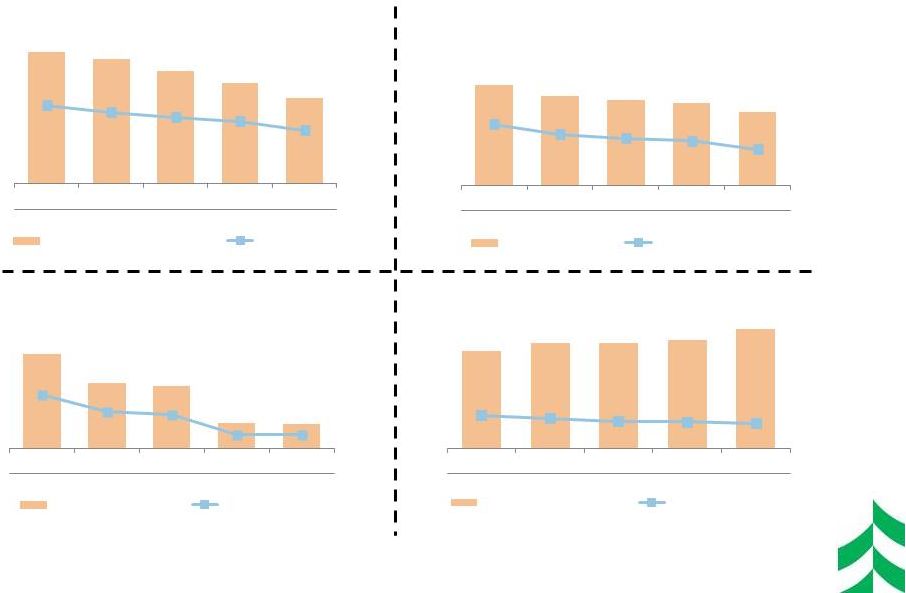 IMPROVEMENT IN CREDIT QUALITY INDICATORS
($ IN MILLIONS)
26
$361
$344
$310
$277
$235
1.23%
1.12%
1.04%
0.98%
0.84%
4Q 2012
1Q 2013
2Q 2013
3Q 2013
4Q 2013
Potential Problem Loans
NPA / Assets
$253
$225
$217
$208
$185
1.64%
1.45%
1.38%
1.17%
4Q 2012
1Q 2013
2Q 2013
3Q 2013
4Q 2013
Nonaccruals
Nonaccruals / Loans
$21
$14
$14
$5
$5
0.55%
0.38%
0.35%
0.14%
0.14%
4Q 2012
1Q 2013
2Q 2013
3Q 2013
4Q 2013
Net Charge Offs
NCOs / Avg Loans
118%
127%
127%
131%
145%
1.93%
1.84%
1.76%
1.74%
1.69%
4Q 2012
1Q 2013
2Q 2013
3Q 2013
4Q 2013
ALLL/ Nonaccruals
ALLL/ Total Loans
1.33% |
 Market Value Composition –
December 31, 2013
Investment Portfolio –
December 31, 2013
Type
Bk Value
(000’s)
Mkt Value
(000’s)
TEY
(%)
Duration
(Yrs)
Govt & Agencies
$1,001
$ 1,002
0.30
0.63
MBS
2,949,588
2,936,426
2.61
3.84
CMOs
908,914
905,018
2.56
2.57
GNMA CMBS
673,554
647,477
2.10
5.13
Municipals
828,968
845,969
5.16
5.03
ABS
23,049
23,059
0.56
0.29
Corporates
60,693
61,466
1.72
1.11
Other
18
57
---
---
TOTAL HTM &
AFS
$5,445,785
$5,420,474
2.90
3.91
INVESTMENT SECURITIES PORTFOLIO
27
Portfolio Ratings Composition –
December 31, 2013
Type
Mk Value
(000’s)
% of Total
0% RWA
$716,096
13.2%
20% RWA
4,661,361
86.0%
50% RWA
21,932
0.4%
=>100% RWA
48,549
0.9%
Not subject to RW
-27,465
-0.5%
TOTAL Market Value
$5,420,474
100.0%
Risk Weighting Profile –
December 31, 2013
Credit Rating
($ in thousands)
Mkt Value
(000’s)
% of Total
Govt & Agency
$4,486,907
82.8%
AAA
70,862
1.3%
AA
645,922
11.9%
A
205,858
3.8%
BAA1, BAA2 & BAA3
628
0.0%
BA1 & Lower
2,204
0.0%
Non-rated
8,093
0.2%
TOTAL Market Value
$5,420,474
100.0% |
 SEGMENT PROFITABILITY
YTD DECEMBER 2013
28
* Average Earning Assets
ASBC
Earning Assets* = $21.0 bln
Total Revenue = $958.6 mm
Net Income = $188.7 mm
ROT1CE: 9.8%
Consumer Banking Segment
Earning Assets* = $7.2
Total Revenue = $518.7 mm
Net Income = $45.5 mm
ROT1CE: 8.5%
Risk Management & Shared
Services Segment
Earning Assets* = $5.3 bn
Total Revenue = $27.2 mm
Net Income = $32.5 mm
ROT1CE: 4.8%
Commercial Banking
Segment
Earning Assets* = $8.4 bn
Total Revenue = $412.8 mm
Net Income = $110.7 mm
ROT1CE: 14.2%
bn |
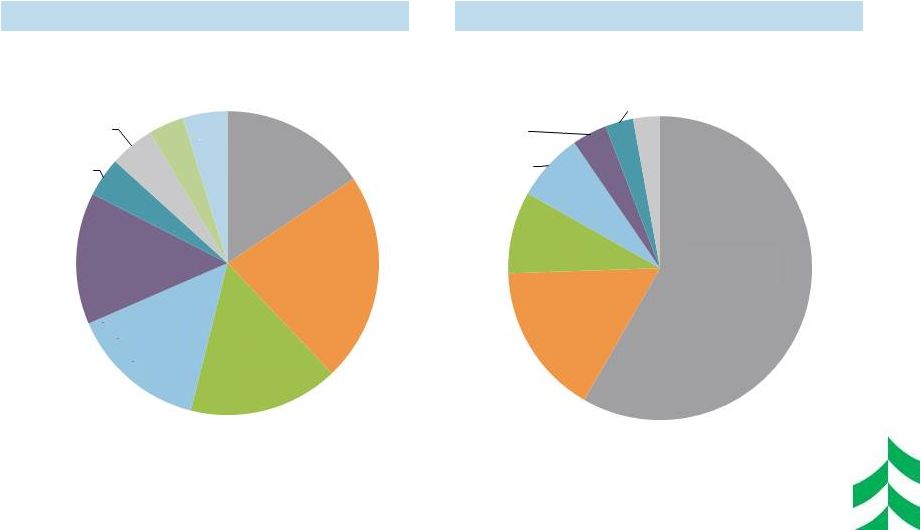 NONINTEREST INCOME AND EXPENSE
COMPOSITION
YTD DECEMBER 2013
29
($313 million)
($681 million)
Mortgage
Banking
16%
Svc Chg on
Deposits
22%
Card & Other
Non Deposit
16%
Trust Service
Fees
14%
Insurance
14%
Capital Market
4%
Brokerage &
5%
BOLI
4%
Other
5%
Personnel
58%
All other
16%
Occupancy
9%
Technology
7%
Equipment
4%
Legal &
Professional
3%
FDIC
3%
Annuity
Noninterest Income by Category
Noninterest Expense by Category |
 RECONCILIATION AND DEFINITIONS OF
NON-GAAP ITEMS
30
YTD 2013
YTD 2012
YTD 2011
Efficiency Ratio Reconciliation:
Efficiency ratio (1)
71.05
72.92%
73.33%
Taxable equivalent adjustment
(1.46)
(1.60)
(1.72)
Asset gains (losses), net
0.40
(0.90)
(0.95)
Other intangible amortization
(0.42)
(0.43)
(0.51)
Efficiency ratio, fully taxable equivalent (1)
69.57%
69.99%
70.15%
(1)
Efficiency
ratio
is
defined
by
the
Federal
Reserve
guidance
as
noninterest
expense
divided
by
the
sum
of
net
interest
income
plus
noninterest
income, excluding investment securities gains / losses, net. Efficiency
ratio, fully taxable equivalent, is noninterest expense, excluding other
intangible amortization, divided by the sum of taxable equivalent net interest
income plus noninterest income, excluding investment securities gains /
losses, net and asset gains / losses, net. This efficiency ratio is presented on a taxable equivalent basis, which adjusts net interest
income for the tax-favored status of certain loans and investment
securities. Management believes this measure to be the preferred industry
measurement of net interest income as it enhances the comparability of net interest
income arising from taxable and tax-exempt sources and it excludes
certain specific revenue items (such as investment securities gains / losses, net and asset gains / losses, net).
Definition of Tier 1 Common Equity :
Tier
1
Common
Equity
(T1CE),
a
non-GAAP
financial
measure,
is
used
by
banking
regulators,
investors
and
analysts
to
assess
and
compare
the
quality
and
composition
of
our
capital
with
the
capital
of
other
financial
services
companies.
Management
uses
Tier
1
common
equity,
along
with
other capital measures, to assess and monitor our capital position. Tier 1 Common
Equity is Tier 1 capital excluding qualifying perpetual preferred stock and
qualifying trust preferred securities. |
 OUR
VISION 31
ASSOCIATED
will
be
the
most
admired Midwestern financial
services company, distinguished by
sound, value-added financial
solutions with personal service for
our customers, built upon a strong
commitment to our colleagues and
the communities we serve, resulting
in exceptional value for our
shareholders. |