Attached files
| file | filename |
|---|---|
| 8-K - 8-K - PNMAC Holdings, Inc. | a14-5187_18k.htm |
| EX-10.1 - EX-10.1 - PNMAC Holdings, Inc. | a14-5187_1ex10d1.htm |
| EX-99.1 - EX-99.1 - PNMAC Holdings, Inc. | a14-5187_1ex99d1.htm |
Exhibit 99.2
|
|
Fourth Quarter 2013 Earnings Report |
|
|
Forward-Looking Statements 2 This presentation contains forward-looking statements within the meaning of Section 21E of the Securities Exchange Act of 1934, as amended, regarding management’s beliefs, estimates, projections and assumptions with respect to, among other things, the Company’s financial results, future operations, business plans and investment strategies, as well as industry and market conditions, all of which are subject to change. Words like “believe,” “expect,” “anticipate,” “promise,” “plan,” and other expressions or words of similar meanings, as well as future or conditional verbs such as “will,” “would,” “should,” “could,” or “may” are generally intended to identify forward-looking statements. Actual results and operations for any future period may vary materially from those projected herein, from past results discussed herein, or from illustrative examples provided herein. Factors which could cause actual results to differ materially from historical results or those anticipated include, but are not limited to: changes in federal, state and local laws and regulations applicable to the highly regulated industry in which we operate; lawsuits or governmental actions if we do not comply with the laws and regulations applicable to our businesses; the creation of the Consumer Financial Protection Bureau, or CFPB, and enforcement of its rules; changes in existing U.S. government-sponsored entities, their current roles or their guarantees or guidelines; changes to government mortgage modification programs; the licensing and operational requirements of states and other jurisdictions applicable to our businesses, to which our bank competitors are not subject; foreclosure delays and changes in foreclosure practices; certain banking regulations that may limit our business activities; changes in macroeconomic and U.S. residential real estate market conditions; difficulties in growing loan production volume; changes in prevailing interest rates; increases in loan delinquencies and defaults; our reliance on PennyMac Mortgage Investment Trust as a significant source of financing for, and revenue related to, our correspondent lending business; availability of required additional capital and liquidity to support business growth; our obligation to indemnify third-party purchasers or repurchase loans that we originate, acquire or assist in with fulfillment; our obligation to indemnify advised entities or investment funds to meet certain criteria or characteristics or under other circumstances; decreases in the historical returns on the assets that we select and manage for our clients, and our resulting management and incentive fees; regulation applicable to our investment management segment; conflicts of interest in allocating our services and investment opportunities among ourselves and our advised entities; the potential damage to our reputation and adverse impact to our business resulting from ongoing negative publicity; and our rapid growth. You should not place undue reliance on any forward-looking statement and should consider all of the uncertainties and risks described above, as well as those more fully discussed in reports and other documents filed by the Company with the Securities and Exchange Commission from time to time. The Company undertakes no obligation to publicly update or revise any forward-looking statements or any other information contained herein, and the statements made in this presentation are current as of the date of this presentation only. |
|
|
Fourth Quarter Highlights 3 Pretax income of $41.7 million; diluted earnings per common share of $0.32 Total net revenue of $90.4 million, up 4% from 3Q13 Expenses totaled $48.7 million, down 7% from 3Q13 Loan production totaled $6.0 billion in unpaid principal balance (UPB), down 25% from 3Q13(1) Correspondent loan acquisitions were $5.8 billion, down 25% from 3Q13 Retail originations were $211 million, down 26% from 3Q13 Both correspondent and retail continue to gain share; higher mortgage rates continued to cause a decline in U.S. mortgage originations for the quarter, with the top lenders reporting volume declines in excess of 35 percent Servicing portfolio reached $78.2 billion in UPB, up 48% from September 30, 2013 Successfully closed and transferred previously announced bulk mortgage servicing rights (MSR) portfolio acquisitions totaling $20.1 billion in UPB Now one of the 20 largest servicers in the U.S.(2) Net assets under management totaled $2.0 billion, down 1% from September 30, 2013(3) (1) Includes $2.5 billion of fee-based fulfillment activity for PMT (2) Source: Inside Mortgage Finance, as of January 24, 2014 (3) Largely due to a reduction in PMT shareholders’ equity resulting from a shift in the timing of its quarterly dividends |
|
|
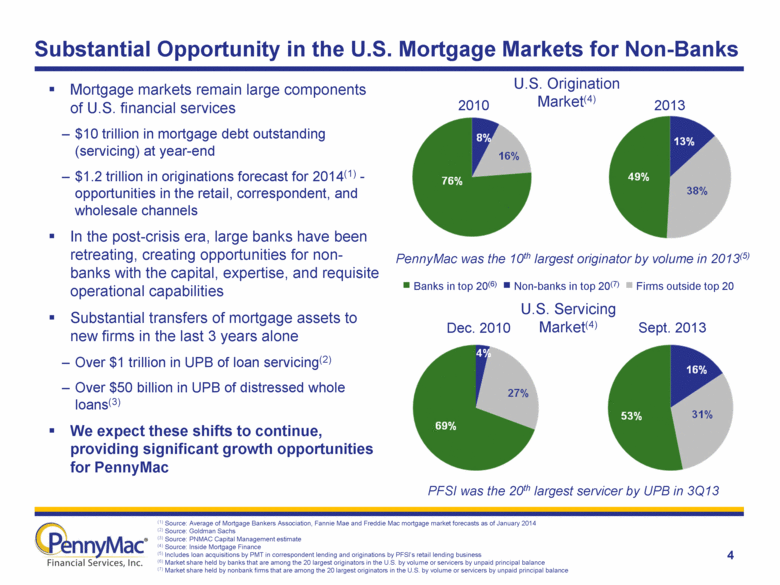
Substantial Opportunity in the U.S. Mortgage Markets for Non-Banks U.S. Origination Market(4) 2010 2013 Mortgage markets remain large components of U.S. financial services $10 trillion in mortgage debt outstanding (servicing) at year-end $1.2 trillion in originations forecast for 2014(1) -opportunities in the retail, correspondent, and wholesale channels In the post-crisis era, large banks have been retreating, creating opportunities for non-banks with the capital, expertise, and requisite operational capabilities Substantial transfers of mortgage assets to new firms in the last 3 years alone Over $1 trillion in UPB of loan servicing(2) Over $50 billion in UPB of distressed whole loans(3) We expect these shifts to continue, providing significant growth opportunities for PennyMac U.S. Servicing Market(4) Dec. 2010 Sept. 2013 PennyMac was the 10th largest originator by volume in 2013(5) PFSI was the 20th largest servicer by UPB in 3Q13 Banks in top 20(6) Non-banks in top 20(7) Firms outside top 20 (1) Source: Average of Mortgage Bankers Association, Fannie Mae and Freddie Mac mortgage market forecasts as of January 2014 (2) Source: Goldman Sachs (3) Source: PNMAC Capital Management estimate (4) Source: Inside Mortgage Finance (5) Includes loan acquisitions by PMT in correspondent lending and originations by PFSI’s retail lending business (6) Market share held by banks that are among the 20 largest originators in the U.S. by volume or servicers by unpaid principal balance (7) Market share held by nonbank firms that are among the 20 largest originators in the U.S. by volume or servicers by unpaid principal balance 4 |
|
|
2010 PFSI Has Developed in a Sustainable Manner for Long-Term Growth 2009 2011 2012 2013 1,373 1,028 435 Employees at year end 230 128 PFSI completed initial public offering Opened additional servicing facility in Fort Worth Servicing UPB reaches $78 billion Primary operations moved to new flagship facility in Moorpark, CA Correspondent leadership team expands 5 2008 Servicing leadership team strengthened Correspondent lending system launches Opened Tampa facility for correspondent fulfillment operations Becomes largest non-bank correspondent aggregator Correspondent Lending Group (CLG) established with a focus on product development Organic growth with a focus on the quality of our operations Culture of building management, processes and systems before adding large transaction volumes Disciplined growth, in recognition of the demands of the GSEs and other Agencies, our financing partners and regulators Operations launched De novo build of legacy-free mortgage servicer 72 |
|
|
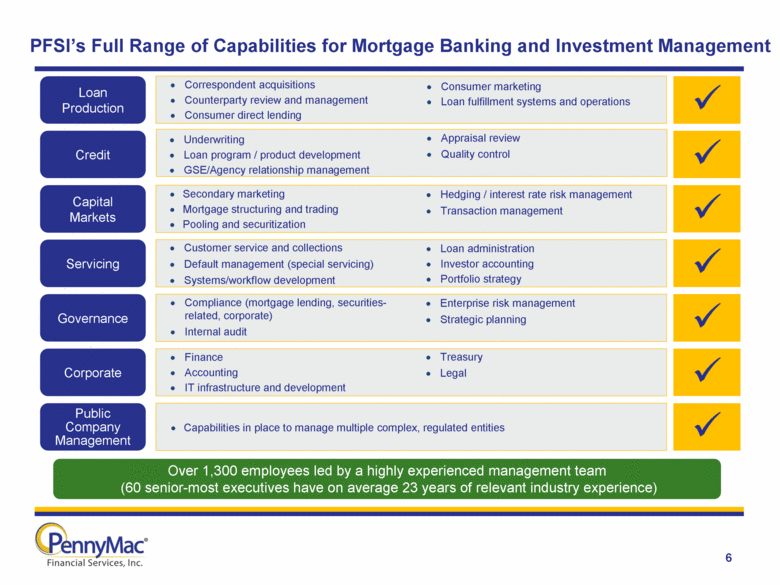
PFSI’s Full Range of Capabilities for Mortgage Banking and Investment Management Loan Production Servicing Capital Markets Credit Governance Corporate Public Company Management 6 Correspondent acquisitions Counterparty review and management Consumer direct lending Consumer marketing Loan fulfillment systems and operations Underwriting Loan program / product development GSE/Agency relationship management Appraisal review Quality control Secondary marketing Mortgage structuring and trading Pooling and securitization Hedging / interest rate risk management Transaction management Customer service and collections Default management (special servicing) Systems/workflow development Loan administration Investor accounting Portfolio strategy Compliance (mortgage lending, securities-related, corporate) Internal audit Enterprise risk management Strategic planning Finance Accounting IT infrastructure and development Treasury Legal Capabilities in place to manage multiple complex, regulated entities Over 1,300 employees led by a highly experienced management team (60 senior-most executives have on average 23 years of relevant industry experience) |
|
|
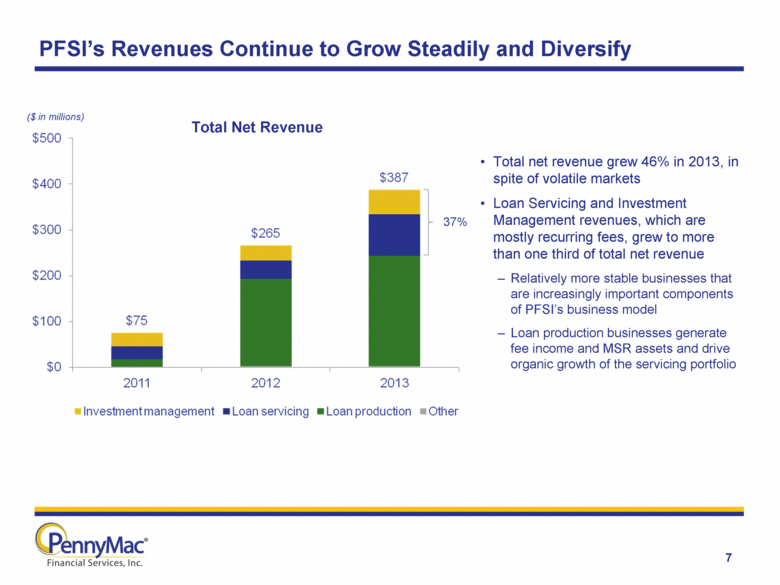
PFSI’s Revenues Continue to Grow Steadily and Diversify Total net revenue grew 46% in 2013, in spite of volatile markets Loan Servicing and Investment Management revenues, which are mostly recurring fees, grew to more than one third of total net revenue Relatively more stable businesses that are increasingly important components of PFSI’s business model Loan production businesses generate fee income and MSR assets and drive organic growth of the servicing portfolio Total Net Revenue 37% ($ in millions) 7 |
|
|
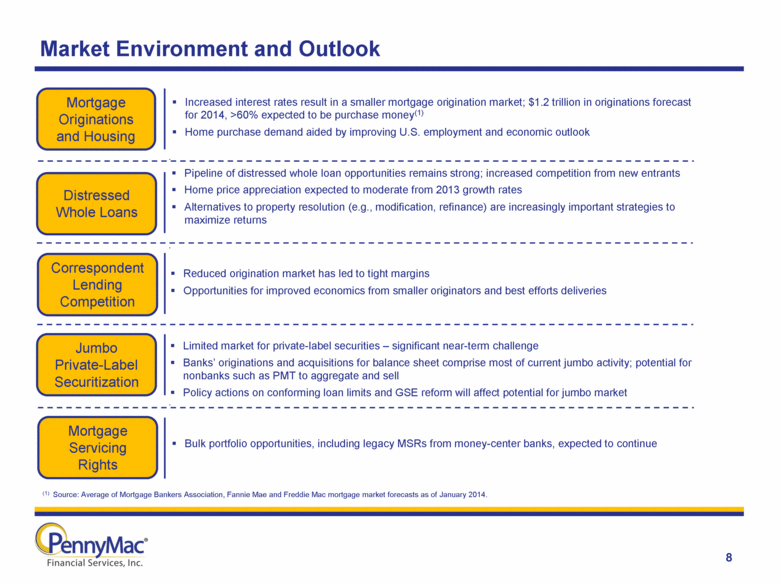
Market Environment and Outlook 8 Correspondent Lending Competition Jumbo Private-Label Securitization Mortgage Originations and Housing Distressed Whole Loans (1) Source: Average of Mortgage Bankers Association, Fannie Mae and Freddie Mac mortgage market forecasts as of January 2014. Mortgage Servicing Rights Increased interest rates result in a smaller mortgage origination market; $1.2 trillion in originations forecast for 2014, >60% expected to be purchase money(1) Home purchase demand aided by improving U.S. employment and economic outlook Reduced origination market has led to tight margins Opportunities for improved economics from smaller originators and best efforts deliveries Pipeline of distressed whole loan opportunities remains strong; increased competition from new entrants Home price appreciation expected to moderate from 2013 growth rates Alternatives to property resolution (e.g., modification, refinance) are increasingly important strategies to maximize returns Bulk portfolio opportunities, including legacy MSRs from money-center banks, expected to continue Limited market for private-label securities – significant near-term challenge Banks’ originations and acquisitions for balance sheet comprise most of current jumbo activity; potential for nonbanks such as PMT to aggregate and sell Policy actions on conforming loan limits and GSE reform will affect potential for jumbo market |
|
|
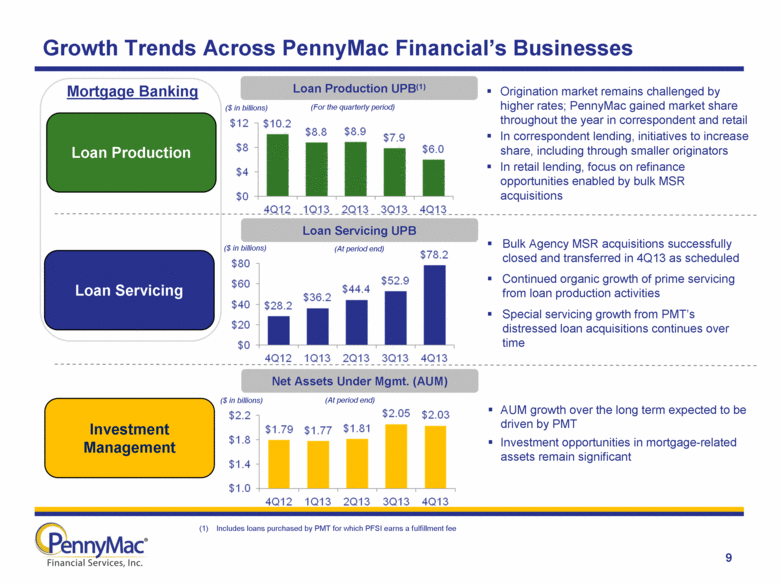
Growth Trends Across PennyMac Financial’s Businesses 9 Loan Production Loan Servicing Mortgage Banking Investment Management Loan Production UPB(1) Loan Servicing UPB Net Assets Under Mgmt. (AUM) (At period end) (For the quarterly period) (1) Includes loans purchased by PMT for which PFSI earns a fulfillment fee Bulk Agency MSR acquisitions successfully closed and transferred in 4Q13 as scheduled Continued organic growth of prime servicing from loan production activities Special servicing growth from PMT’s distressed loan acquisitions continues over time AUM growth over the long term expected to be driven by PMT Investment opportunities in mortgage-related assets remain significant Origination market remains challenged by higher rates; PennyMac gained market share throughout the year in correspondent and retail In correspondent lending, initiatives to increase share, including through smaller originators In retail lending, focus on refinance opportunities enabled by bulk MSR acquisitions (At period end) ($ in billions) ($ in billions) ($ in billions) |
|
|
10 (UPB in billions) Correspondent acquisitions by PMT in 4Q13 totaled $5.8 billion 58% government-insured loans (gain on mortgage loans to PFSI); 42% fulfillment activity for PMT (fee revenue to PFSI) Smaller declines in government-insured volumes (16% Q/Q from 3Q13), reflecting specialized nature and PennyMac’s strong competitive position Purchase-money originations comprised 89% of government-insured acquisitions January correspondent acquisitions totaled $1.7 billion; locks totaled $1.5 billion PennyMac Financial’s Businesses – Correspondent Lending (1) Includes loans acquired by PMT, for which PFSI earns a fulfillment fee. Correspondent Volume and Mix Growth Opportunities (1) Operational Highlights Strategic focus on initiatives to grow volume and optimize profitability Greater emphasis on smaller mortgage originators and community banks, which benefit most from PennyMac’s broad capabilities Gaining relevance in the Northeast Opportunities to increase business from clients delivering low volumes to PMT (1) |
|
|
Retail originations totaled $211 million in 4Q13, down 26% from 3Q13 Non-portfolio originations comprised 51% of total retail originations Smaller decline in portfolio-sourced originations (15% Q/Q), due to a growing servicing portfolio and targeted initiatives to enhance lead generation success from customer service activities Launched Business Development Officer (BDO) initiative to drive local/regional Realtor and builder leads to PennyMac’s national call center platform National marketing campaigns (TV, radio, direct mail) are helping build PennyMac brand recognition Continued investment in operational platform and technology, e.g., mobile phone app 11 (UPB in millions) PennyMac Financial’s Businesses – Retail Lending Retail Origination Volume Growth Opportunities Operational Highlights MSR acquisitions expected to add meaningful portfolio-sourced volume Recently acquired legacy MSRs have significant recapture potential – initial results promising Continued development of the consumer direct platform for the purchase-money market Marketing efforts supported by BDOs, national campaigns, and continuous improvements to process and customer service |
|
|
12 PennyMac Financial’s Businesses – Loan Servicing Loan Servicing Portfolio as of 12/31/13 Growth Opportunities Operational Highlights Servicing portfolio totaled $78.2 billion in UPB at quarter-end, up 48% from 3Q13 Prime servicing and subservicing net growth of $25.5 billion in UPB from September 30, 2013 Bulk MSR acquisitions completed during 4Q13, adding $20.1 billion in UPB to the portfolio Successful close and transfers of the bulk MSR acquisitions as scheduled, in close cooperation with the selling institutions and Agencies Strategic relationship with PMT which co-invests in the MSR acquisitions through the purchase of excess servicing spread, reducing PFSI’s capital requirements Continue to seek additional bulk MSR acquisitions Continued flow of opportunities expected in 2014 Co-investment opportunities with PMT Ongoing growth in prime portfolio from loan production Special servicing opportunities from PMT’s distressed whole loan acquisitions 100% = $78.2 billion in UPB |
|
|
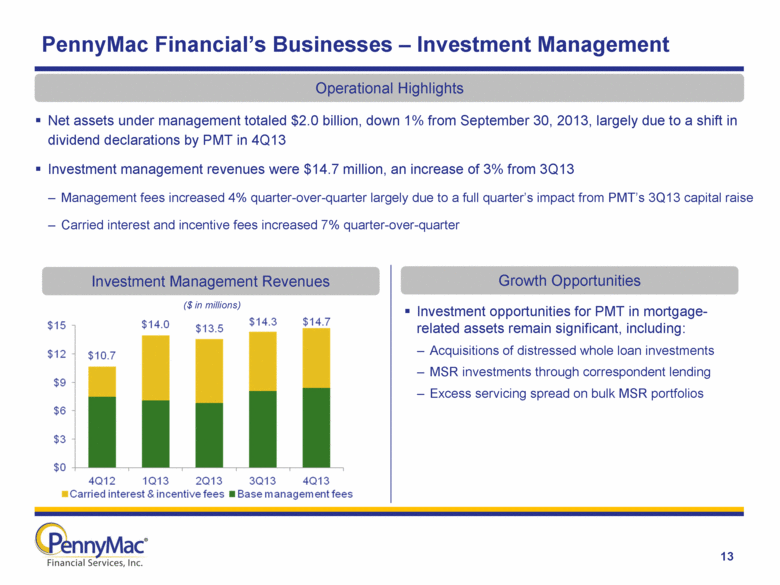
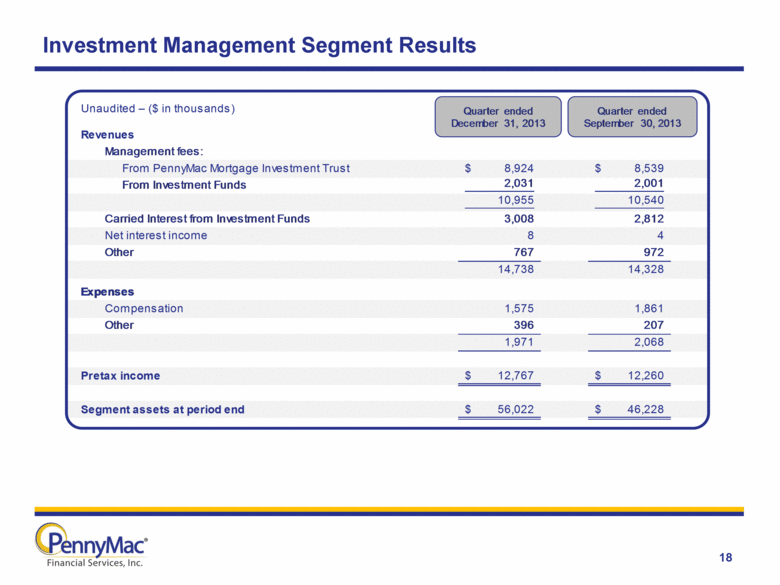
13 ($ in millions) PennyMac Financial’s Businesses – Investment Management Investment Management Revenues Growth Opportunities Operational Highlights Investment opportunities for PMT in mortgage-related assets remain significant, including: Acquisitions of distressed whole loan investments MSR investments through correspondent lending Excess servicing spread on bulk MSR portfolios Net assets under management totaled $2.0 billion, down 1% from September 30, 2013, largely due to a shift in dividend declarations by PMT in 4Q13 Investment management revenues were $14.7 million, an increase of 3% from 3Q13 Management fees increased 4% quarter-over-quarter largely due to a full quarter’s impact from PMT’s 3Q13 capital raise Carried interest and incentive fees increased 7% quarter-over-quarter |
|
|
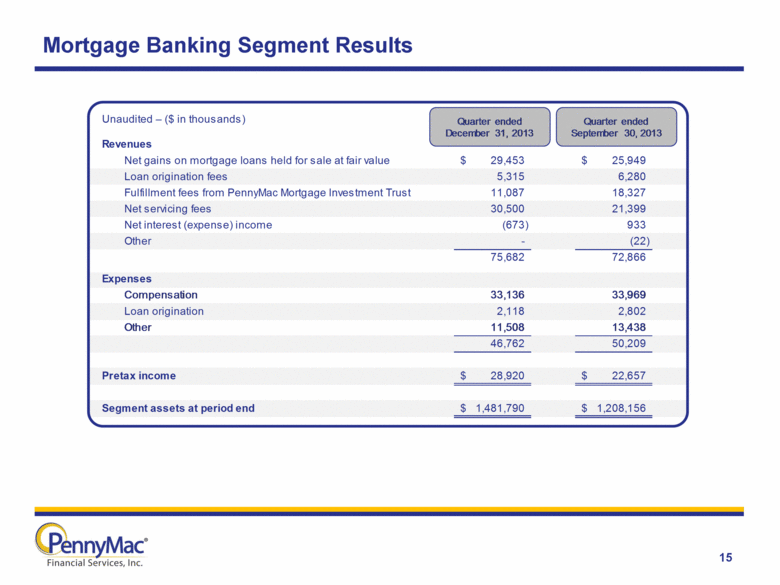
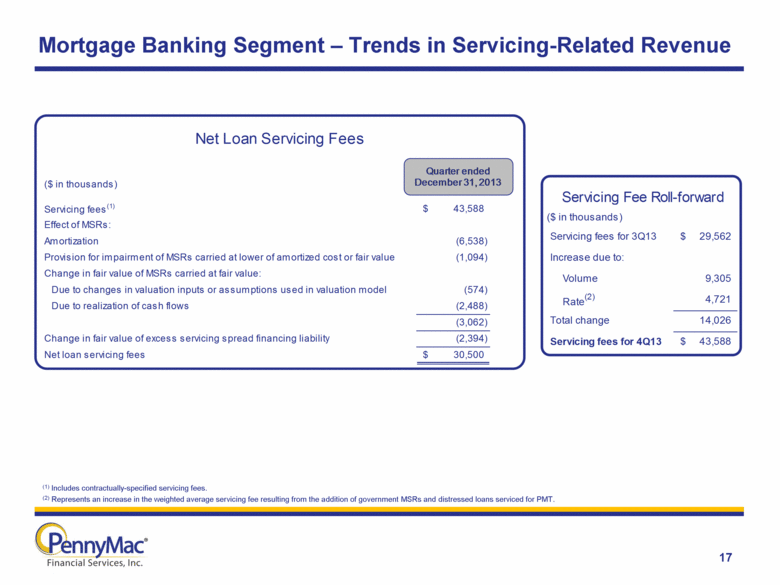
Fourth Quarter Financial Review 14 Diluted earnings per common share of $0.32 Net income of $37.3 million, up 19% from 3Q13 Net income attributable to PFSI shareholders of $6.4 million Total net revenue of $90.4 million, up 4% from 3Q13 Business Segment Results Mortgage Banking segment pretax income of $28.9 million, up 28% from 3Q13 Net gain on mortgage loans held for sale totaled $29.5 million, up 14% from 3Q13 Smaller declines in government-insured correspondent locks (7% Q/Q) reflects PennyMac’s strong competitive position Net loan servicing fees totaled $30.5 million; $1.1 million in excess servicing spread paid to PMT which is included in interest expense Higher servicing fees resulted from MSR portfolio acquisitions and an increase in special servicing fees from a growing portfolio of distressed loans at PMT Investment Management segment pretax income of $12.8 million, up 4% from 3Q13 |
|
|
Mortgage Banking Segment Results 15 Net gains on mortgage loans held for sale at fair value 29,453 $ 25,949 $ Loan origination fees 5,315 6,280 Fulfillment fees from PennyMac Mortgage Investment Trust 11,087 18,327 Net servicing fees 30,500 21,399 Net interest (expense) income (673) 933 Other - (22) 75,682 72,866 Compensation 33,136 33,969 Loan origination 2,118 2,802 Other 11,508 13,438 46,762 50,209 Pretax income 28,920 $ 22,657 $ Segment assets at period end 1,481,790 $ 1,208,156 $ Expenses Unaudited – ($ in thousands) Revenues Quarter ended December 31 , 2013 Quarter ended September 30, 2013 |
|
|
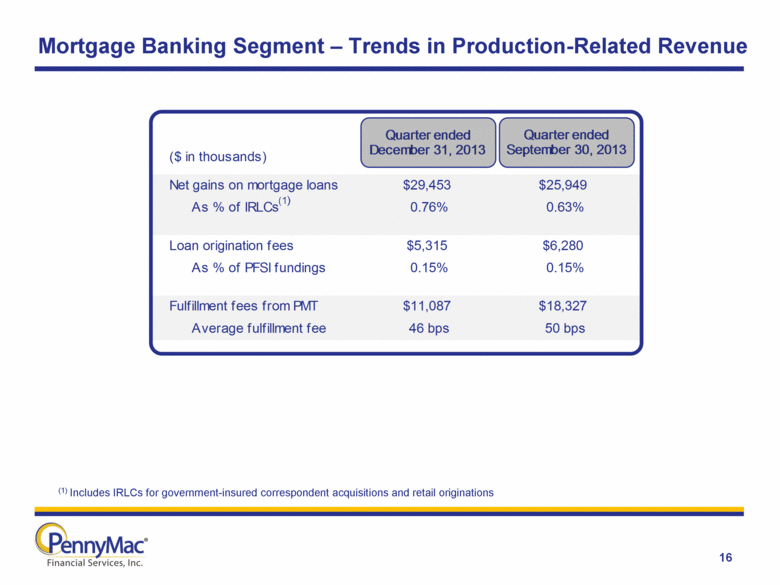
Mortgage Banking Segment – Trends in Production-Related Revenue 16 (1) Includes IRLCs for government-insured correspondent acquisitions and retail originations (1) Net gains on mortgage loans $29,453 $25,949 As % of IRLCs 0.76% 0.63% Loan origination fees $5,315 $6,280 As % of PFSI fundings 0.15% 0.15% Fulfillment fees from PMT $11,087 $18,327 Average fulfillment fee 46 bps 50 bps ($ in thousands) Quarter ended December 31, 2013 Quarter ended September 30, 2013 |
|
|
Mortgage Banking Segment – Trends in Servicing-Related Revenue (1) Includes contractually-specified servicing fees. (2) Represents an increase in the weighted average servicing fee resulting from the addition of government MSRs and distressed loans serviced for PMT. 17 Servicing fees for 3Q13 29,562 $ Increase due to: Volume 9,305 Rate (2) 4,721 Total change 14,026 Servicing fees for 4Q13 43,588 $ ($ in thousands) Servicing Fee Roll-forward ($ in thousands) Servicing fees (1) 43,588 $ Effect of MSRs: Amortization (6,538) Provision for impairment of MSRs carried at lower of amortized cost or fair value (1,094) Change in fair value of MSRs carried at fair value: Due to changes in valuation inputs or assumptions used in valuation model (574) Due to realization of cash flows (2,488) (3,062) Change in fair value of excess servicing spread financing liability (2,394) Net loan servicing fees 30,500 $ Net Loan Servicing Fees Quarter ended December 31, 2013 |
|
|
Investment Management Segment Results 18 Management fees: From PennyMac Mortgage Investment Trust 8,924 $ 8,539 $ From Investment Funds 2,031 2,001 10,955 10,540 Carried Interest from Investment Funds 3,008 2,812 Net interest income 8 4 Other 767 972 14,738 14,328 Compensation 1,575 1,861 Other 396 207 1,971 2,068 Pretax income 12,767 $ 12,260 $ Segment assets at period end 56,022 $ 46,228 $ Expenses Unaudited – ($ in thousands) Revenues Quarter ended December 31 , 2013 Quarter ended September 30, 2013 |
|
|
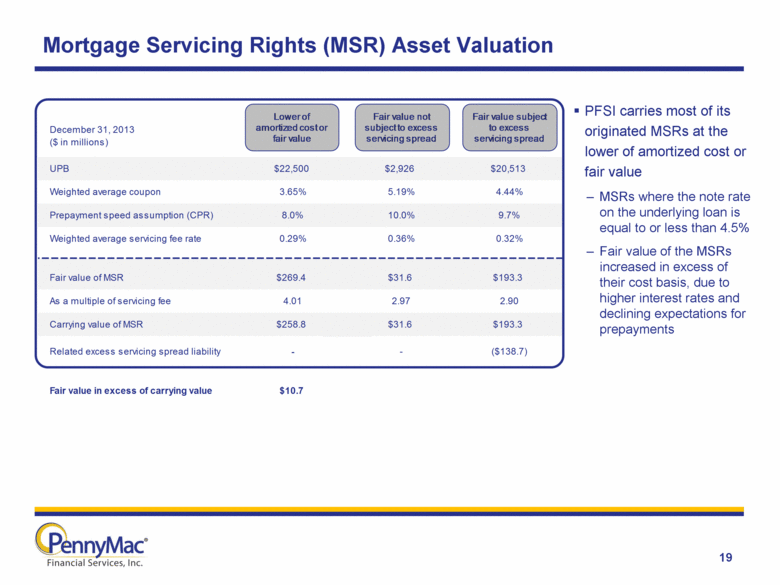
Mortgage Servicing Rights (MSR) Asset Valuation 19 PFSI carries most of its originated MSRs at the lower of amortized cost or fair value MSRs where the note rate on the underlying loan is equal to or less than 4.5% Fair value of the MSRs increased in excess of their cost basis, due to higher interest rates and declining expectations for prepayments UPB $22,500 $2,926 $20,513 Weighted average coupon 3.65% 5.19% 4.44% Prepayment speed assumption (CPR) 8.0% 10.0% 9.7% Weighted average servicing fee rate 0.29% 0.36% 0.32% Fair value of MSR $269.4 $31.6 $193.3 As a multiple of servicing fee 4.01 2.97 2.90 Carrying value of MSR $258.8 $31.6 $193.3 Related excess servicing spread liability - - ($138.7) Fair value in excess of carrying value $10.7 December 31, 2013 ($ in millions) Lower of amortized cost or fair value Fair value not subject to excess servicing spread Fair value subject to excess servicing spread |
|
|
Appendix |
|
|
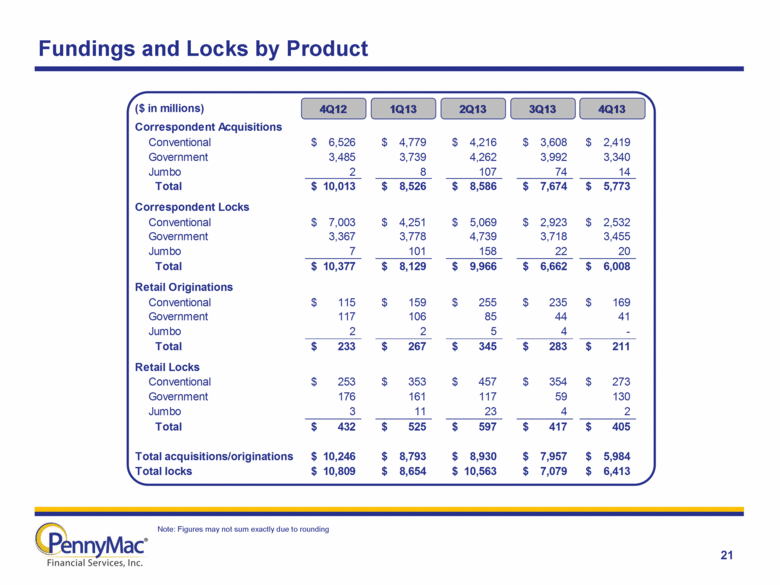
Fundings and Locks by Product 21 Note: Figures may not sum exactly due to rounding ($ in millions) Correspondent Acquisitions Conventional 6,526 $ 4,779 $ 4,216 $ 3,608 $ 2,419 $ Government 3,485 3,739 4,262 3,992 3,340 Jumbo 2 8 107 74 14 Total 10,013 $ 8,526 $ 8,586 $ 7,674 $ 5,773 $ Correspondent Locks Conventional 7,003 $ 4,251 $ 5,069 $ 2,923 $ 2,532 $ Government 3,367 3,778 4,739 3,718 3,455 Jumbo 7 101 158 22 20 Total 10,377 $ 8,129 $ 9,966 $ 6,662 $ 6,008 $ Retail Originations Conventional 115 $ 159 $ 255 $ 235 $ 169 $ Government 117 106 85 44 41 Jumbo 2 2 5 4 - Total 233 $ 267 $ 345 $ 283 $ 211 $ Retail Locks Conventional 253 $ 353 $ 457 $ 354 $ 273 $ Government 176 161 117 59 130 Jumbo 3 11 23 4 2 Total 432 $ 525 $ 597 $ 417 $ 405 $ Total acquisitions/originations 10,246 $ 8,793 $ 8,930 $ 7,957 $ 5,984 $ Total locks 10,809 $ 8,654 $ 10,563 $ 7,079 $ 6,413 $ 4Q12 1Q13 2Q13 3Q13 4Q13 |

