Attached files
| file | filename |
|---|---|
| 8-K - 8-K - Hi-Crush Inc. | a8-kxq42013.htm |
| EX-99.1 - EXHIBIT - Hi-Crush Inc. | exhibit991-earningsrelease.htm |

4TH QUARTER AND FULL YEAR 2013 EARNINGS RELEASE FEBRUARY 2014

Forward Looking Statements Some of the information included herein may contain forward-looking statements within the meaning of the federal securities laws. Forward-looking statements give our current expectations and may contain projections of results of operations or of financial condition, or forecasts of future events. Words such as “may,” “assume,” “forecast,” “position,” “predict,” “strategy,” “expect,” “intend,” “plan,” “estimate,” “anticipate,” “could,” “believe,” “project,” “budget,” “potential,” or “continue,” and similar expressions are used to identify forward-looking statements. They can be affected by assumptions used or by known or unknown risks or uncertainties. Consequently, no expected results of operations or financial condition or other forward-looking statements can be guaranteed. When considering these forward-looking statements, you should keep in mind the risk factors and other cautionary statements in Hi-Crush’s reports filed with the Securities and Exchange Commission (“SEC”), including those described under Item 1A, “Risk Factors” of Hi-Crush’s Annual Report on Form 10-K for the fiscal year ended December 31, 2012 and any subsequently filed Quarterly Report on Form 10-Q. Actual results may vary materially. You are cautioned not to place undue reliance on any forward-looking statements. You should also understand that it is not possible to predict or identify all such factors and should not consider the risk factors in our reports filed with the SEC or the following list to be a complete statement of all potential risks and uncertainties. Factors that could cause our actual results to differ materially from the results contemplated by such forward-looking statements include: the volume of frac sand we are able to sell; the price at which we are able to sell frac sand; the outcome of any pending litigation; changes in the price and availability of natural gas or electricity; changes in prevailing economic conditions; and difficulty collecting receivables. All forward-looking statements are expressly qualified in their entirety by the foregoing cautionary statements. Hi-Crush’s forward-looking statements speak only as of the date made and Hi-Crush undertakes no obligation to update or revise its forward-looking statements, whether as a result of new information, future events or otherwise. 2

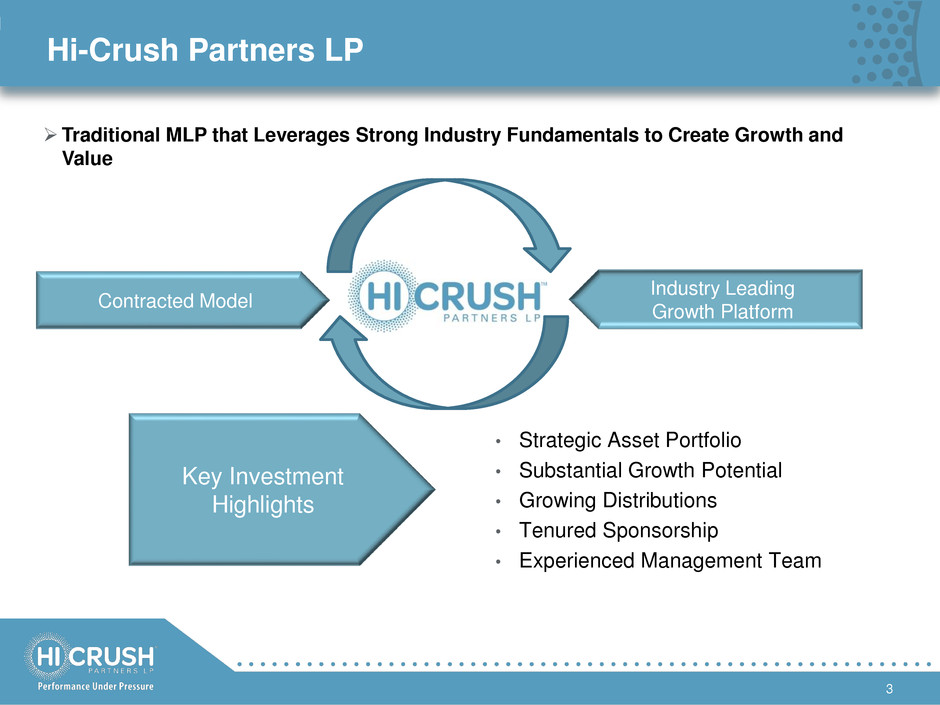
Traditional MLP that Leverages Strong Industry Fundamentals to Create Growth and Value • Strategic Asset Portfolio • Substantial Growth Potential • Growing Distributions • Tenured Sponsorship • Experienced Management Team Key Investment Highlights Contracted Model Industry Leading Growth Platform Hi-Crush Partners LP 3

Our Platform for Growth Strong Industry Fundamentals High Quality Reserve Base Industry Leading Cost Advantage Long-Term Contracted Cashflow • Increasing Northern White sand usage • Constraints on supply growth • Increased drilling and completion efficiencies • Market favors API spec, consistently high quality sand • Lowest-cost producer • 50+ million ton reserve base with significant cost structure advantages • State-of-the-art, efficient and modern plant design • Rail logistics capabilities • Fixed price / volume contracts with terms from 3-6 years • Tenured relationships with customers 4

Multiple Growth Opportunities Ahead Experienced Management Financial Flexibility Multiple Growth Opportunities • Extensive expertise in developing sand mining, processing, and transloading facilities • Substantial management ownership incentivized by distribution growth • Strong balance sheet and contractual cashflow • Cost of capital advantage via MLP structure • Increased volume • Contributions from sponsor • Organic expansion • Acquisitions 5

Maximizing Valuation for Unit Holders Increased Logistics Capabilities Integration with Customer Supply Chain • Dynamics of market continue to change • Premium white sand continues to gain share of proppant market • Flexibility and scale to meet customer volume and timing needs • Proppant providers must be able to “spec-in” immediately • Barriers to entry continue to expand • Industry is ripe for consolidation 6

Platform for the Future Increased Logistics Capabilities Integration with Customer Supply Chain Experienced Management Financial Flexibility Multiple Growth Opportunities Strong Industry Fundamentals High Quality Reserve Base Industry Leading Cost Advantage Long-Term Contracted Cashflow 7

Raised distribution paid in Q4 2013 by 3% and Q1 2014 an additional 4% 2014 distribution guidance of low double digit growth over 2013 2014 Guidance Low Double-Digit Distribution Growth IPO $0.475 Minimum Quarterly Distribution Distribution Increases $0.490 - Q4 ’13 $0.510 - Q1 ’14 Distribution Growth 8

First dropdown from Augusta Hi-Crush acquires D&I for $133 million Successfully settles Baker Hughes lawsuit with new 6-year agreement Doubles size, diversifies revenue and customer platform, drives organic growth opportunities 2013 – A Year of Progress Successfully transitioned support network Established systems control, maintained D&I leadership and employees Added more than 20 customers to platform to date HCLP is the largest frac sand distributor in the Marcellus and Utica HCLP can source, ship and distribute on all mainline railroads 12 destination terminals, 3 five thousand-foot rail spurs, 1.6 million tons of annual processing capacity(1), 1,700 acres of available resources(2) The Transactions The Transition The Transformation (1) Excludes 1.6 million tons processing capacity held at sponsor level (2) Held at sponsor level 9

What We See Ahead Proppant Consumed by Volume Source: The Freedonia Group, August 2013 Raw sand projected to increase as a percentage of proppant market, averaging at least 80% by volume 1.3 5.6 23.5 41.0 62.6 $40 $48 $58 $68 $80 1.8 7.0 29.6 51.2 78.5 0 10 20 30 40 50 60 70 80 90 2002 2007 2012 2017 2022 M ill io n s o f T o n s Raw frac sand Resin-coated sand Ceramics Other $/ton - raw frac sand 10

Logistics Flexibility Critical Augusta Facility Wyeville Facility Sandstone Formations Access to all major US oil and gas basins Destination terminals across Marcellus & Utica, adding location in Permian in 2014 Network of Midwest origin transload terminals, serviced by rail Direct loading of unit trains Links supply with nearby terminal facilities Relationships with multiple railroads Current Shale Plays Shale Basins Prospective Shale Plays Existing Terminals Whitehall Facility 11 Planned Terminals

Fractured markets with small players Trend towards reducing suppliers Opportunities Ahead Executing expansion capital plan over the next two years Addition of distribution assets in June 2013 driving immediate growth Demand Diversification Consolidation Expanding Services Execution on Growth Entry into distribution segment of value chain Flexibility on pricing model Enhanced exposure to new customers Continue to diversify service offerings Increasing lateral lengths, increasing number of frac stages, increasing proppant use per stage Opportunities Drive Use of More Sand 12

HCLP Transformation HCLP 2012 HCLP 2013 Top tier producer of premium white sand Leader in sand supply and logistics $102M Assets $302M 95 Employees 232 1.16M Sand Sold (tons) 1.85M 4 Customers 25+ 0 Destination Terminals 12 13

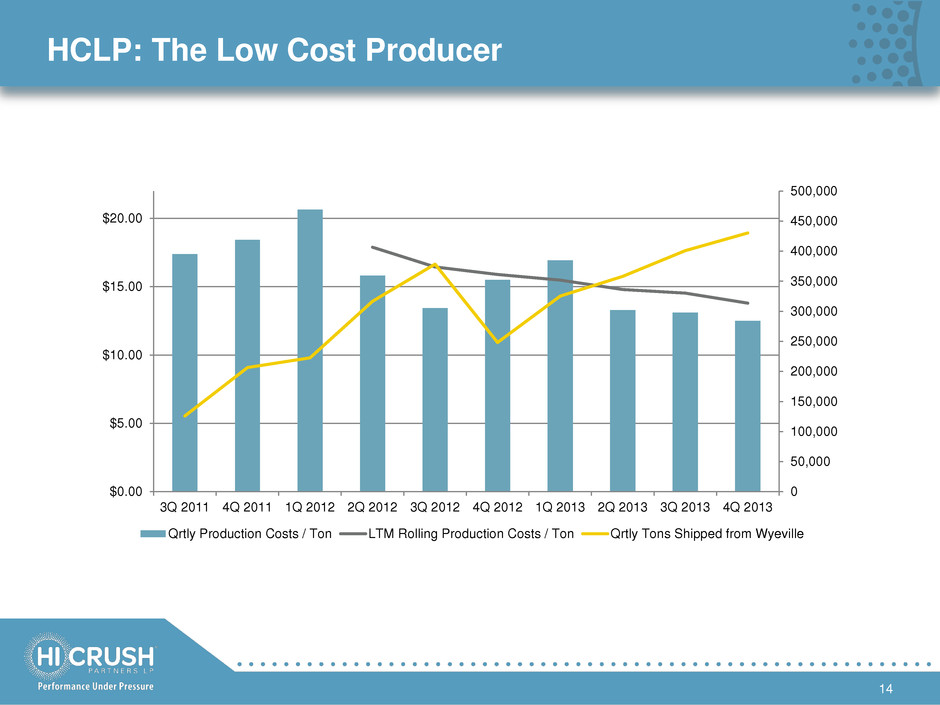
HCLP: The Low Cost Producer 14 0 50,000 100,000 150,000 200,000 250,000 300,000 350,000 400,000 450,000 500,000 $0.00 $5.00 $10.00 $15.00 $20.00 3Q 2011 4Q 2011 1Q 2012 2Q 2012 3Q 2012 4Q 2012 1Q 2013 2Q 2013 3Q 2013 4Q 2013 Qrtly Production Costs / Ton LTM Rolling Production Costs / Ton Qrtly Tons Shipped from Wyeville

Total Frac Sand Capacity Remains Concentrated 15 30% 16% 11% 8% 7% 6% 22% 70% Non tier-one capacity Company A Company B Company C Company D Hi-Crush All other tier one Notes: Based on 1Q 2013 frac sand capacity estimates per 2012 Proppant Market Report, KELRIK LLC and Proptester, Inc. (Hi-Crush capacity includes Sponsor) Tier One refers to Northern White Sand, specifically St. Peter, Jordan, Wonewoc, Mt. Simon and equivalent sandstones; excluding Canadian sources Excludes sand used for other industrial applications (e.g., glass and foundry sand).

Top 10 Producers Hold 92% of Tier-One Capacity 16 23% 15% 12% 9% 8% 7% 5% 5% 5% 3% 8% Company A Company B Company C Company D Hi-Crush Company E Company F Company G Company H Company I All other tier one Notes: Based on 1Q 2013 frac sand capacity estimates per 2012 Proppant Market Report, KELRIK LLC and Proptester, Inc. (Hi-Crush capacity includes Sponsor) Tier One refers to Northern White Sand, specifically St. Peter, Jordan, Wonewoc, Mt. Simon and equivalent sandstones; excluding Canadian sources Excludes sand used for other industrial applications (e.g., glass and foundry sand).

Delivering Results Improving Performance Selling More Sand Holding Costs Down EBITDA ($MM) Sand Sold (Tons) Production Costs/Ton ($/Ton) +59% -13% +41% Note: See non-GAAP reconciliations in the Appendix 17 $15.89 $13.91 FY 2012 FY 2013 $49.0 $69.2 FY 2012 FY 2013 1,165,818 1,849,075 FY 2012 FY 2013

Multiple Future Opportunities Contracting Wyeville capacity, spot sales Future contributions from Augusta and sponsor-level projects in development Sponsor owns or has options on additional acres of undeveloped land Industry ripe for consolidation of small, private sand companies Incremental Volume Contributions Organic Expansion M&A 18

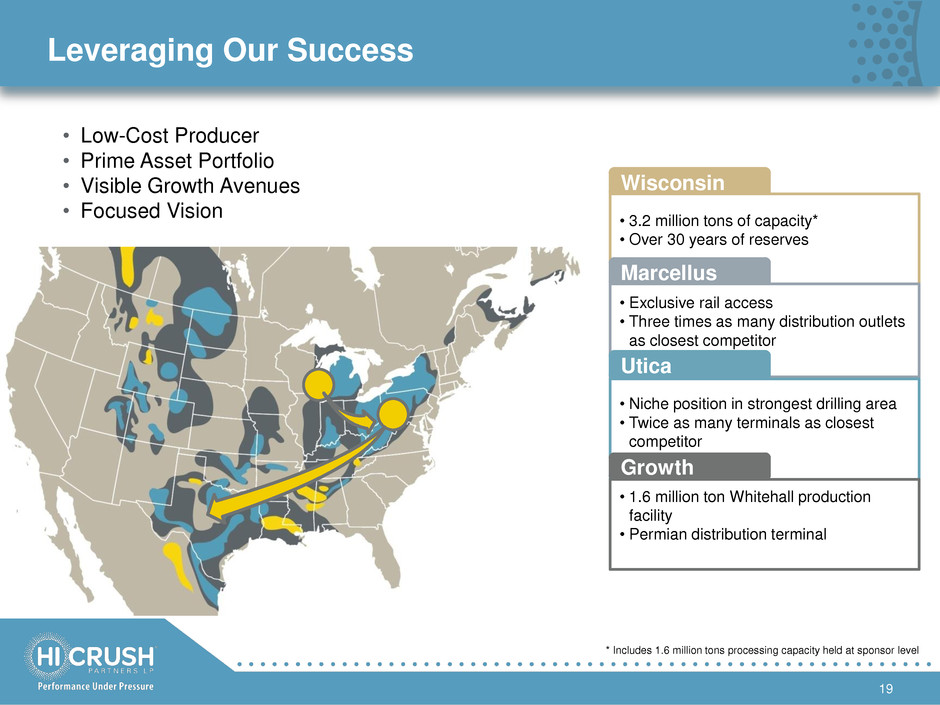
Leveraging Our Success • Low-Cost Producer • Prime Asset Portfolio • Visible Growth Avenues • Focused Vision Wisconsin • 3.2 million tons of capacity* • Over 30 years of reserves Marcellus • Exclusive rail access • Three times as many distribution outlets as closest competitor Utica • Niche position in strongest drilling area • Twice as many terminals as closest competitor Growth • 1.6 million ton Whitehall production facility • Permian distribution terminal 19 * Includes 1.6 million tons processing capacity held at sponsor level

Appendix

Fourth Quarter 2013 Summary Three Months Three Months Ended Ended December 31, 2013 December 31, 2012 Successor Successor Revenues $ 51,498 $ 16,215 Cost of goods sold (including depreciation, depletion and amortization) 31,214 4,313 Gross profit 20,284 11,902 Operating costs and expenses: General and administrative 4,609 2,203 Exploration expense 1 64 Accretion of asset retirement obligation 29 53 Income from operations 15,645 9,582 Other income (expense): Income from preferred interest in Hi-Crush Augusta LLC 3,750 - Other income - - Interest expense (1,337) (183) Net income $ 18,058 $ 9,399 Earnings per unit: Common units - basic and diluted $ 0.63 $ 0.35 Subordinated units - basic and diluted $ 0.63 $ 0.35 Weighted average limited partner units outstanding: Common units - basic and diluted 15,224,820 13,640,351 Subordinated units - basic and diluted 13,640,351 13,640,351 21

Full Year 2013 Summary 22 Period From Period From Year August 16 January 1 Ended Through Through Dec. 31, 2013 Dec. 31, 2012 Aug. 15, 2012 Successor Successor Predecessor Revenues $ 141,742 $ 28,858 $ 46,776 Cost of goods sold (including depreciation, depletion, and amort.) 74,539 7,145 13,336 Gross profit 67,203 21,713 33,440 Operating costs and expenses: General and administrative 16,205 2,795 4,631 Exploration expense 47 91 539 Accretion of asset retirement obligation 117 56 16 Income (loss) from operations 50,834 18,771 28,254 Other (income) expense: Income from preferred interest in Hi-Crush Augusta LLC (11,250) - - Other income - - (6) Interest expense 3,522 263 3,240 Net income $ 58,562 $ 18,508 $ 25,020 Earnings per unit: Common units - basic and diluted $ 2.08 $ 0.68 Subordinated units - basic and diluted $ 2.08 $ 0.68 Weighted average limited partner units outstanding: Common units - basic and diluted 14,527,914 13,640,351 Subordinated units - basic and diluted 13,640,351 13,640,351

Fourth Quarter 2013 Summary Three Months Three Months Ended Ended December 31, 2013 December 31, 2012 Successor Successor Reconciliation of EBITDA and Distributable Cash Flow to Net Income: Net income $ 18,058 $ 9,399 Depreciation and depletion 1,082 468 Amortization expense 1,662 - Interest expense 1,337 183 EBITDA $ 22,139 $ 10,050 Less: Cash interest paid (1,230) (93) Maintenance and replacement capital expenditures, including accrual for reserve replacement (1) (581) (335) Add: Accretion of asset retirement obligation 29 53 Distributable cash flow $ 20,357 $ 9,675 (1) Maintenance and replacement capital expenditures, including accrual for reserve replacement, were determined based on an estimated reserve replacement cost of $1.35 per ton sold during the period. Such expenditures include those associated with the replacement of equipment and sand reserves, to the extent that such expenditures are made to maintain our long-term operating capacity. The amount presented does not represent an actual reserve account or requirement to spend the capital. 23

Full Year 2013 Summary (1) Maintenance and replacement capital expenditures, including accrual for reserve replacement, were determined based on an estimated reserve replacement cost of $1.35 per ton sold during the period. Such expenditures include those associated with the replacement of equipment and sand reserves, to the extent that such expenditures are made to maintain our long-term operating capacity. The amount presented does not represent an actual reserve account or requirement to spend the capital. (2) The amount pertains to the fourth quarter performance of Augusta, on which we are entitled to receive a preferred distribution of $3,750. We have included this amount in our distributable cash flow for the year ended December 31, 2013 as we will receive this distribution on February 11, 2014, in advance of our fourth quarter 2013 cash distributions to our common and subordinated unitholders, which will be paid on February 14, 2014. The amount is not reflected in our GAAP net income during the year ended December 31, 2013 because our investment in Augusta is accounted for under the cost method. In accordance with that method, any distributions earned under our preferred interest are not recognized as income until the cash is actually received by the Partnership. 24 Period From Period From Year August 16 January 1 Ended Through Through December 31, 2013 December 31, 2012 August 15, 2012 Successor Successor Predecessor Reconciliation of EBITDA and Distributable Cash Flow to Net Income: Net income $ 58,562 $ 18,508 $ 25,020 Depreciation and depletion 3,399 863 1,089 Amortization expense 3,687 - - Interest expense, net 3,522 263 3,240 EBITDA $ 69,170 $ 19,634 $ 29,349 Less: Cash interest paid (2,974) (136) Maintenance and replacement capital expenditures, incl. accrual for reserve replacement (1) (2,028) (593) Add: Accretion of asset retirement obligation 117 56 Add: Quarterly distribution via investment in preferred interest in Augusta (2) 3,750 - Distributable Cash Flow $ 68,035 $ 18,961

Production Costs per Ton at Wyeville 25 Hi-Crush Partners LP Production Cost per Ton Fiscal Quarter 4Q 2011 1Q 2012 2Q 2012 3Q 2012 4Q 2012 1Q 2013 2Q 2013 3Q 2013 4Q 2013 Predecessor Successor Combined Tons produced and delivered 206,557 222,658 316,599 186,957 191,446 378,403 248,158 312,730 358,162 400,814 430,309 Production costs ($ in thousands) $ 3,806 $ 4,597 $ 5,006 $ 2,644 $ 2,437 $ 5,081 $ 3,845 $ 5,509 $ 4,758 $ 5,250 $ 5,381 Production costs per ton $ 18.43 $ 20.65 $ 15.81 $ 14.14 $ 12.73 $ 13.43 $ 15.49 $ 17.62 $ 13.28 $ 13.10 $ 12.50 12 months ended 3 months ended 6 months ended 9 months ended 12 months ended 12 months ended 12 months ended 12 months ended 12 months ended 12 months ended Trailing Twelve Months 12/31/2011 3/31/2012 6/30/2012 9/30/2012 9/30/2012 12/31/2012 3/31/2013 6/30/2013 9/30/2013 12/31/2013 Predecessor Successor Combined Tons produced and delivered 332,593 222,658 539,257 726,214 191,446 1,124,217 1,165,818 1,255,890 1,297,453 1,319,864 1,502,015 Production costs ($ in thousands) $ 5,998 $ 4,597 $ 9,603 $ 12,247 $ 2,437 $ 18,490 $ 18,529 $ 19,441 $ 19,193 $ 19,362 $ 20,898 Production costs per ton $ 18.03 $ 20.65 $ 17.81 $ 16.86 $ 12.73 $ 16.45 $ 15.89 $ 15.48 $ 14.79 $ 14.67 $ 13.91

Wyeville Production Costs – Non-GAAP Recon. 26 Hi-Crush Partners LP GAAP Reconciliation of Production Costs to Cost of Goods Sold Fiscal Quarter 4Q 2011 1Q 2012 2Q 2012 4Q 2012 1Q 2013 2Q 2013 3Q 2013 4Q 2013 (Amounts in thousands) Predecessor Successor Combined Cost of goods sold $ 3,949 $ 4,776 $ 5,495 $ 3,065 $ 2,832 $ 5,897 $ 4,313 $ 5,782 $ 11,585 $ 25,958 $ 33,189 Other cost of sales - - - - - - - - (5,742) (19,165) (24,907) Depreciation, depletion, and amortization (143) (179) (489) (421) (395) (816) (468) (273) (1,085) (1,543) (2,901) Production costs $ 3,806 $ 4,597 $ 5,006 $ 2,644 $ 2,437 $ 5,081 $ 3,845 $ 5,509 $ 4,758 $ 5,250 $ 5,381 3Q 2012
