Attached files
| file | filename |
|---|---|
| 8-K - FORM 8-K - ALLIANCE DATA SYSTEMS CORP | form_8k.htm |

©2013 ADS Alliance Data Systems, Inc. Confidential and Proprietary Earnings Release | February 6, 2014 * Alliance Data NYSE: ADS Fourth Quarter and Annual Results February 6, 2014 Exhibit 99.1

©2013 ADS Alliance Data Systems, Inc. Confidential and Proprietary Earnings Release | February 6, 2014 * Agenda Speakers: Ed Heffernan President and CEO Charles Horn EVP and CFO Fourth Quarter and 2013 Consolidated Results Segment Results Liquidity 2013 Wrap-up 2014 Outlook 2014 Updated Guidance
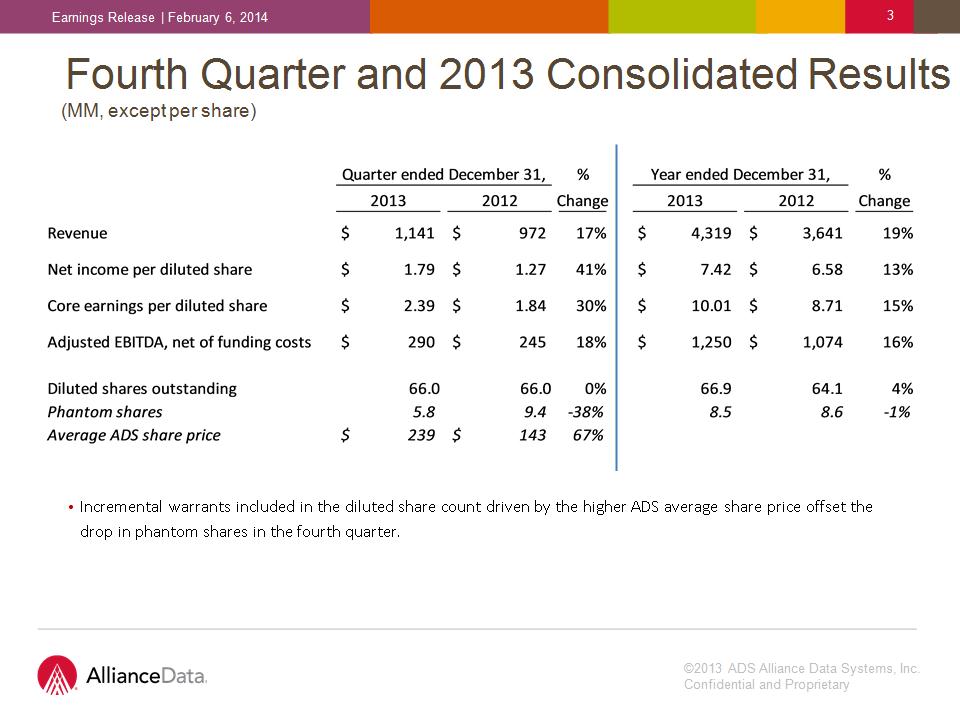
©2013 ADS Alliance Data Systems, Inc. Confidential and Proprietary Earnings Release | February 6, 2014 * Fourth Quarter and 2013 Consolidated Results (MM, except per share) Incremental warrants included in the diluted share count driven by the higher ADS average share price offset the drop in phantom shares in the fourth quarter.

©2013 ADS Alliance Data Systems, Inc. Confidential and Proprietary Earnings Release | February 6, 2014 * LoyaltyOne (MM) Adjusted EBITDA increased 19 percent for the fourth quarter, despite unfavorable FX rates. AIR MILES reward miles issued increased 12 percent in the fourth quarter. Breakage rate for 2014 dropping by 1 percent to a combined AIR MILES reward program rate of 25.6 percent. Lower operating expenses and higher redemption margins are expected to offset this negative impact.
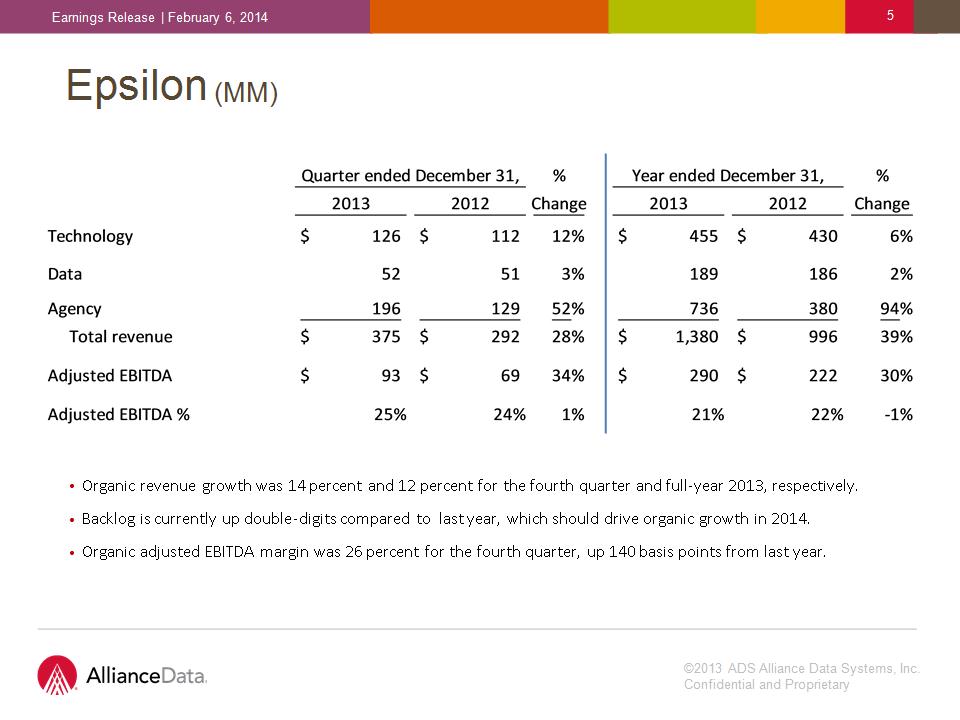
©2013 ADS Alliance Data Systems, Inc. Confidential and Proprietary Earnings Release | February 6, 2014 * Epsilon (MM) Organic revenue growth was 14 percent and 12 percent for the fourth quarter and full-year 2013, respectively. Backlog is currently up double-digits compared to last year, which should drive organic growth in 2014. Organic adjusted EBITDA margin was 26 percent for the fourth quarter, up 140 basis points from last year.

©2013 ADS Alliance Data Systems, Inc. Confidential and Proprietary Earnings Release | February 6, 2014 * Private Label Services and Credit (MM) Revenue increased 13 percent on a 14 percent increase in average card receivables for the fourth quarter. Provision expense increased 27 percent for the fourth quarter, despite steady principal loss rates, due to the significant seasonal increase in ending card receivables. Funding costs decreased to 1.6 percent of average receivables for the fourth quarter, a 20 basis points improvement from last year.

©2013 ADS Alliance Data Systems, Inc. Confidential and Proprietary Earnings Release | February 6, 2014 * Quarter ended December 31, Quarter ended December 31, Quarter ended December 31, Year ended December 31, Year ended December 31, Year ended December 31, 2013 2012 % Change 2013 2012 % Change Key metrics: Gross yield 26.2% 26.7% -0.5% 27.1% 27.7% -0.6% Credit sales $ 4,836 $ 4,161 +16% $ 15,252 $ 12,524 +22% Average credit card receivables $ 7,767 $ 6,800 +14% $ 7,213 $ 5,928 +22% Ending credit card receivables $ 8,635 $ 7,450 +16% $ 8,635 $ 7,450 +16% Principal loss rates 5.2% 4.7% +0.5% 4.7% 4.8% -0.1% Normalized principal charge-off rate 5.3% 5.2% +0.1% 4.8% 5.1% -0.3% Delinquency rate 4.2% 4.0% +0.2% 4.2% 4.0% +0.2% Private Label Services and Credit (MM) The decrease in gross yield is primarily due to the on-boarding of new programs. The yield for core programs was essentially flat compared to the fourth quarter of 2012. Normalized principal loss rates (adjusted for fair value accounting treatment of acquired portfolios) was up slightly in the fourth quarter, but down 30 basis points for 2013.
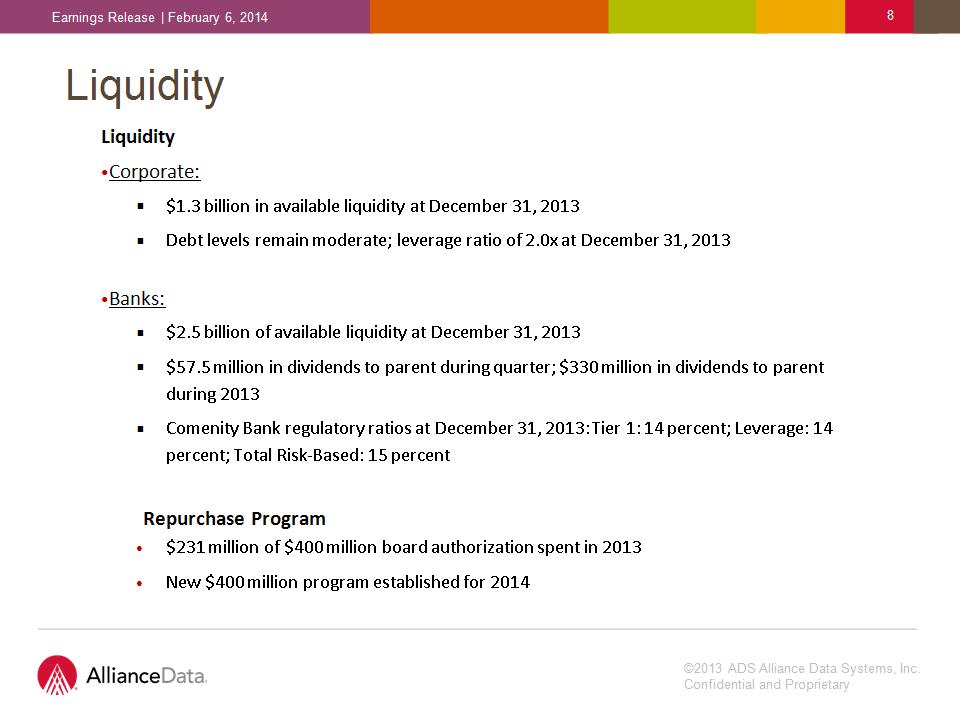
©2013 ADS Alliance Data Systems, Inc. Confidential and Proprietary Earnings Release | February 6, 2014 * Liquidity Liquidity Corporate: $1.3 billion in available liquidity at December 31, 2013 Debt levels remain moderate; leverage ratio of 2.0x at December 31, 2013 Banks: $2.5 billion of available liquidity at December 31, 2013 $57.5 million in dividends to parent during quarter; $330 million in dividends to parent during 2013 Comenity Bank regulatory ratios at December 31, 2013: Tier 1: 14 percent; Leverage: 14 percent; Total Risk-Based: 15 percent Repurchase Program $231 million of $400 million board authorization spent in 2013 New $400 million program established for 2014

©2013 ADS Alliance Data Systems, Inc. Confidential and Proprietary Earnings Release | February 6, 2014 * 2013 Wrap-up Consolidated: Strong organic and total revenue growth for 2013 Organic growth approximates 4 times Market & GDP growth rates Strong organic growth coupled with moderate M&A → mid-teens adjusted EBITDA and core EPS growth Modest net debt levels at year-end (leverage ratio <2.0x) Good visibility into 2014 Organic Total LoyaltyOne +3% +0% Epsilon +12% +39% Private Label +12% +17% +9% +19%
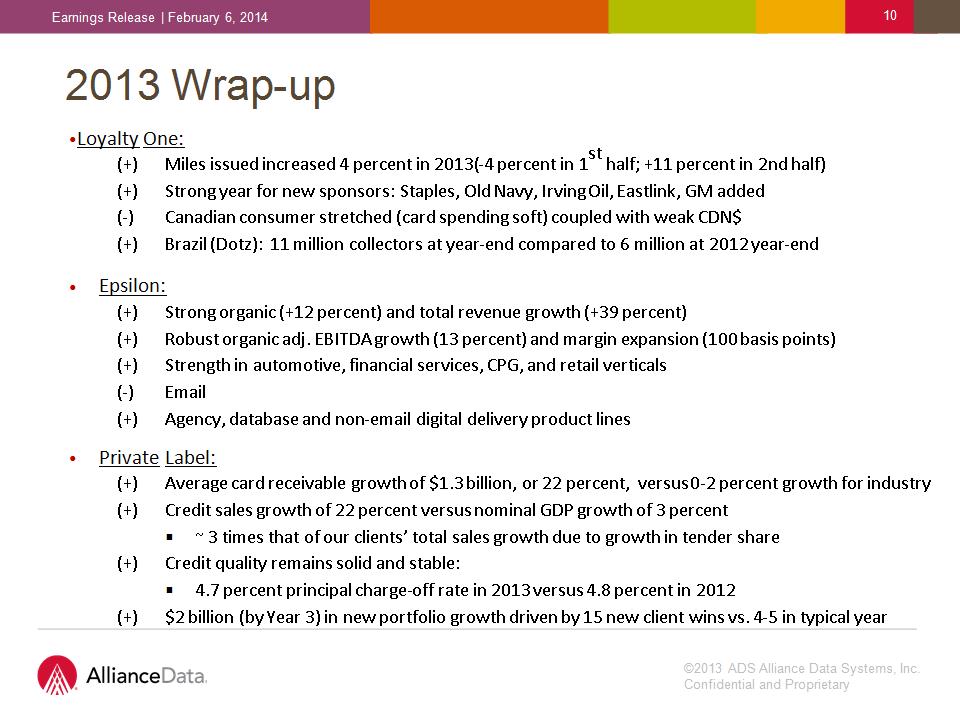
©2013 ADS Alliance Data Systems, Inc. Confidential and Proprietary Earnings Release | February 6, 2014 * 2013 Wrap-up Epsilon: (+) Strong organic (+12 percent) and total revenue growth (+39 percent) (+) Robust organic adj. EBITDA growth (13 percent) and margin expansion (100 basis points) (+) Strength in automotive, financial services, CPG, and retail verticals (-) Email (+) Agency, database and non-email digital delivery product lines Private Label: (+) Average card receivable growth of $1.3 billion, or 22 percent, versus 0–2 percent growth for industry (+) Credit sales growth of 22 percent versus nominal GDP growth of 3 percent ~ 3 times that of our clients’ total sales growth due to growth in tender share (+) Credit quality remains solid and stable: 4.7 percent principal charge-off rate in 2013 versus 4.8 percent in 2012 (+) $2 billion (by Year 3) in new portfolio growth driven by 15 new client wins vs. 4-5 in typical year Loyalty One: (+) Miles issued increased 4 percent in 2013(-4 percent in 1st half; +11 percent in 2nd half) (+) Strong year for new sponsors: Staples, Old Navy, Irving Oil, Eastlink, GM added (-) Canadian consumer stretched (card spending soft) coupled with weak CDN$ (+) Brazil (Dotz): 11 million collectors at year-end compared to 6 million at 2012 year-end

©2013 ADS Alliance Data Systems, Inc. Confidential and Proprietary Earnings Release | February 6, 2014 * 2014 2014 Initial Guidance Updated Guidance Increase Average ADS share price $225 $260 $35 Revenue $4,640 $5,140 +$500 Adjusted EBITDA $1,575 $1,600 +$25 Core Earnings $738 $766 +$31 Diluted shares outstanding 61.5 62.8 Core EPS $12.00 $12.20 +$0.20 2014 Updated Guidance ($MM, except per share) 2013 2013 2013 2014 2014 2014 2014 Q1 Q2 Q3 Q4 Q1 Q2 Q3 Q4 67.3 68.2 66.0 66.0 66.2 63.4 60.8 60.9 Diluted share count forecast (in millions)
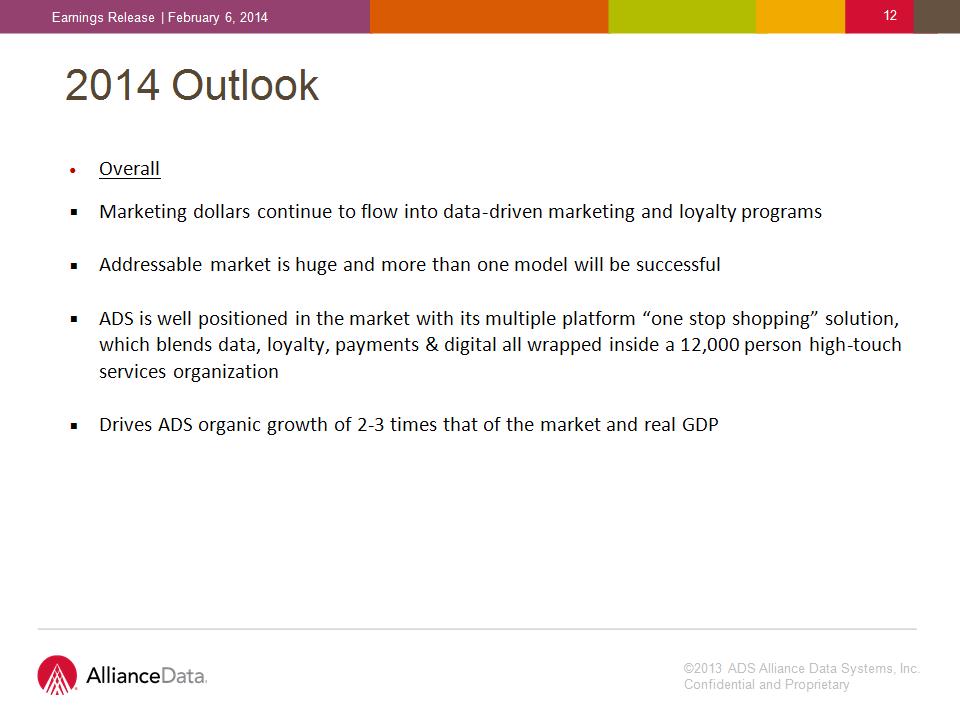
©2013 ADS Alliance Data Systems, Inc. Confidential and Proprietary Earnings Release | February 6, 2014 * Overall Marketing dollars continue to flow into data-driven marketing and loyalty programs Addressable market is huge and more than one model will be successful ADS is well positioned in the market with its multiple platform “one stop shopping” solution, which blends data, loyalty, payments & digital all wrapped inside a 12,000 person high-touch services organization Drives ADS organic growth of 2-3 times that of the market and real GDP 2014 Outlook

©2013 ADS Alliance Data Systems, Inc. Confidential and Proprietary Earnings Release | February 6, 2014 * 2014 Outlook Loyalty One: AIR MILES: flat revenue growth and low single-digits adjusted EBITDA growth - Dampened by very soft CDN$ and lower redemption rate - Somewhat weak economy as the Canadian consumer is stretched - Pharmacy – recent legislation impacting ability to offer rewards related to prescription drugs Brand Loyalty: acquisition adds approximately $500 million in revenue; double-digit organic growth Brazil: 13 million members projected by end of 2014 compared to 11 million at end of 2013 (+20 percent) Epsilon: High single-digit organic revenue growth Approximately 40 basis points improvement in adjusted EBITDA margin Strong 2013 signings and backlog provides good 2014 visibility New email platform (Harmony) rollout to address 2013 weak spot Private Label: Very robust pipeline: target new signings equal to $2 billion vintage Double-digit organic revenue growth Principal loss rates similar to 2013 1st quarter slightly over 5 percent; remainder of year below 5 percent
©2013 ADS Alliance Data Systems, Inc. Confidential and Proprietary Earnings Release | February 6, 2014 * Q & A
©2013 ADS Alliance Data Systems, Inc. Confidential and Proprietary Earnings Release | February 6, 2014 * Safe Harbor Statement and Forward-Looking Statements This presentation may contain forward-looking statements within the meaning of Section 27A of the Securities Act of 1933, as amended, and Section 21E of the Securities Exchange Act of 1934, as amended. Such statements may use words such as “anticipate,” “believe,” “continue,” “could,” “estimate,” “expect,” “intend,” “may,” “predict,” “project,” “would” and similar expressions as they relate to us or our management. When we make forward-looking statements, we are basing them on our management’s beliefs and assumptions, using information currently available to us. Although we believe that the expectations reflected in the forward-looking statements are reasonable, these forward-looking statements are subject to risks, uncertainties and assumptions, including those discussed in our filings with the Securities and Exchange Commission. If one or more of these or other risks or uncertainties materialize, or if our underlying assumptions prove to be incorrect, actual results may vary materially from what we projected. Any forward-looking statements contained in this presentation reflect our current views with respect to future events and are subject to these and other risks, uncertainties and assumptions relating to our operations, results of operations, growth strategy and liquidity. We have no intention, and disclaim any obligation, to update or revise any forward-looking statements, whether as a result of new information, future results or otherwise, except as required by law. “Safe Harbor” Statement under the Private Securities Litigation Reform Act of 1995: Statements in this presentation regarding Alliance Data Systems Corporation’s business which are not historical facts are “forward-looking statements” that involve risks and uncertainties. For a discussion of such risks and uncertainties, which could cause actual results to differ from those contained in the forward-looking statements, see “Risk Factors” in the Company’s Annual Report on Form 10-K for the most recently ended fiscal year. Risk factors may be updated in Item 1A in each of the Company’s Quarterly Reports on Form 10-Q for each quarterly period subsequent to the Company’s most recent Form 10-K.

©2013 ADS Alliance Data Systems, Inc. Confidential and Proprietary Earnings Release | February 6, 2014 * Financial Measures In addition to the results presented in accordance with generally accepted accounting principles, or GAAP, the Company presents financial measures that are non-GAAP measures, such as constant currency financial measures, adjusted EBITDA, adjusted EBITDA margin, adjusted EBITDA net of funding costs, core earnings and core earnings per diluted share (core EPS). The Company believes that these non-GAAP financial measures, viewed in addition to and not in lieu of the Company’s reported GAAP results, provide useful information to investors regarding the Company’s performance and overall results of operations. These metrics are an integral part of the Company’s internal reporting to measure the performance of reportable segments and the overall effectiveness of senior management. Reconciliations to comparable GAAP financial measures are available on the Company’s website. The financial measures presented are consistent with the Company’s historical financial reporting practices. Core earnings and core earnings per diluted share represent performance measures and are not intended to represent liquidity measures. The non-GAAP financial measures presented herein may not be comparable to similarly titled measures presented by other companies, and are not identical to corresponding measures used in other various agreements or public filings.