Attached files
| file | filename |
|---|---|
| 8-K - 8-K - PACWEST BANCORP | a14-5099_18k.htm |
Exhibit 99.1
|
|
FIG PARTNERS’ WEST COAST BANK CEO FORUM San Francisco, California February 6, 2014 |

|
|
FORWARD-LOOKING STATEMENTS This communication contains certain forward-looking information about PacWest, CapitalSource, and the combined company after the close of the transaction that is intended to be covered by the safe harbor for “forward-looking statements” provided by the Private Securities Litigation Reform Act of 1995. All references herein to PacWest are intended to refer to PacWest and its predecessor First Community Bancorp. All statements other than statements of historical fact are forward-looking statements. Such statements involve inherent risks and uncertainties, many of which are difficult to predict and are generally beyond the control of PacWest, CapitalSource and the combined company. Forward-looking statements speak only as of the date they are made and we assume no duty to update such statements. We caution readers that a number of important factors could cause actual results to differ materially from those expressed in, or implied or projected by, such forward-looking statements. In addition to factors previously disclosed in reports filed by PacWest and CapitalSource with the SEC, risks and uncertainties for each institution and the combined institution include, but are not limited to: lower than expected revenues; credit quality deterioration or a reduction in real estate values could cause an increase in the allowance for credit losses and a reduction in net earnings; increased competitive pressure among depository institutions; the ability to complete the proposed transaction, including obtaining regulatory approvals and approval by the stockholders of PacWest and CapitalSource, or any future transaction, successfully integrate such acquired entities, or achieve expected beneficial synergies and/or operating efficiencies, in each case within expected time-frames or at all; regulatory approvals may not be received on expected timeframes or at all; settlements with the FDIC related to loss-sharing arrangements; the possibility that personnel changes will not proceed as planned; the possibility that the cost of additional capital may be more than expected; the possibility that a change in the interest rate environment may reduce net interest margins; asset/liability re-pricing risks and liquidity risks; pending legal matters may take longer or cost more to resolve or may be resolved adversely; general economic conditions, either nationally or in the market areas in which the entities operate or anticipate doing business, are less favorable than expected; and environmental conditions, including natural disasters, may disrupt business, impede operations, or negatively impact the values of collateral securing loans. For a more complete discussion of risks and uncertainties, investors and security holders are urged to read PacWest’s and CapitalSource’s respective reports filed with or furnished to the SEC. Pro forma, projected and estimated numbers are used for illustrative purposes only and are not forecasts, and actual results may differ materially. February 6, 2014 2 |

|
|
PACWEST BANCORP NASDAQ Symbol Fully Diluted Shares Market Capitalization Average Volume Dividends Per Share (Annualized) Analyst Coverage PACW 45.823 Million* $1.7 Billion** 497,000 shares per day ** $1.00 per year (2.50%** yield) D.A. Davidson & Co. Evercore Partners FIG Partners Friedman Billings Ramsey Keefe, Bruyette & Woods RBC Capital Markets Sandler O’Neill + Partners Sterne Agee & Leach, Inc. Wunderlich Securities February 6, 2014 Stock Summary * Common and unvested restricted shares less treasury shares as of 12/31/2013 ** As of 2/3/2014 3 |

|
|
PACWEST BANCORP February 6, 2014 Presentation Index Overview 5 Operating Principles 6 4Q13 Review Highlights 7 Credit. 9 FDIC Loss Sharing17 NIM, Loan Yields, Investments and DDAs19 Expense Control25 Performance Charts.26 Strong Franchise Value28 California Public Banks and Thrifts30 Acquisition Activity32 First California Financial Group (FCAL)33 CapitalSource, Inc. (CSE)34 Non-GAAP Measurements41 4 |

|
|
PACW OVERVIEW $6.5 Billion in Assets at December 31, 2013 73 Full-Service Offices: 70 in Southern California and 3 in the Bay Area February 6, 2014 Commercial Banking Focus in Southern California Source: Company Filings *See “Non-GAAP Measurements” slide Strong Capital Levels* Proven Operating Model Generates Earnings For the Fourth Quarter of 2013 NIM 5.41% Loan Yield 6.77% All-in Deposit Cost 0.11% Adjusted Efficiency Ratio 56.7%* Adjusted Earnings From Continuing Operations Before Income Taxes $38.2 Million* Strong Credit Quality at December 31, 2013 Non-Purchased Credit Impaired NPA Ratio 2.48% Credit Loss Allowance to Non-Purchased Credit Impaired (Non-PCI) Loans and Leases 1.73% Credit Loss Allowance to Non-Purchased Credit Impaired (Non-PCI) Nonaccruals 145% Low Risk Profile Experienced Acquirer 26 Bank and Finance Company Acquisitions, Including 3 FDIC-Assisted Deals 5 as of 12/31/13 Equity ($ millions) Equity/Assets Per Share Company - Tangible* $583.1 9.24% $12.73 Company - GAAP $809.1 12.38% $17.66 Bank - Tangible* $685.2 10.88% n/a Bank - GAAP $911.2 13.97% n/a |

|
|
PACW Manage for Profitability, Not Growth Strategic Focus on Low-Cost Deposits Strong Expense Management Focus on Credit Quality Results Include: Strong Net Interest Margin Controlled Operating Expenses Sustained Profitability February 6, 2014 Operating Principles 6 |

|
|
HIGHLIGHTS Focus is on profitable loan portfolio growth Organic loan originations up 10% to $214 million; Asset Financing originations up 34% to $69 million Core loan yield at 6.64%; reported yield at 6.77% February 6, 2014 4th Quarter 2013 Credit loss reserve coverage ratios on non-purchased credit impaired loans are strong ACL to non-PCI loans: 1.73% ACL to non-PCI nonaccruals: 145% Net earnings of $3.1 million, or $0.06 per share Adjusted earnings * $38.2 million from continuing operations before income taxes $24.1 million after taxes at 37% ($0.53 per share) Tangible capital * at $583.1 million, or $12.73 per share DDAs to total deposits: 44% Core deposits to total deposits: 88% * See “Non-GAAP Measurements” slide. 7 |

|
|
HIGHLIGHTS February 6, 2014 Solid Earnings Track Record * See “Non-GAAP Measurements” slide. 8 |

|
|
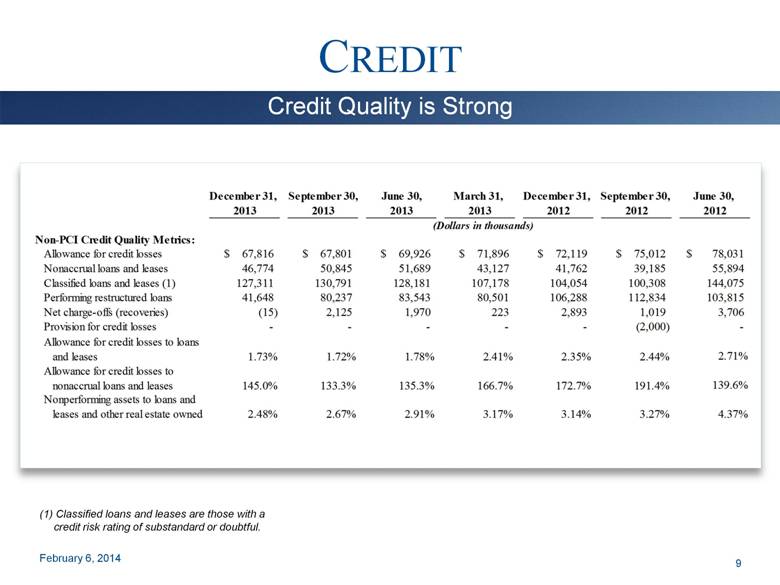
CREDIT February 6, 2014 Credit Quality is Strong (1) Classified loans and leases are those with a credit risk rating of substandard or doubtful. 9 December 31, September 30, June 30, March 31, December 31, September 30, June 30, 2013 2013 2013 2013 2012 2012 2012 (Dollars in thousands) Non-PCI Credit Quality Metrics: Allowance for credit losses 67,816 $ 67,801 $ 69,926 $ 71,896 $ 72,119 $ 75,012 $ 78,031 $ Nonaccrual loans and leases 46,774 50,845 51,689 43,127 41,762 39,185 55,894 Classified loans and leases (1) 127,311 130,791 128,181 107,178 104,054 100,308 144,075 Performing restructured loans 41,648 80,237 83,543 80,501 106,288 112,834 103,815 Net charge-offs (recoveries) (15) 2,125 1,970 223 2,893 1,019 3,706 Provision for credit losses - - - - - (2,000) - Allowance for credit losses to loans and leases 1.73% 1.72% 1.78% 2.41% 2.35% 2.44% 2.71% Allowance for credit losses to nonaccrual loans and leases 145.0% 133.3% 135.3% 166.7% 172.7% 191.4% 139.6% Nonperforming assets to loans and leases and other real estate owned 2.48% 2.67% 2.91% 3.17% 3.14% 3.27% 4.37% |
|
|
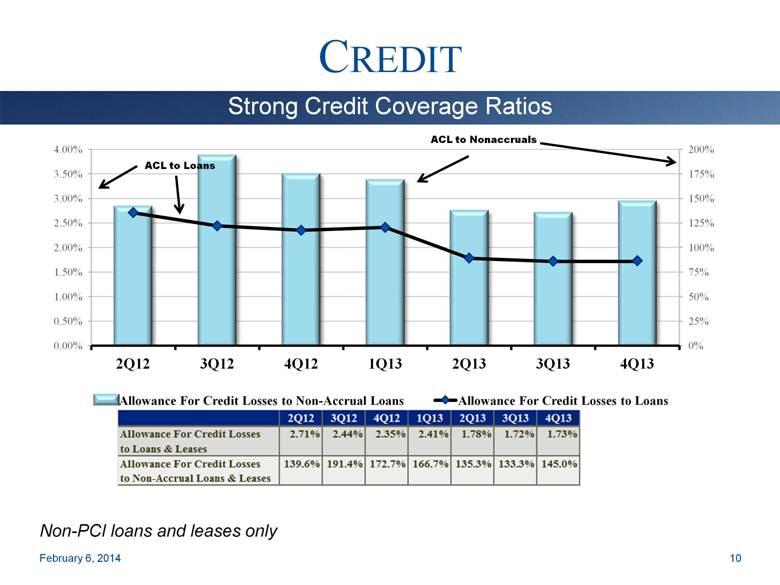
CREDIT February 6, 2014 Strong Credit Coverage Ratios Non-PCI loans and leases only ACL to Loans 10 |
|
|
CREDIT February 6, 2014 Largest Non-PCI Nonaccrual Loans 11 (In thousands) For Info Only - not for Print 6,723 $ Two loans, each secured by a hotel in San Diego County. The borrower is paying according to the restructured terms of each loan. (1) 5,444 Three loans to a contractor, one of which is secured by equipment, one of which is secured by an industrial building in San Diego County, and one of which is unsecured. The borrower is paying according to the restructured terms of each loan. 3,105 Two loans that are both unsecured. The borrower is paying according to the restructured terms of each loan. 2,074 Three loans, one of which is secured by an office building in Ventura County; the other two loans are unsecured. The borrower is paying according to the restructured terms of each loan. 1,844 Two loans, one of which is secured by an office building in Clark County, Nevada, and the other of which is secured by an office building in Maricopa County, Arizona. The Bank is in the process of foreclosing on both properties. 1,494 Loan secured by industrial zoned land in Ventura County. 1,256 Loan secured by a strip retail center in Clark County, Nevada. The borrower is paying according to the restructured terms of each loan. 1,126 Loan secured by an industrial building in San Bernardino County. The borrower is paying according to the restructured terms of the loan. 1,094 Two loans, one of which is secured by an apartment building in San Diego County; and one of which is secured by an office building in San Diego County. The loans are paying according to the restructured terms of each loan. 1,070 Asset-based loan to a clothing manufacturer secured by accounts receivable and inventory. Loan is in the process of liquidation. 25,230 $ Total (1) New nonaccrual in fourth quarter of 2013. At December 31, 2013 |

|
|
CREDIT February 6, 2014 Non-Covered Loan Charge-Off History Source: Company Filings 12 1Q11 2Q11 3Q11 4Q11 1Q12 2Q12 3Q12 4Q12 1Q13 2Q13 3Q13 4Q13 1.03% 0.97% 0.83% 0.39% 0.29% 0.52% 0.14% 0.38% 0.03% 0.24% 0.22% 0.00% Annualized Net Chargeoffs to Average Loans |

|
|
CREDIT February 6, 2014 Loan Portfolio Concentrations Excludes leases in process of $12.6 million. 13 December 31, 2013 Non-Covered Loans Total Loans and Leases Covered Loans and Leases Rounding %'s % of % of % of Amount Total Amount Total Amount Total (Dollars in thousands) Real estate mortgage: Hospitality 179,340 $ 5% 2,395 $ 1% 181,735 $ 4% SBA 504 45,166 1% - - 45,166 1% Other 2,153,519 56% 415,578 92% 2,569,097 60% Total real estate mortgage 2,378,025 62% 417,973 93% 2,795,998 65% Real estate construction: Residential 58,881 1% 17 - 58,898 1% Commercial 142,842 4% 17,777 4% 160,619 4% Total real estate construction 201,723 5% 17,794 4% 219,517 5% Total real estate loans 2,579,748 67% 435,767 97% 3,015,515 70% Commercial: Collateralized 581,097 15% 6,934 1% 588,031 13% Unsecured 150,985 4% 2,895 1% 153,880 4% Asset-based 202,428 5% - - 202,428 5% SBA 7(a) 28,642 1% - - 28,642 1% Total commercial 963,152 25% 9,829 2% 972,981 23% Leases (1) 269,769 7% - - 269,769 6% Consumer 52,248 1% 2,822 1% 55,070 1% Total gross loans and leases 3,864,917 $ 100% 448,418 $ 100% 4,313,335 $ 100% |

|
|
CREDIT February 6, 2014 Non-Covered Real Estate Mortgage Exposure 14 December 31, 2013 September 30, 2013 % of % of Loan Category Amount Total Amount Total (Dollars in thousands) Commercial real estate mortgage: Industrial/warehouse $ 336,648 14% $ 345,661 14% Retail 281,739 12% 278,071 11% Office buildings 392,921 16% 408,961 17% Owner-occupied 218,786 9% 228,849 9% Hotel 179,340 8% 186,844 7% Healthcare 180,957 8% 177,361 7% Mixed use 63,218 3% 63,744 3% Gas station 31,421 1% 30,015 1% Self storage 47,762 2% 48,177 2% Restaurant 20,617 1% 21,285 1% Land acquisition/development 4,420 - 13,558 1% Unimproved land 12,043 1% 12,157 - Other 167,356 7% 198,450 8% Total commercial real estate mortgage 1,937,228 82% 2,013,133 81% Residential real estate mortgage: Multi-family 211,360 9% 245,435 10% Single family owner-occupied 149,917 6% 154,008 6% Single family nonowner-occupied 16,084 1% 15,449 1% HELOCs 53,206 2% 55,800 2% Mixed use 10,230 - 10,283 - Total residential real estate mortgage 440,797 18% 480,975 19% Total gross non-covered real estate mortgage loans $ 2,378,025 100% $ 2,494,108 100% |

|
|
CREDIT February 6, 2014 Covered Real Estate Loan Exposure 15 December 31, 2013 September 30, 2013 % of % of Loan Category Amount Total Amount Total (Dollars in thousands) Commercial real estate mortgage: Industrial/warehouse $ 17,697 4% $ 30,201 6% Retail 64,631 16% 74,968 16% Office buildings 42,040 10% 42,822 9% Owner-occupied 14,409 3% 15,238 3% Hotel 2,395 1% 2,430 1% Healthcare 8,780 2% 8,760 2% Mixed use 5,748 1% 6,564 1% Gas station 3,803 1% 3,824 1% Self storage 25,998 6% 27,146 6% Restaurant 893 - 910 - Unimproved land 474 - 449 - Other 7,424 2% 16,271 3% Total commercial real estate mortgage 194,292 46% 229,583 48% Residential real estate mortgage: Multi-family 118,869 29% 137,862 29% Single family owner-occupied 62,591 15% 66,432 14% Single family nonowner-occupied 17,657 4% 17,889 4% HELOCs 24,093 6% 25,029 5% Mixed use 471 - 478 - Total residential real estate mortgage 223,681 54% 247,690 52% Total gross covered real estate mortgage loans $ 417,973 100% $ 477,273 100% |

|
|
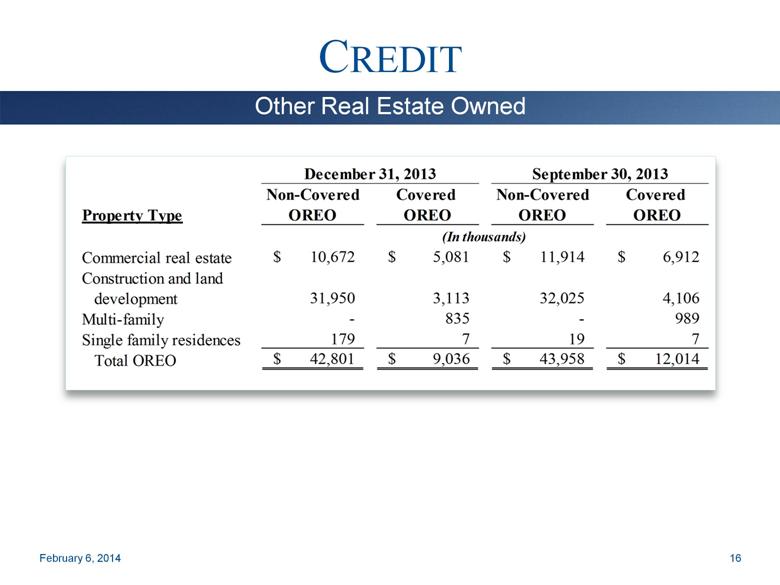
CREDIT February 6, 2014 Other Real Estate Owned 16 December 31, 2013 September 30, 2013 Non-Covered Covered Non-Covered Covered Property Type OREO OREO OREO OREO (In thousands) Commercial real estate 10,672 $ 5,081 $ 11,914 $ 6,912 $ Construction and land development 31,950 3,113 32,025 4,106 Multi-family - 835 - 989 Single family residences 179 7 19 7 Total OREO 42,801 $ 9,036 $ 43,958 $ 12,014 $ |
|
|
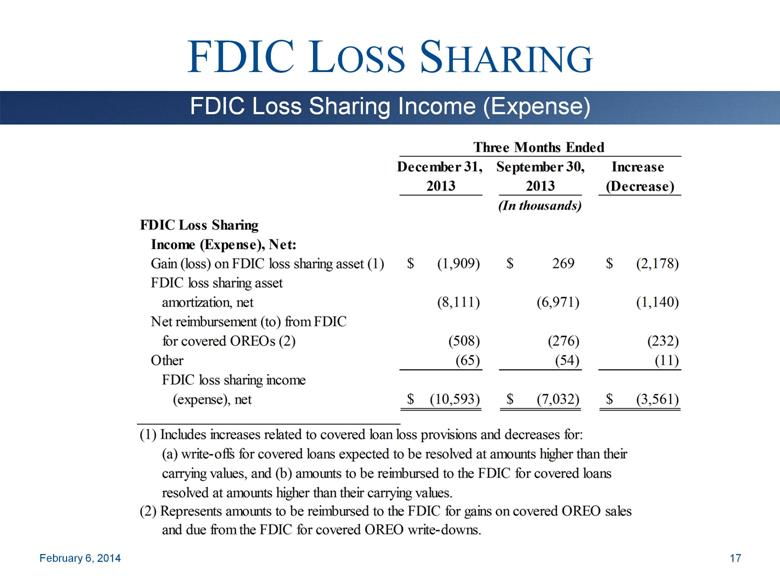
FDIC LOSS SHARING February 6, 2014 FDIC Loss Sharing Income (Expense) 17 Three Months Ended December 31, September 30, Increase 2013 2013 (Decrease) (In thousands) FDIC Loss Sharing Income (Expense), Net: Gain (loss) on FDIC loss sharing asset (1) (1,909) $ 269 $ (2,178) $ FDIC loss sharing asset amortization, net (8,111) (6,971) (1,140) Net reimbursement (to) from FDIC for covered OREOs (2) (508) (276) (232) Other (65) (54) (11) FDIC loss sharing income (expense), net (10,593) $ (7,032) $ (3,561) $ (1) Includes increases related to covered loan loss provisions and decreases for: (a) write-offs for covered loans expected to be resolved at amounts higher than their carrying values, and (b) amounts to be reimbursed to the FDIC for covered loans resolved at amounts higher than their carrying values. (2) Represents amounts to be reimbursed to the FDIC for gains on covered OREO sales and due from the FDIC for covered OREO write-downs. |
|
|
FDIC LOSS SHARING February 6, 2014 18 Loss Share Assets by Entity December 31, 2013 Western San Luis Affinity Los Padres Commercial Trust Bank Bank Bank Bank Total (Dollars in thousands) FDIC loss sharing asset 9,732 $ 22,962 $ 1,709 $ 11,121 $ 45,524 $ True-Up liability N/A N/A 1,522 $ 5,125 $ 6,647 $ Non-single family covered assets (1) 199,686 $ 133,201 $ 16,309 $ 44,859 $ 394,055 $ Single family covered assets 14,197 $ 74,367 $ - $ 37,997 $ 126,561 $ Loss sharing expiration dates: Non-single family 3rd Quarter 3rd Quarter 4th Quarter 1st Quarter 2014 2015 2015 2016 Single family 3rd Quarter 3rd Quarter N/A 1st Quarter 2019 2020 2021 Loss recovery expiration dates: Non-single family 3rd Quarter 3rd Quarter 4th Quarter 1st Quarter 2017 2018 2018 2019 Single family 3rd Quarter 3rd Quarter N/A 1st Quarter 2019 2020 2021 (1) Excludes securities. |

|
|
NET INTEREST MARGIN February 6, 2014 Strong Net Interest Margin Versus Peers Source: Company Filings and SNL Data Source Peers: NYSE, AMEX, NASDAQ Banks with $5B to $10B in assets as of period end 19 6.67% 6.34% 5.30% 4.79% 5.02% 5.26% 5.52% 5.41% 3.77% 3.60% 3.74% 3.71% 3.87% 3.86% 3.76% 3.64% 2006 2007 2008 2009 2010 2011 2012 4Q13 PACW Peers |

|
|
STRONG CORE NIM February 6, 2014 Volatile Items Impact the NIM 20 Year Three Months Ended Ended December 31, September 30, December 31, Items Impacting NIM Volatility 2013 2013 2013 Increase (Decrease) in NIM Accelerated accretion of acquisition discounts resulting from covered loan payoffs 0.10% 0.14% 0.08% Nonaccrual loan interest - 0.02% 0.01% Unearned income on the early repayment of leases 0.01% 0.02% 0.02% Celtic loan portfolio premium amortization (0.01)% (0.01)% (0.01)% Total 0.10% 0.17% 0.10% Reported NIM 5.41% 5.46% 5.37% Core NIM 5.31% 5.29% 5.27% |

|
|
LOAN AND LEASE YIELDS February 6, 2014 21 Reported and Core Year Three Months Ended Ended December 31, September 30, December 31, 2013 2013 2013 (Dollars in thousands) Yields: Non-PCI loans and leases 6.14% 6.35% 6.38% PCI loans 13.15% 11.88% 10.63% Total loans and leases 6.77% 6.90% 6.86% Items Impacting Loan and Lease Yield Volatility Increase (Decrease) in Loan Yield Accelerated accretion of acquisition discounts resulting from PCI loan payoffs 0.13% 0.19% 0.12% Nonaccrual loan interest - 0.03% 0.01% Unearned income on early repayment of leases 0.01% 0.03% 0.03% Celtic loan portfolio premium amortization (0.01)% (0.02)% (0.02)% Total 0.13% 0.23% 0.14% Reported Yield 6.77% 6.90% 6.86% Core Yield 6.64% 6.67% 6.72% |

|
|
INVESTMENT YIELDS AND DURATIONS February 6, 2014 22 Carrying Tax Equivalent Duration Value Yield for Month at at of December 12/31/13 Security Type 12/31/13 2013 (in years) (In thousands) Residential mortgage-backed securities: Government agency and government- sponsored enterprise pass through securities 707,188 $ 2.15% 3.7 Government agency and government- sponsored enterprise collateralized mortgage obligations 192,873 2.39% 5.1 Covered private label collateralized mortgage obligations 37,904 9.09% 2.9 Municipal securities 436,658 4.46% 6.2 Corporate debt securities 82,707 2.61% 2.6 Government-sponsored enterprise debt securities 9,872 2.51% 6.3 Other securities 27,543 0.99% 4.4 Total securities available-for-sale 1,494,745 $ 2.97% 4.5 |

|
|
MUNICIPAL BOND PORTFOLIO February 6, 2014 23 December 31, 2013 Carrying % of Value Total (In thousands) Municipal Securities by State: Texas 84,142 $ 19% Washington 41,443 10% New York 31,859 7% Colorado 25,090 6% Illinois 23,927 6% Ohio 22,021 5% California 19,455 5% Hawaii 15,005 3% Florida 14,987 3% Massachusetts 14,877 3% Total of 10 largest states 292,806 67% All other states 143,852 33% Total municipal securities 436,658 $ 100% |

|
|
NONINTEREST-BEARING DEPOSITS SUPPORT NIM February 6, 2014 Noninterest-Bearing Deposits to Total Deposits * 2004 excludes a $365.0 million short-term interest bearing deposit received on December 31, 2004 Source: Company Filings and SNL Data Source 24 35% 38% 42% 46% 49% 43% 37% 34% 32% 32% 37% 41% 44% 22% 23% 24% 24% 23% 22% 22% 22% 23% 23% 25% 30% 32% 2001 2002 2003 2004* 2005 2006 2007 2008 2009 2010 2011 2012 4Q13 PACW CA Peers |

|
|
Efficiency Ratios Average Branch Size ($-M) EXPENSE CONTROL February 6, 2014 Focus and Execution Drive Efficiency * The 2008 efficiency ratio excludes the goodwill write-off. When the goodwill write-off is included in non-interest expense, the efficiency ratio is 371.7%. ** Adjusted efficiency ratio – see Non-GAAP Measurements slide Source: Company Filings and SNL Data Source 25 Efficiency Ratios Average Branch Size ($ - M) |

|
|
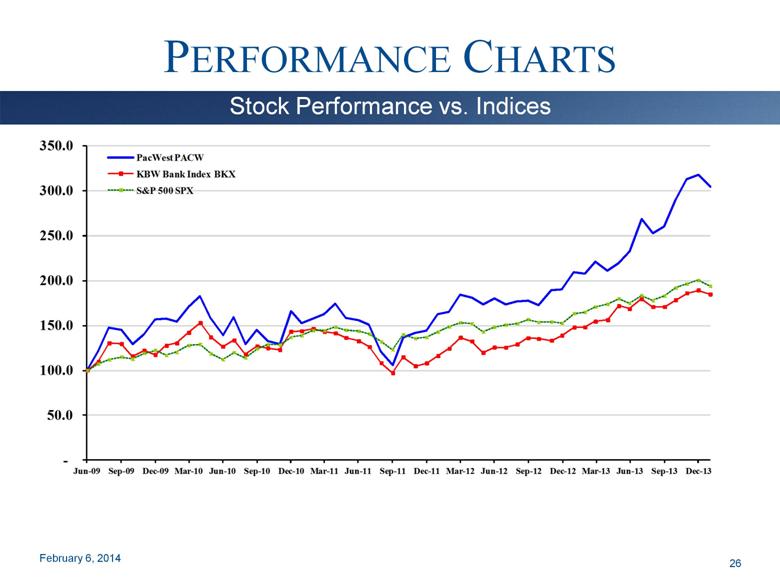
PERFORMANCE CHARTS February 6, 2014 Stock Performance vs. Indices 26 - 50.0 100.0 150.0 200.0 250.0 300.0 350.0 Jun - 09 Sep - 09 Dec - 09 Mar - 10 Jun - 10 Sep - 10 Dec - 10 Mar - 11 Jun - 11 Sep - 11 Dec - 11 Mar - 12 Jun - 12 Sep - 12 Dec - 12 Mar - 13 Jun - 13 Sep - 13 Dec - 13 PacWest PACW KBW Bank Index BKX S&P 500 SPX |
|
|
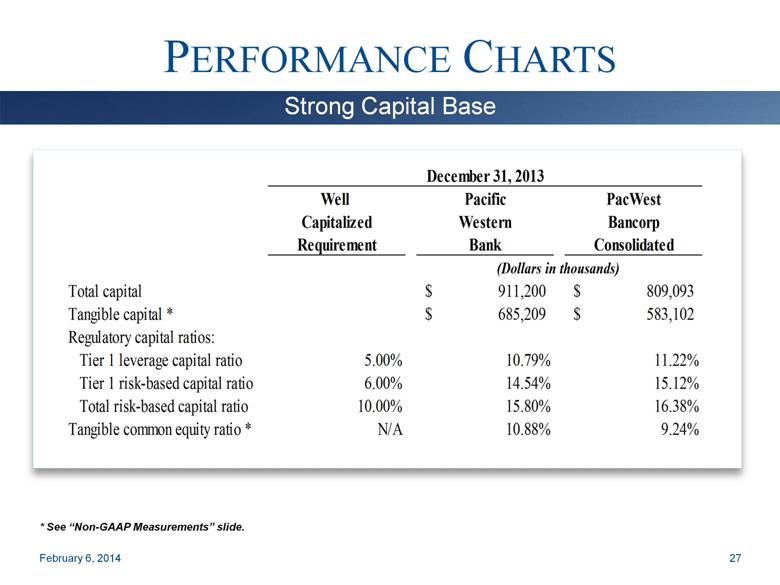
PERFORMANCE CHARTS February 6, 2014 Strong Capital Base * See “Non-GAAP Measurements” slide. 27 December 31, 2013 Well Pacific PacWest Capitalized Western Bancorp Requirement Bank Consolidated (Dollars in thousands) Total capital 911,200 $ 809,093 $ Tangible capital * 685,209 $ 583,102 $ Regulatory capital ratios: Tier 1 leverage capital ratio 5.00% 10.79% 11.22% Tier 1 risk-based capital ratio 6.00% 14.54% 15.12% Total risk-based capital ratio 10.00% 15.80% 16.38% Tangible common equity ratio * N/A 10.88% 9.24% |
|
|
STRONG FRANCHISE VALUE 8th Largest Publicly-Owned CA Bank* 13th Largest Commercial Bank in California out of 210 Financial Institutions at September 30, 2013** California Footprint from the Central Coast to throughout Southern California 73 Branches: 70 in Southern California and 3 in the Bay Area February 6, 2014 Key Points * Source: SNL Data Source, using latest data available ** Source: FDIC as of 9/30/13, the latest data available Strong Capital Base Low Cost of Deposits High Net Interest Margin Sustained Profitability Solid Credit Quality 28 |

|
|
STRONG FRANCHISE VALUE February 6, 2014 Attractive Southern California Footprint 29 |

|
|
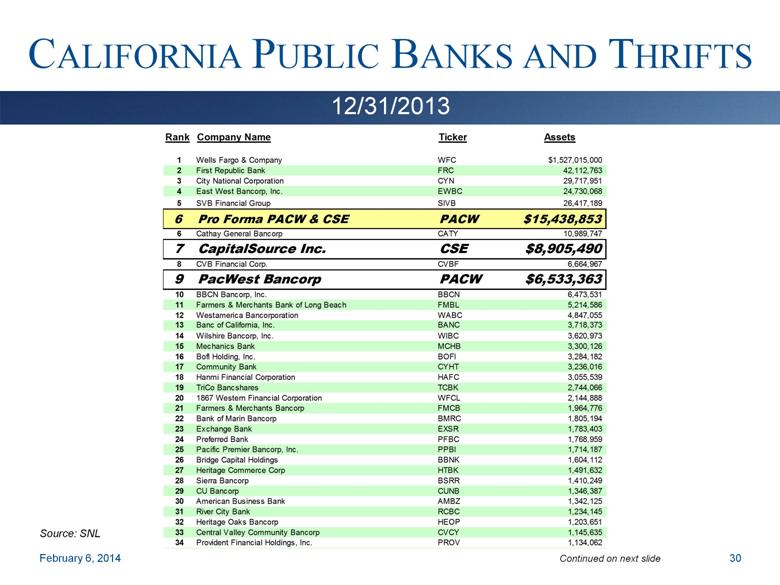
CALIFORNIA PUBLIC BANKS AND THRIFTS February 6, 2014 12/31/2013 Source: SNL Continued on next slide 30 Rank Company Name Ticker Assets 1 Wells Fargo & Company WFC $1,527,015,000 2 First Republic Bank FRC 42,112,763 3 City National Corporation CYN 29,717,951 4 East West Bancorp, Inc. EWBC 24,730,068 5 SVB Financial Group SIVB 26,417,189 6 Pro Forma PACW & CSE PACW $15,438,853 6 Cathay General Bancorp CATY 10,989,747 7 CapitalSource Inc. CSE $8,905,490 8 CVB Financial Corp. CVBF 6,664,967 9 PacWest Bancorp PACW $6,533,363 10 BBCN Bancorp, Inc. BBCN 6,473,531 11 Farmers & Merchants Bank of Long Beach FMBL 5,214,586 12 Westamerica Bancorporation WABC 4,847,055 13 Banc of California, Inc. BANC 3,718,373 14 Wilshire Bancorp, Inc. WIBC 3,620,973 15 Mechanics Bank MCHB 3,300,126 16 BofI Holding, Inc. BOFI 3,284,182 17 Community Bank CYHT 3,236,016 18 Hanmi Financial Corporation HAFC 3,055,539 19 TriCo Bancshares TCBK 2,744,066 20 1867 Western Financial Corporation WFCL 2,144,888 21 Farmers & Merchants Bancorp FMCB 1,964,776 22 Bank of Marin Bancorp BMRC 1,805,194 23 Exchange Bank EXSR 1,783,403 24 Preferred Bank PFBC 1,768,959 25 Pacific Premier Bancorp, Inc. PPBI 1,714,187 26 Bridge Capital Holdings BBNK 1,604,112 27 Heritage Commerce Corp HTBK 1,491,632 28 Sierra Bancorp BSRR 1,410,249 29 CU Bancorp CUNB 1,346,387 30 American Business Bank AMBZ 1,342,125 31 River City Bank RCBC 1,234,145 32 Heritage Oaks Bancorp HEOP 1,203,651 33 Central Valley Community Bancorp CVCY 1,145,635 34 Provident Financial Holdings, Inc. PROV 1,134,062 |
|
|
CALIFORNIA PUBLIC BANKS AND THRIFTS, CONTINUED February 6, 2014 12/31/2013 Source: SNL Company Ticker Assets 31 35 Bank of Commerce Holdings BOCH 951,546 36 Pacific Mercantile Bancorp PMBC 928,750 37 North Valley Bancorp NOVB 917,764 38 First Northern Community Bancorp FNRN 897,700 39 FNB Bancorp FNBG 891,930 40 Malaga Financial Corporation MLGF 887,000 41 Simplicity Bancorp, Inc. SMPL 834,605 42 California Republic Bancorp CRPB 796,990 43 1st Enterprise Bank FENB 760,001 44 Pacific City Financial Corporation PFCF 730,739 45 Sunwest Bank SWBC 672,866 46 Oak Valley Bancorp OVLY 672,060 47 United Security Bancshares UBFO 635,929 48 American River Bankshares AMRB 592,753 49 Premier Valley Bank PVLY 576,332 50 Commonwealth Business Bank CWBB 570,155 51 Security California Bancorp SCAF 556,748 52 California First National Bancorp CFNB 552,729 53 Community West Bancshares CWBC 539,000 54 1st Century Bancshares, Inc. FCTY 532,327 55 Plumas Bancorp PLBC 525,415 56 Plaza Bank PLZB 490,957 57 Avidbank Holdings, Inc. AVBH 483,234 58 Manhattan Bancorp MNHN 477,947 59 Greater Sacramento Bancorp GSCB 459,484 60 Summit State Bank SSBI 454,074 61 Presidio Bank PDOB 443,818 62 Mission Community Bancorp MISN 441,230 63 Mission Bancorp MSBC 401,233 |

|
|
In-Market Consolidation Strong Core Deposit Base ACQUISITION ACTIVITY Similar Strategic Focus Asset generation Capability Key Drivers of Accretion: Cost Savings Customer Retention Margin Improvement February 6, 2014 Acquisition Strategy 32 Market Expansion |

|
|
THE FCAL ACQUISITION The First California Financial Group, Inc. (FCAL) acquisition closed on May 31, 2013 – systems were converted on June 15, 2013 The acquisition was an attractive in-market consolidation of meaningful size and will drive significant consolidated earnings accretion Both banks possess complementary business banking models with strong core deposit bases The resulting banking franchise has the capital resources, scale, management team and financial strength necessary to thrive in the current competitive environment February 6, 2014 33 |

|
|
Consideration Fixed exchange ratio consisting of 0.2837 of a share of PACW and $2.47 in cash $13.28 in value per CSE share (based on PACW closing price on 2/3/2014 of $38.12) Transaction Value $2.6 billion Ownership Post Deal 45% PacWest – 55% CapitalSource Termination Customary break-up fee Board Composition PacWest to appoint 8; CapitalSource to appoint 5; John Eggemeyer to be Chairman Management Matt Wagner to be CEO; Jim Pieczynski to be President of the new CapitalSource division of Pacific Western Bank Anticipated Merger Related Charge to Equity After Tax $60 million Targeted Cost Savings $47 million pre-tax in 2015: 23% of CapitalSource’s non-interest expense and 12% of combined non-interest expense(1) Compelling Returns TBV Accretion at Close 2015 EPS Accretion Estimated IRR Dividend Transaction is financially compelling. For illustrative purposes, based on IBES consensus estimates:(2) ~ 10% ~ 18% ~ 20% Maintain current PacWest’s quarterly cash dividend of $0.25 per share Approvals Regulators and stockholders of each Company Targeted Closing First Quarter 2014 PROPOSED MERGER WITH CAPITALSOURCE February 6, 2014 Percentages are based on 2Q’ 13 non-interest expense annualized. Estimated financial impact is presented solely for illustrative purposes using IBES consensus estimates. Neither PACW nor CSE endorse the IBES consensus estimates or publish financial guidance. Actual results may differ materially. Deal Summary 34 |

|
|
Financially Compelling Risk Management Factors Continuity and Growth For illustrative purposes, based on IBES consensus estimates:(3) 2015 estimated GAAP EPS accretion of ~18% 2015 estimated ROAA of ~1.65% and ROATCE of ~17% ~10% accretive to TBV per share Strong pro forma capital ratios(3) (4) ~10.5% TCE / TA ~11.7% Tier 1 Common ~15.7% Total RBC PROPOSED MERGER WITH CAPITALSOURCE Continues PACW’s growth as a highly profitable business-focused bank Creates the 6th largest publicly-owned bank headquartered in California(1) Top decile(2) NIM from strong asset yields and low cost funding Improved loan diversification with broadened middle-market reach Outstanding profitability with excellent asset quality Track record of 26 successfully integrated acquisitions since 2000 Top funding and lending teams drawn from each firm Excellent pro forma credit metrics(3) (4) - ~29% Classified / (Tier 1+ALLL)(3) (5) - ~74% ALLL/Non-Accrual Loans(3) (5) Ranking is based on total assets as of 12/31/2013. Peers include U.S. banks traded on the NYSE or NASDAQ with assets between $10bn and $50bn. Estimated financial impact is presented solely for illustrative purposes using IBES consensus estimates. Neither PACW nor CSE endorse the IBES consensus estimates or publish financial guidance. Actual results may differ materially. Pro Forma as of December 31, 2013; consolidated level. Assumes 90% of the credit mark is applied to classified assets and 75% to nonaccrual loans at the consolidated level. February 6, 2014 Transaction Highlights 35 |

|
|
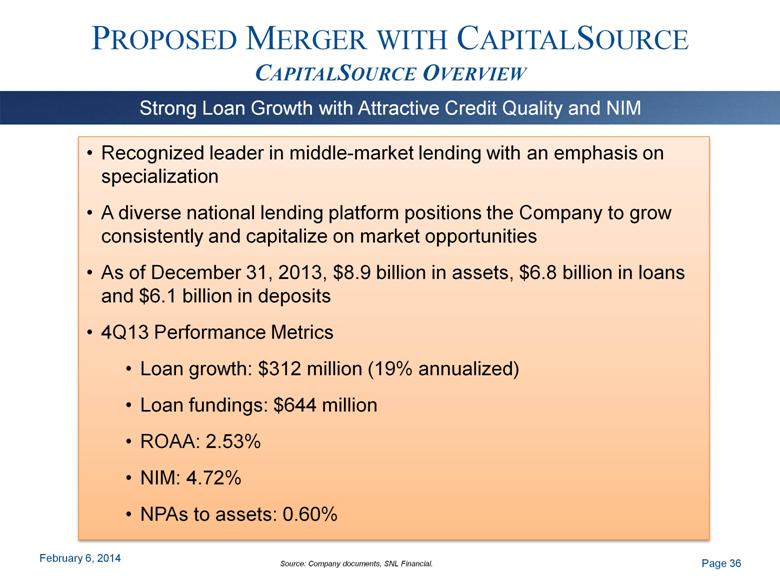
PROPOSED MERGER WITH CAPITALSOURCE CAPITALSOURCE OVERVIEW Page 36 Strong Loan Growth with Attractive Credit Quality and NIM Recognized leader in middle-market lending with an emphasis on specialization A diverse national lending platform positions the Company to grow consistently and capitalize on market opportunities As of December 31, 2013, $8.9 billion in assets, $6.8 billion in loans and $6.1 billion in deposits 4Q13 Performance Metrics Loan growth: $312 million (19% annualized) Loan fundings: $644 million ROAA: 2.53% NIM: 4.72% NPAs to assets: 0.60% Source: Company documents, SNL Financial. February 6, 2014 |
|
|
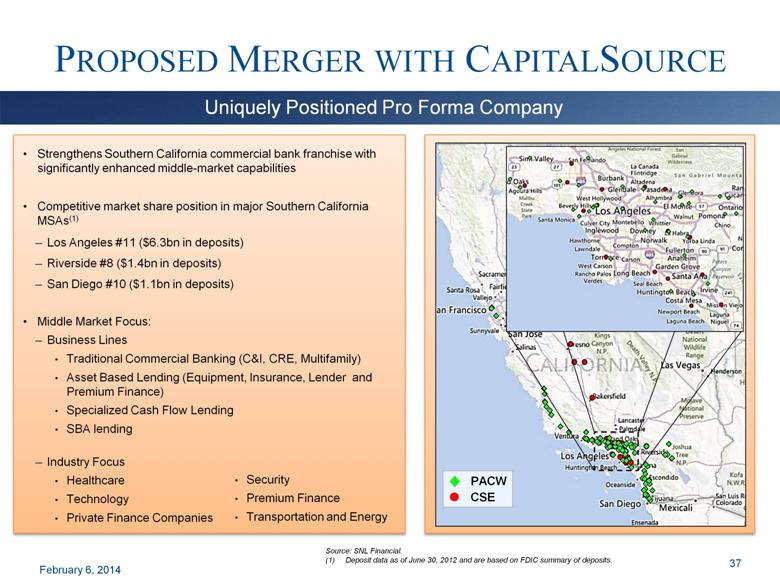
Strengthens Southern California commercial bank franchise with significantly enhanced middle-market capabilities Competitive market share position in major Southern California MSAs(1) Los Angeles #11 ($6.3bn in deposits) Riverside #8 ($1.4bn in deposits) San Diego #10 ($1.1bn in deposits) Middle Market Focus: Business Lines Traditional Commercial Banking (C&I, CRE, Multifamily) Asset Based Lending (Equipment, Insurance, Lender and Premium Finance) Specialized Cash Flow Lending SBA lending Industry Focus Healthcare Technology Private Finance Companies PROPOSED MERGER WITH CAPITALSOURCE Source: SNL Financial. (1) Deposit data as of June 30, 2012 and are based on FDIC summary of deposits. Security Premium Finance Transportation and Energy February 6, 2014 Uniquely Positioned Pro Forma Company 37 |
|
|
PROPOSED MERGER WITH CAPITALSOURCE DEPOSIT PLATFORM Page 38 Significant Opportunity to Improve Deposit Base Key Points Meaningful improvement in legacy CapitalSource deposit base can be achieved following the combination of the two companies Under its current charter, CapitalSource is not permitted to offer demand deposit accounts - Significant opportunity to attract CapitalSource loan customers as depositors PacWest has a strong deposit franchise with 88% of its deposits in non-CD accounts and has successfully integrated a number of acquisitions with a high proportion of time deposits Over time, the combined company expects to replace rate sensitive CD customers with core commercial banking clients February 6, 2014 38 |

|
|
Chairman: John Eggemeyer Board: 13 Directors Chairman: Tad Lowrey Board: 7 Directors PROPOSED MERGER WITH CAPITALSOURCE Chief Executive Officer Matt Wagner CapitalSource Division Jim Pieczynski General Counsel Kori Ogrosky Chief Financial Officer Vic Santoro Chief Credit Officer Bryan Corsini Human Resources Chris Blake Chief Risk Officer Suzanne Brennan Community Bank Jared Wolff Executive Management Board Composition Holding Company Board Bank Board February 6, 2014 Board and Management 39 |

|
|
PROPOSED MERGER WITH CAPITALSOURCE Superior middle-market lender and leading Southern California core-deposit-funded bank Reasonably priced merger creates financial benefits for both sets of shareholders Easy to understand transaction assumptions and integration plan Winning financial model of superior commercial asset generation with low cost deposit funding Combined company shareholder returns and capital ratios among the highest in the country February 6, 2014 Conclusion 40 |

|
|
NON-GAAP MEASUREMENTS The Company uses certain non-GAAP financial measures to provide meaningful supplemental information regarding the Company’s operational performance and to enhance investors’ overall understanding of such financial performance. These non-GAAP financial measures are presented for supplemental informational purposes only for understanding the Company’s operating results and should not be considered a substitute for financial information presented in accordance with GAAP. These non-GAAP financial measures presented by the Company may be different from non-GAAP financial measures used by other companies. The table on the following slide presents a reconciliation of the non-GAAP financial measurements to the GAAP financial measurements and certain key performance ratios. February 6, 2014 Overview 41 |
|
|
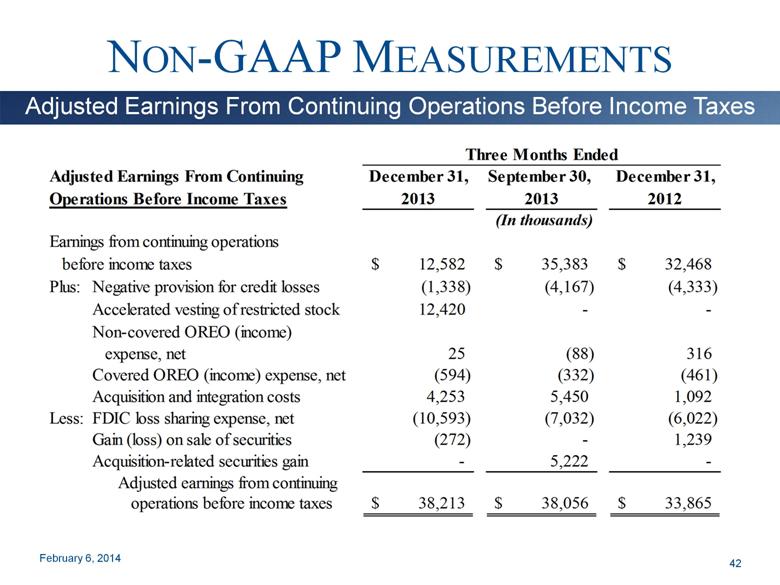
NON-GAAP MEASUREMENTS February 6, 2014 Adjusted Earnings From Continuing Operations Before Income Taxes 42 Three Months Ended Adjusted Earnings From Continuing December 31, September 30, December 31, Operations Before Income Taxes 2013 2013 2012 (In thousands) Earnings from continuing operations before income taxes 12,582 $ 35,383 $ 32,468 $ Plus: Negative provision for credit losses (1,338) (4,167) (4,333) Accelerated vesting of restricted stock 12,420 - - Non-covered OREO (income) expense, net 25 (88) 316 Covered OREO (income) expense, net (594) (332) (461) Acquisition and integration costs 4,253 5,450 1,092 Less: FDIC loss sharing expense, net (10,593) (7,032) (6,022) Gain (loss) on sale of securities (272) - 1,239 Acquisition-related securities gain - 5,222 - Adjusted earnings from continuing operations before income taxes 38,213 $ 38,056 $ 33,865 $ Three Months Ended |
|
|
NON-GAAP MEASUREMENTS February 6, 2014 Tangible Equity Calculated as tangible common equity divided by tangible assets. Calculated as tangible common equity divided by shares outstanding. 43 December 31, September 30, Tangible Common Equity 2013 2013 (Dollars in thousands) PacWest Bancorp Consolidated: Stockholders' equity 809,093 $ 816,289 $ Less: Intangible assets 225,991 234,540 Tangible common equity 583,102 $ 581,749 $ Total assets 6,533,363 $ 6,616,855 $ Less: Intangible assets 225,991 234,540 Tangible assets 6,307,372 $ 6,382,315 $ Equity to assets ratio 12.38% 12.34% Tangible common equity ratio (1) 9.24% 9.12% Book value per share 17.66 $ 17.71 $ Tangible book value per share (2) 12.73 $ 12.62 $ Shares outstanding 45,822,834 46,090,742 Pacific Western Bank: Stockholders' equity 911,200 $ 906,029 $ Less: Intangible assets 225,991 234,540 Tangible common equity 685,209 $ 671,489 $ Total assets 6,523,742 $ 6,607,926 $ Less: Intangible assets 225,991 234,540 Tangible assets 6,297,751 $ 6,373,386 $ Equity to assets ratio 13.97% 13.71% Tangible common equity ratio (1) 10.88% 10.54% Three Months Ended December 31, September 30, December 31, Return on Average Tangible Equity 2013 2013 2012 (Dollars in thousands) PacWest Bancorp Consolidated: Net earnings $ 3,109 $ 24,163 $ 19,892 Average stockholders' equity $ 818,935 $ 797,725 $ 585,525 Less: Average intangible assets 233,628 228,947 94,604 Average tangible common equity $ 585,307 $ 568,778 $ 490,921 Annualized return on average equity 1.51% 12.02% 13.52% Annualized return on average tangible equity 2.11% 16.85% 16.12% |

|
|
NON-GAAP MEASUREMENTS February 6, 2014 Adjusted Efficiency Ratio Noninterest expense divided by net revenues. Adjusted noninterest expense divided by adjusted net revenues. 44 December 31, September 30, December 31, Adjusted Efficiency Ratio 2013 2013 2012 (Dollars in thousands) Noninterest expense $ 66,088 $ 56,200 $ 43,525 Less: Accelerated vesting of restricted stock 12,420 - - Less: Non-covered OREO (income) expense, net 25 (88) 316 Covered OREO (income) expense, net (594) (332) (461) Acquisition and integration costs 4,253 5,450 1,092 Adjusted noninterest expense $ 49,984 $ 51,170 $ 42,578 Net interest income $ 81,258 $ 82,289 $ 69,603 Noninterest income (3,926) 5,127 2,057 Net revenues 77,332 87,416 71,660 Less: FDIC loss sharing expense, net (10,593) (7,032) (6,022) Gain (loss) on sale of securities (272) - 1,239 Acquisition-related securities gain - 5,222 - Adjusted net revenues $ 88,197 $ 89,226 $ 76,443 Base efficiency ratio (1) 85.5% 64.3% 60.7% Adjusted efficiency ratio (2) 56.7% 57.3% 55.7% Three Months Ended |

|
|
10250 Constellation Boulevard, Suite 1640 Los Angeles, California 90067 Matt Wagner, CEO Vic Santoro, CFO (310) 728-1020 (310) 728-1021 |
