| Consolidated Balance Sheets |
|
|
|
|
| |
|
December 31, |
|
September 30, |
| |
|
2013 |
|
2013 |
| ASSETS |
|
(unaudited) |
|
|
| Real Estate Investments: |
|
|
|
|
| Land |
|
$ 106,205,280 |
|
$ 97,400,859 |
| Buildings and Improvements |
|
597,658,609 |
|
530,493,968 |
| Total Real Estate Investments |
|
703,863,889 |
|
627,894,827 |
| Accumulated Depreciation |
|
(94,908,661) |
|
(91,095,415) |
| Net Real Estate Investments |
|
608,955,228 |
|
536,799,412 |
| |
|
|
|
|
| Cash and Cash Equivalents |
|
8,452,628 |
|
12,404,512 |
| Securities Available for Sale at Fair Value |
|
53,595,597 |
|
45,451,740 |
| Tenant and Other Receivables |
|
3,562,479 |
|
889,645 |
| Deferred Rent Receivable |
|
3,349,348 |
|
3,158,286 |
| Loans Receivable, net |
|
61,737 |
|
65,875 |
| Prepaid Expenses |
|
4,120,549 |
|
2,201,270 |
| Financing Costs, net of Accumulated Amortization of |
|
|
|
|
| $3,230,658 and $3,061,640, respectively |
|
4,489,644 |
|
3,823,919 |
| Lease Costs, net of Accumulated Amortization of |
|
|
|
|
| $1,535,988 and $1,414,861, respectively |
|
2,339,725 |
|
2,183,772 |
| Intangible Assets, net of Accumulated Amortization of |
|
|
|
|
| $8,681,271 and $8,333,680, respectively |
|
7,550,593 |
|
6,727,360 |
| Other Assets |
|
1,384,046 |
|
3,535,075 |
| TOTAL ASSETS |
|
697,861,574 |
|
617,240,866 |
| |
|
|
|
|
| LIABILITIES AND SHAREHOLDERS' EQUITY |
|
|
|
|
| Liabilities: |
|
|
|
|
| Mortgage Notes Payable |
|
292,253,665 |
|
250,093,382 |
| Loans Payable |
|
51,277,550 |
|
22,200,000 |
| Accounts Payable and Accrued Expenses |
|
3,316,943 |
|
5,404,883 |
| Other Liabilities |
|
7,245,046 |
|
3,627,630 |
| Total Liabilities |
|
354,093,204 |
|
281,325,895 |
| |
|
|
|
|
| COMMITMENTS AND CONTINGENCIES |
|
|
|
|
| |
|
|
|
|
| Shareholders' Equity: |
|
|
|
|
| Series A - 7.625% Cumulative Redeemable Preferred Stock, |
|
|
|
|
| $0.01 Par Value Per Share: 2,139,750 Shares |
|
|
|
|
| Authorized, Issued and Outstanding as of December 31, |
|
53,493,750 |
|
53,493,750 |
| 2013 and September 30, 2013, respectively |
|
|
|
|
| Series B - 7.875% Cumulative Redeemable Preferred Stock, |
|
|
|
|
| $0.01 Par Value Per Share: 2,300,000 Shares Authorized, |
|
|
|
|
| Issued and Outstanding as of December 31, 2013 and |
|
57,500,000 |
|
57,500,000 |
| September 30, 2013, respectively |
|
|
|
|
| Common Stock – $0.01 Par Value Per Share: 67,700,000 |
|
|
|
|
| and 67,700,000 Shares Authorized; 46,134,827 and |
|
|
|
|
| 44,488,509 Shares Issued and Outstanding as of |
|
461,348 |
|
444,885 |
| December 31, 2013 and September 30, 2013, respectively |
|
|
|
|
| Excess Stock – $0.01 Par Value Per Share: 5,000,000 Shares |
|
|
|
|
| Authorized; No Shares Issued or Outstanding |
|
-0- |
|
-0- |
| Additional Paid-In Capital |
|
231,874,109 |
|
222,487,068 |
| Accumulated Other Comprehensive Income |
|
439,163 |
|
1,989,268 |
| Undistributed Income |
|
-0- |
|
-0- |
| Total Shareholders' Equity |
|
343,768,370 |
|
335,914,971 |
| TOTAL LIABILITIES & SHAREHOLDERS' EQUITY |
|
$ 697,861,574 |
|
$ 617,240,866 |
| |
|
|
|
|
First Quarter FY 2014 Supplemental
of Monmouth Real Estate Investment Corp. Page 3 of 20
| Consolidated Statements of Operations |
|
|
|
|
| (unaudited) |
|
|
|
|
| |
Three Months Ended |
|
| |
12/31/2013 |
|
12/31/2012 |
|
| INCOME: |
|
|
|
|
| Rental Revenue |
$13,570,722 |
|
$11,309,254 |
|
| Reimbursement Revenue |
2,090,433 |
|
1,518,236 |
|
| Lease Termination Income |
-0- |
|
690,730 |
|
| TOTAL INCOME |
15,661,155 |
|
13,518,220 |
|
| |
|
|
|
|
| EXPENSES: |
|
|
|
|
| Real Estate Taxes |
1,857,055 |
|
1,163,514 |
|
| Operating Expenses |
719,437 |
|
551,803 |
|
| General & Administrative Expense |
1,120,463 |
|
1,269,877 |
|
| Acquisition Costs |
462,864 |
|
385,862 |
|
| Depreciation |
3,813,246 |
|
3,121,064 |
|
| Amortization of Lease Costs and Intangible Assets |
443,226 |
|
492,864 |
|
| TOTAL EXPENSES |
8,416,291 |
|
6,984,984 |
|
| |
|
|
|
|
| |
|
|
|
|
| OTHER INCOME (EXPENSE): |
|
|
|
|
| Interest and Dividend Income |
938,768 |
|
1,123,061 |
|
| Gain on Sale of Securities Transactions, net |
150,725 |
|
2,110,768 |
|
| Interest Expense |
(3,875,141) |
|
(3,875,672) |
|
| Amortization of Financing Costs |
(169,018) |
|
(180,790) |
|
| TOTAL OTHER INCOME (EXPENSE) |
(2,954,666) |
|
(822,633) |
|
| |
|
|
|
|
| |
|
|
|
|
| INCOME FROM CONTINUING OPERATIONS |
4,290,198 |
|
5,710,603 |
|
| |
|
|
|
|
| LOSS FROM DISCONTINUED OPERATIONS |
-0- |
|
(4,026) |
|
| |
|
|
|
|
| NET INCOME |
4,290,198 |
|
5,706,577 |
|
| |
|
|
|
|
| Less: Preferred Dividend |
2,151,758 |
|
2,151,758 |
|
| |
|
|
|
|
| NET INCOME ATTRIBUTABLE TO |
|
|
|
|
| COMMON SHAREHOLDERS |
$2,138,440 |
|
$3,554,819 |
|
| |
|
|
|
|
| |
|
|
|
|
First Quarter FY 2014 Supplemental
of Monmouth Real Estate Investment Corp. Page 4 of 20
| FFO, Core FFO, AFFO, NOI and EBITDA Reconciliations |
|
|
|
|
| (unaudited) |
|
|
|
|
| |
|
Three Months Ended |
|
| |
|
12/31/2013 |
|
12/31/2012 |
|
| Revenues |
|
|
|
|
| |
Rental Revenue |
$13,570,722 |
|
$11,309,254 |
|
| |
Reimbursement Revenue |
2,090,433 |
|
1,518,236 |
|
| |
Total Rental and Reimbursement Revenue |
15,661,155 |
|
12,827,490 |
|
| |
|
|
|
|
|
| Expenses |
|
|
|
|
| |
Real Estate Taxes |
1,857,055 |
|
1,163,514 |
|
| |
Operating Expenses |
719,437 |
|
551,803 |
|
| |
Total Expenses |
2,576,492 |
|
1,715,317 |
|
| |
|
|
|
|
|
| Net Operating Income - NOI |
13,084,663 |
|
11,112,173 |
|
| |
|
|
|
|
|
| |
Lease Termination Income |
-0- |
|
690,730 |
|
| |
Interest and Dividend Income |
938,768 |
|
1,123,061 |
|
| |
Net Operating Income from Discontinued Operations |
-0- |
|
8,817 |
|
| |
General & Administrative Expense |
(1,120,463) |
|
(1,269,877) |
|
| |
|
|
|
|
|
| EBITDA |
12,902,968 |
|
11,664,904 |
|
| |
|
|
|
|
|
| |
Interest Expense |
(3,875,141) |
|
(3,875,672) |
|
| |
Gain on Sale Securities Transactions, net |
150,725 |
|
2,110,768 |
|
| |
Acquisition Costs |
(462,864) |
|
(385,862) |
|
| |
Preferred Dividend |
(2,151,758) |
|
(2,151,758) |
|
| |
Amortization of Financing and Lease Costs |
(279,495) |
|
(288,951) |
|
| |
|
|
|
|
|
| Funds From Operations - FFO |
6,284,435 |
|
7,073,429 |
|
| |
|
|
|
|
|
| |
Depreciation Expense (including Discontinued Operations) |
(3,813,246) |
|
(3,133,907) |
|
| |
Gain (Loss) on Sales of Depreciable Assets |
-0- |
|
-0- |
|
| |
Amortization of Intangible Assets |
(332,749) |
|
(384,703) |
|
| |
|
|
|
|
| Net Income Attributable to Common Shareholders |
2,138,440 |
|
3,554,819 |
|
| |
|
|
|
|
|
| Funds From Operations - FFO |
6,284,435 |
|
7,073,429 |
|
| |
|
|
|
|
|
| |
Acquisition Costs |
462,864 |
|
385,862 |
|
| |
|
|
|
|
|
| Core Funds From Operations - Core FFO |
6,747,299 |
|
7,459,291 |
|
| |
|
|
|
|
|
| |
Gain on Sale Securities Transactions, net |
(150,725) |
|
(2,110,768) |
|
| |
Stock Compensation Expense |
86,497 |
|
79,527 |
|
| |
Amortization of Financing and Lease Costs |
279,495 |
|
288,951 |
|
| |
Straight-lined Rents |
(191,062) |
|
(147,992) |
|
| |
Recurring Capital Expenditures |
(79,933) |
|
(36,640) |
|
| |
|
|
|
|
|
| Adjusted Funds From Operations - AFFO |
6,691,571 |
|
5,532,369 |
|
| |
|
|
|
|
|
| EBITDA |
12,902,968 |
|
11,664,904 |
|
| |
|
|
|
|
|
| |
Interest Expense |
(3,875,141) |
|
(3,875,672) |
|
| |
Preferred Dividend |
(2,151,758) |
|
(2,151,758) |
|
| |
Stock Compensation Expense |
86,497 |
|
79,527 |
|
| |
Straight-Lined Rents |
(191,062) |
|
(147,992) |
|
| |
Recurring Capital Expenditures |
(79,933) |
|
(36,640) |
|
| |
|
|
|
|
|
| Adjusted Funds From Operations - AFFO |
6,691,571 |
|
5,532,369 |
|
| |
|
|
|
|
|
|
First Quarter FY 2014 Supplemental
of Monmouth Real Estate Investment Corp. Page 5 of 20
Financial Highlights |
|
|
|
|
| (unaudited) |
|
|
|
|
| |
|
Three Months Ended |
|
| |
|
12/31/2013 |
|
12/31/2012 |
|
| |
|
|
|
|
|
| Weighted Average Common Shares Outstanding |
|
|
|
|
| |
Basic |
45,243,275 |
|
40,902,500 |
|
| |
Diluted |
45,331,446 |
|
41,110,269 |
|
| |
|
|
|
|
|
| Net Operating Income - NOI |
$13,084,663 |
|
$11,112,173 |
|
| |
|
|
|
|
|
| |
Basic |
$0.29 |
|
$0.27 |
|
| |
Diluted |
0.29 |
|
0.27 |
|
| Net Income Attributable to Common Shareholders |
$2,138,440 |
|
$3,554,819 |
|
| |
|
|
|
|
|
| |
Basic |
$0.05 |
|
$0.09 |
|
| |
Diluted |
0.05 |
|
0.09 |
|
| |
|
|
|
|
|
| Funds From Operations - FFO |
$6,284,435 |
|
$7,073,429 |
|
| |
|
|
|
|
|
| |
Basic |
$0.14 |
|
$0.17 |
|
| |
Diluted |
0.14 |
|
0.17 |
|
| |
|
|
|
|
|
| Core Funds From Operations - Core FFO |
$6,747,299 |
|
$7,459,291 |
|
| |
|
|
|
|
|
| |
Basic |
$0.15 |
|
$0.18 |
|
| |
Diluted |
0.15 |
|
0.18 |
|
| |
|
|
|
|
|
| Core FFO Excluding Gains on Securities Transactions, net |
$6,596,574 |
|
$5,348,523 |
|
| |
|
|
|
|
|
| |
Basic |
$0.15 |
|
$0.13 |
|
| |
Diluted |
0.15 |
|
0.13 |
|
| |
|
|
|
|
|
| Core FFO Excluding Lease Termination Income, net |
$6,747,299 |
|
$6,768,561 |
|
| |
|
|
|
|
|
| |
Basic |
$0.15 |
|
$0.17 |
|
| |
Diluted |
0.15 |
|
0.16 |
|
| |
|
|
|
|
|
| Adjusted Funds From Operations - AFFO |
$6,691,571 |
|
$5,532,369 |
|
| |
|
|
|
|
|
| |
Basic |
$0.15 |
|
$0.14 |
|
| |
Diluted |
0.15 |
|
0.13 |
|
| |
|
|
|
|
| AFFO Excluding Lease Termination Income, net |
$6,691,571 |
|
$4,841,639 |
|
| |
|
|
|
|
|
| |
Basic |
$0.15 |
|
$0.12 |
|
| |
Diluted |
0.15 |
|
0.12 |
|
| |
|
|
|
|
|
| Dividends Declared per Common Share |
$0.15 |
|
$0.15 |
|
| |
|
|
|
|
|
|
|
|
First Quarter FY 2014 Supplemental
of Monmouth Real Estate Investment Corp. Page 6 of 20
| Consolidated Statements of Cash Flows |
|
|
|
|
| (unaudited) |
|
|
|
|
| |
|
|
|
|
| |
|
Three Months Ended |
| |
|
12/31/2013 |
|
12/31/2012 |
| CASH FLOWS FROM OPERATING ACTIVITIES |
|
|
|
|
| Net Income |
|
$4,290,198 |
|
$5,706,577 |
| Noncash Items Included in Net Income: |
|
|
|
|
| Depreciation & Amortization |
|
4,425,490 |
|
3,814,812 |
| Stock Compensation Expense |
|
86,497 |
|
79,527 |
| Gain on Sale of Securities Transactions, net |
|
(150,725) |
|
(2,110,768) |
| Changes In: |
|
|
|
|
| Tenant, Deferred Rent and Other Receivables |
|
(2,838,404) |
|
(1,649,722) |
| Prepaid Expenses |
|
(1,919,279) |
|
(1,828,963) |
| Other Assets and Lease Costs |
|
(72,902) |
|
385,461 |
| Accounts Payable, Accrued Expenses and Other Liabilities |
|
3,572,955 |
|
595,282 |
| NET CASH PROVIDED BY OPERATING ACTIVITIES |
|
7,393,830 |
|
4,992,206 |
| |
|
|
|
|
| CASH FLOWS FROM INVESTING ACTIVITIES |
|
|
|
|
| Purchase of Real Estate and Intangible Assets, net of deposits |
|
(73,860,759) |
|
(43,042,470) |
| Capital and Land Site Improvements |
|
(5,322,605) |
|
(762,416) |
| Return of Deposits on Real Estate |
|
1,800,000 |
|
400,000 |
| Deposits on Acquisition of Real Estate |
|
(250,500) |
|
(1,550,000) |
| Proceeds from Sale of Securities Available for Sale |
|
1,996,362 |
|
4,042,158 |
| Purchase of Securities Available for Sale |
|
(11,539,599) |
|
(8,781,232) |
| Collections on Loans Receivable |
|
4,138 |
|
6,453 |
| NET CASH USED IN INVESTING ACTIVITIES |
|
(87,172,963) |
|
(49,687,507) |
| |
|
|
|
|
| CASH FLOWS FROM FINANCING ACTIVITIES |
|
|
|
|
| Net Proceeds from Loans |
|
29,077,550 |
|
22,507,905 |
| Repurchase of Subordinated Convertible Debentures |
|
-0- |
|
(5,115,000) |
| Proceeds from Mortgages |
|
48,905,000 |
|
35,000,000 |
| Principal Payments on Mortgages |
|
(6,744,717) |
|
(16,657,172) |
| Financing Costs Paid on Debt |
|
(437,393) |
|
(565,252) |
| Net Distributions to Noncontrolling Interests |
|
-0- |
|
(20,133) |
| Proceeds from Issuance of Common Stock in the DRIP, |
|
|
|
|
| net of reinvestments |
|
12,154,108 |
|
1,859,191 |
| Preferred Dividends Paid |
|
(2,151,758) |
|
(2,151,758) |
| Common Dividends Paid, net of reinvestments |
|
(4,975,541) |
|
(4,529,216) |
| NET CASH PROVIDED BY FINANCING ACTIVITIES |
|
75,827,249 |
|
30,328,565 |
| |
|
|
|
|
| NET DECREASE IN CASH AND CASH EQUIVALENTS |
|
(3,951,884) |
|
(14,366,736) |
| CASH AND CASH EQUIVALENTS - BEGINNING OF PERIOD |
|
12,404,512 |
|
24,650,858 |
| CASH AND CASH EQUIVALENTS - END OF PERIOD |
|
$8,452,628 |
|
$10,284,122 |
First Quarter FY 2014 Supplemental
of Monmouth Real Estate Investment Corp. Page 7 of 20
| Capital Structure and Leverage Ratios |
|
As of |
|
As of |
|
As of |
| (unaudited) |
|
12/31/2013 |
|
12/31/2012 |
|
9/30/2013 |
| |
|
|
|
|
|
|
|
| Mortgage Notes Payable |
|
$292,253,665 |
|
$256,286,739 |
|
$250,093,382 |
| Loans Payable |
|
51,277,550 |
|
27,707,905 |
|
22,200,000 |
| |
Total Debt |
|
343,531,215 |
|
283,994,644 |
|
272,293,382 |
| |
|
|
|
|
|
|
|
| |
|
|
|
|
|
|
|
| Series A - 7.625% Cumul. Redeemable Preferred |
|
53,493,750 |
|
53,493,750 |
|
53,493,750 |
| Series B - 7.875% Cumul. Redeemable Preferred |
|
57,500,000 |
|
57,500,000 |
|
57,500,000 |
| |
Total Preferred Stock |
|
110,993,750 |
|
110,993,750 |
|
110,993,750 |
| |
|
|
|
|
|
|
|
| Common Stock, Paid-in-Capital & Other |
|
232,774,620 |
|
207,408,812 |
|
224,921,221 |
| |
Total Shareholders' Equity |
|
343,768,370 |
|
318,402,562 |
|
335,914,971 |
| |
|
|
|
|
|
|
|
| |
Total Book Capitalization |
|
687,299,585 |
|
602,397,206 |
|
608,208,353 |
| |
|
|
|
|
|
|
|
| |
Accumulated Depreciation |
|
94,908,661 |
|
81,351,937 |
|
91,095,415 |
| |
Total Undepreciated Book Capitalization |
|
$782,208,246 |
|
$683,749,143 |
|
$699,303,768 |
| |
|
|
|
|
|
|
|
| |
|
|
|
|
|
|
|
| |
|
|
|
|
|
|
|
| Shares Outstanding |
|
46,134,827 |
|
41,435,022 |
|
44,488,509 |
| Market Price Per Share |
|
$9.09 |
|
$10.36 |
|
$9.07 |
| |
|
|
|
|
|
|
|
| Equity Market Capitalization |
|
$419,365,577 |
|
$429,266,828 |
|
$403,510,777 |
| Total Debt |
|
343,531,215 |
|
283,994,644 |
|
272,293,382 |
| Preferred |
|
110,993,750 |
|
110,993,750 |
|
110,993,750 |
| |
Total Market Capitalization |
|
$873,890,542 |
|
$824,255,222 |
|
$786,797,909 |
| |
|
|
|
|
|
|
|
| |
|
|
|
|
|
|
|
| |
|
|
|
|
|
|
|
| Total Debt |
|
$343,531,215 |
|
$283,994,644 |
|
$272,293,382 |
| less: Cash and Cash Equivalents |
|
8,452,628 |
|
10,284,122 |
|
12,404,512 |
| |
Net Debt |
|
$335,078,587 |
|
$273,710,522 |
|
$259,888,870 |
| |
|
|
|
|
|
|
|
| |
|
|
|
|
|
|
|
| |
|
|
|
|
|
|
|
| Net Debt / Undepreciated Book Capitalization |
|
42.8% |
|
40.0% |
|
37.2% |
| Net Debt / Total Market Capitalization |
|
38.3% |
|
33.2% |
|
33.0% |
| Net Debt + Preferred / Total Market Capitalization |
|
51.0% |
|
46.7% |
|
47.1% |
| |
|
|
|
|
|
|
|
| |
|
|
|
|
|
|
|
First Quarter FY 2014 Supplemental
of Monmouth Real Estate Investment Corp. Page 8 of 20
| Capital Structure and Leverage Ratios (continued) |
|
|
|
|
| (unaudited) |
|
|
|
|
|
|
| |
|
|
|
|
|
|
|
| |
|
|
|
|
|
|
Fiscal Year |
| |
|
|
Three Months Ended |
|
Ended |
| |
|
|
12/31/2013 |
|
12/31/2012 |
|
9/30/2013 |
| Net Income |
|
$4,290,198 |
|
$5,706,577 |
|
$21,395,246 |
| plus: Depreciation & Amortization (includes Discontinued Operations) |
|
4,425,490 |
|
3,807,561 |
|
15,542,937 |
| plus: Interest Expense |
|
3,875,141 |
|
3,875,672 |
|
14,956,954 |
| plus: Acquisition Costs |
|
462,864 |
|
385,862 |
|
514,699 |
| less: Gain on Securities Transactions, net |
|
(150,725) |
|
(2,110,768) |
|
(7,133,252) |
| less: Gain on Sales of Depreciable Assets |
|
-0- |
|
-0- |
|
(345,794) |
| |
EBITDA |
|
$12,902,968 |
|
$11,664,904 |
|
$44,930,790 |
| |
|
|
|
|
|
|
|
| Interest Expense |
|
$3,875,141 |
|
$3,875,672 |
|
$14,956,954 |
| Preferred Dividends Paid |
|
2,151,758 |
|
2,151,758 |
|
8,607,032 |
| |
Total Fixed Charges |
|
$6,026,899 |
|
$6,027,430 |
|
$23,563,986 |
| |
|
|
|
|
|
|
|
| Interest Coverage |
|
3.3 x |
|
3.0 x |
|
3.0 x |
| Fixed Charge Coverage |
|
2.1 x |
|
1.9 x |
|
1.9 x |
| |
|
|
|
|
|
|
|
| Total Debt |
|
$343,531,215 |
|
$283,994,644 |
|
$272,293,382 |
| Annualized EBITDA |
|
51,611,872 |
|
46,659,616 |
|
44,930,790 |
| |
|
|
|
|
|
|
|
| Total Debt / EBITDA |
|
6.7 x |
|
6.1 x |
|
6.1 x |
First Quarter FY 2014 Supplemental
of Monmouth Real Estate Investment Corp. Page 9 of 20
| |
|
|
Loans |
|
% of |
| Fiscal Year ended |
|
Mortgages |
Payable (1) |
Total (1) |
Total |
| |
|
|
|
|
|
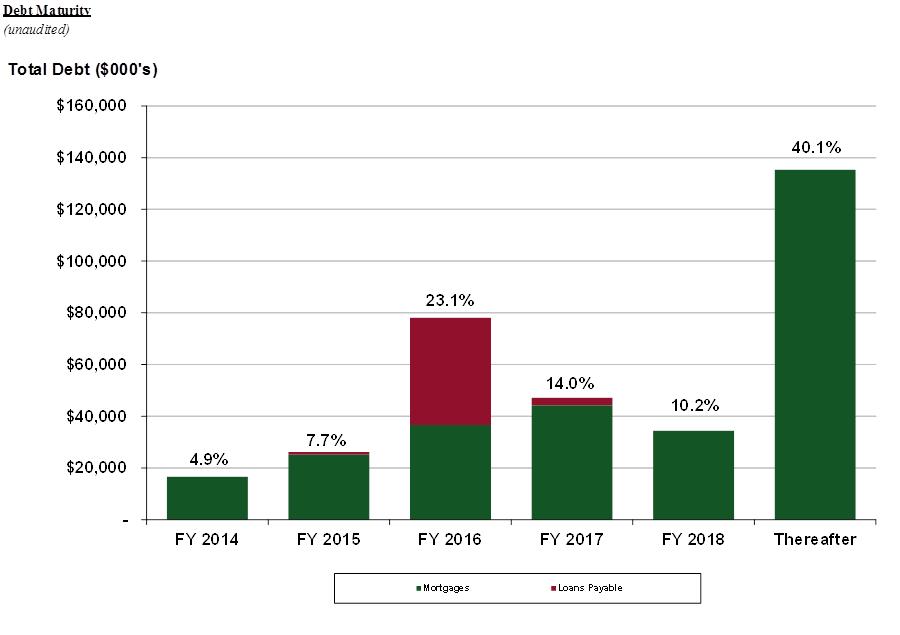
| 2014 |
|
$16,594,684 |
$-0- |
$16,594,684 |
4.9% |
| 2015 |
|
25,119,201 |
1,012,039 |
26,131,240 |
7.7% |
| 2016 |
|
36,610,174 |
41,270,163 |
77,880,337 |
23.1% |
| 2017 |
|
44,218,592 |
2,917,798 |
47,136,390 |
14.0% |
| 2018 |
|
34,372,002 |
-0- |
34,372,002 |
10.2% |
| Thereafter |
|
135,339,013 |
-0- |
135,339,013 |
40.1% |
| |
|
|
|
|
|
| Total as of 12/31/2013 |
|
$292,253,666 |
$45,200,000 |
$337,453,666 |
100.0% |
| |
|
|
|
|
|
|
Notes:
(1) Excludes $6.1 million of margin loans
which are due upon demand.
First Quarter FY 2014 Supplemental
of Monmouth Real Estate Investment Corp. Page 10 of 20
| Property Table by Tenant |
|
|
|
|
|
|
|
|
|
|
|
|
|
| (unaudited) |
|
|
|
|
Occupied |
|
|
|
|
|
|
|
|
| |
|
Property |
|
Square |
Square |
% of Total |
Annual |
% of Total |
Rent Per |
|
Undepreciated |
|
Mortgage |
| Tenant |
|
Count |
|
Footage |
Footage |
Sq. Ft. |
Rent |
Ann. Rent |
Sq. Ft. Occup. |
|
Cost |
|
Balance |
| |
|
|
|
|
|
|
|
|
|
|
|
|
|
| FedEx Ground Package System, Inc. |
|
27 |
|
3,026,716 |
3,026,716 |
28.3% |
$23,037,000 |
41.1% |
$7.61 |
|
$277,730,079 |
|
$116,236,945 |
| FedEx Corporation |
|
14 |
|
973,413 |
973,413 |
9.1% |
5,357,000 |
9.5% |
5.50 |
|
70,863,204 |
|
23,095,731 |
| FedEx Supply Chain Services, Inc. |
|
1 |
|
449,900 |
449,900 |
4.2% |
1,317,000 |
2.3% |
2.93 |
|
14,600,000 |
|
8,653,925 |
| Total FedEx |
|
42 |
|
4,450,029 |
4,450,029 |
41.6% |
29,711,000 |
53.0% |
6.68 |
|
363,193,283 |
|
147,986,600 |
| |
|
|
|
|
|
|
|
|
|
|
|
|
|
| Milwaukee Electric Tool Corp. |
|
1 |
|
615,305 |
615,305 |
5.7% |
1,978,000 |
3.5% |
3.21 |
|
27,368,816 |
|
16,233,190 |
| Ralcorp Holdings, Inc. |
|
1 |
|
558,600 |
558,600 |
5.2% |
2,133,000 |
3.8% |
3.82 |
|
26,633,125 |
|
18,425,584 |
| Woodstream Corporation |
|
1 |
|
388,671 |
256,000 |
2.4% |
896,000 |
1.6% |
3.50 |
|
13,128,850 |
|
2,024,769 |
| CBOCS Distribution, Inc. |
|
1 |
|
381,240 |
381,240 |
3.6% |
1,393,000 |
2.5% |
3.65 |
|
14,215,126 |
|
8,166,814 |
| Best Buy Warehousing Logistics, Inc. |
|
1 |
|
368,060 |
368,060 |
3.4% |
1,611,000 |
2.9% |
4.38 |
|
19,600,000 |
|
11,827,048 |
| Coca Cola / Western Container |
|
2 |
|
323,358 |
323,358 |
3.0% |
1,584,000 |
2.8% |
4.90 |
|
18,852,354 |
|
9,233,623 |
| Norton McNaughton of Squire, Inc. |
|
1 |
|
306,000 |
306,000 |
2.9% |
1,389,000 |
2.5% |
4.54 |
|
12,972,474 |
|
6,468,273 |
| International Paper |
|
1 |
|
280,000 |
280,000 |
2.6% |
1,304,000 |
2.3% |
4.66 |
|
18,085,492 |
|
12,496,671 |
| United Technologies Corporation |
|
2 |
|
244,317 |
244,317 |
2.3% |
1,876,000 |
3.3% |
7.68 |
|
22,451,041 |
|
9,725,882 |
| Anda Distribution |
|
1 |
|
234,660 |
234,660 |
2.2% |
1,186,000 |
2.1% |
5.05 |
|
14,550,000 |
|
10,206,467 |
| Caterpillar Logistics Services, Inc. |
|
1 |
|
218,120 |
218,120 |
2.0% |
1,169,000 |
2.1% |
5.36 |
|
14,868,857 |
|
7,750,142 |
| Anheuser-Busch, Inc. |
|
1 |
|
184,800 |
184,800 |
1.7% |
785,000 |
1.4% |
4.25 |
|
12,386,675 |
|
2,710,360 |
| Carlisle Tire & Wheel Company |
|
1 |
|
179,280 |
179,280 |
1.7% |
761,000 |
1.4% |
4.24 |
|
7,025,401 |
|
1,681,100 |
| Home Depot USA, Inc. |
|
1 |
|
171,200 |
171,200 |
1.6% |
896,000 |
1.6% |
5.23 |
|
11,298,367 |
|
-0- |
| Kellogg Sales Company |
|
3 |
|
170,279 |
170,279 |
1.6% |
1,035,000 |
1.8% |
6.08 |
|
11,884,916 |
|
3,211,697 |
| Maidenform, Inc. |
|
1 |
|
148,000 |
148,000 |
1.4% |
111,000 |
0.2% |
0.75 |
|
4,870,749 |
|
-0- |
| NF&M International |
|
1 |
(B) |
112,542 |
112,542 |
1.1% |
376,000 |
0.7% |
3.34 |
|
1,838,232 |
|
-0- |
| H.E.P. Direct, Inc. |
|
1 |
|
106,507 |
106,507 |
1.0% |
121,000 |
0.2% |
1.14 |
|
6,913,986 |
|
-0- |
| Pittsburgh Glass Works |
|
1 |
|
102,135 |
102,135 |
1.0% |
427,000 |
0.8% |
4.18 |
|
3,907,712 |
|
-0- |
| Holland 1916 Inc. |
|
1 |
|
95,898 |
95,898 |
0.9% |
333,000 |
0.6% |
3.47 |
|
7,344,498 |
|
-0- |
| National Oilwell Varco |
|
1 |
|
91,295 |
91,295 |
0.9% |
737,000 |
1.3% |
8.07 |
|
8,080,828 |
|
4,180,138 |
| Joseph T. Ryerson |
|
1 |
|
89,052 |
89,052 |
0.8% |
506,000 |
0.9% |
5.68 |
|
6,867,596 |
|
1,632,371 |
| DHL |
|
1 |
|
83,000 |
83,000 |
0.8% |
662,000 |
1.2% |
7.98 |
|
6,815,697 |
|
3,302,183 |
| Datatel Resources |
|
1 |
(B) |
80,856 |
80,856 |
0.8% |
222,000 |
0.4% |
2.75 |
|
1,320,681 |
|
-0- |
| Sherwin-Williams Company |
|
2 |
|
78,887 |
78,887 |
0.7% |
633,000 |
1.1% |
8.02 |
|
7,158,868 |
|
-0- |
| RGH Enterprises, Inc. |
|
1 |
|
75,000 |
75,000 |
0.7% |
584,000 |
1.0% |
7.79 |
|
5,525,600 |
|
4,050,230 |
| Tampa Bay Grand Prix |
|
1 |
|
68,385 |
68,385 |
0.6% |
281,000 |
0.5% |
4.11 |
|
5,651,066 |
|
2,365,941 |
| Various |
|
1 |
|
64,138 |
31,138 |
0.3% |
213,000 |
0.4% |
6.84 |
|
1,376,213 |
|
-0- |
| Macy’s East, Inc. |
|
1 |
|
59,400 |
59,400 |
0.6% |
226,000 |
0.4% |
3.80 |
|
4,838,592 |
|
2,284,475 |
| Siemens Real Estate |
|
1 |
|
51,130 |
51,130 |
0.5% |
462,000 |
0.8% |
9.04 |
|
4,416,000 |
|
2,863,726 |
| The American Bottling Company |
|
1 |
|
46,260 |
46,260 |
0.4% |
253,000 |
0.5% |
5.47 |
|
3,700,000 |
|
2,241,283 |
| Keystone Automotive |
|
1 |
|
36,270 |
36,270 |
0.3% |
137,000 |
0.2% |
3.78 |
|
2,161,895 |
|
-0- |
| Graybar Electric Company |
|
1 |
|
26,340 |
26,340 |
0.2% |
109,000 |
0.2% |
4.14 |
|
1,850,794 |
|
-0- |
| Tenant Total as of 12/31/2013 |
|
79 |
(B) |
10,489,014 |
10,323,343 |
96.4% |
$56,100,000 |
100.0% |
$5.43 |
|
$693,153,784 |
|
$291,068,566 |
| |
|
|
|
|
|
|
|
|
|
|
|
|
|
| Vacant |
|
2 |
|
219,425 |
-0- |
3.6% |
-0- |
0.0% |
-0- |
|
10,646,949 |
|
1,185,099 |
| Total as of 12/31/2013 |
|
81 |
|
10,708,439 |
10,323,343 |
100.0% |
$56,100,000 |
100.0% |
$5.43 |
|
$703,800,733 |
(A) |
$292,253,665 |
| |
|
|
|
|
|
|
|
|
|
|
|
|
|
| (A) | Does not include $63,156 of vacant land and corporate office leasehold improvements not associated with a specific tenant. |
| (B) | NF&M International and Datatel Resources are located at one property and therefore are counted as one property in the property
count total. |
First Quarter FY 2014 Supplemental
of Monmouth Real Estate Investment Corp. Page 11 of 20
|
Property Table by State |
|
|
|
|
|
|
|
|
|
|
|
|
| (unaudited) |
|
|
|
|
|
|
|
|
|
|
|
|
| |
|
Property |
Square |
Occupied Square |
% of Total |
Annual |
% of Total |
Rent Per |
|
Undepreciated |
|
Mortgage |
| State |
|
Count |
Footage |
Footage |
Sq. Ft. |
Rent |
Ann. Rent |
Sq. Ft. Occup. |
|
Cost |
|
Balance |
| Mississippi |
|
4 |
912,305 |
912,305 |
8.5% |
$3,343,000 |
6.0% |
$3.66 |
|
$45,247,611 |
|
$26,439,657 |
| Tennessee |
|
3 |
891,777 |
891,777 |
8.3% |
3,021,000 |
5.4% |
3.39 |
|
33,786,287 |
|
18,955,818 |
| Texas |
|
7 |
796,583 |
796,583 |
7.4% |
6,208,000 |
11.1% |
7.79 |
|
73,258,536 |
|
41,238,628 |
| Florida |
|
9 |
784,677 |
784,677 |
7.3% |
5,094,000 |
9.1% |
6.49 |
|
68,244,827 |
|
30,592,159 |
| Illinois |
|
7 |
720,439 |
720,439 |
6.7% |
4,721,000 |
8.4% |
6.55 |
|
61,216,799 |
|
8,606,250 |
| Ohio |
|
5 |
684,762 |
684,762 |
6.4% |
4,122,000 |
7.3% |
6.02 |
|
49,811,975 |
|
24,479,083 |
| Missouri |
|
4 |
651,771 |
519,100 |
6.1% |
2,006,000 |
3.6% |
3.86 |
|
29,129,434 |
|
4,632,445 |
| South Carolina |
|
3 |
574,715 |
574,715 |
5.4% |
3,478,000 |
6.2% |
6.05 |
|
35,958,707 |
|
11,582,942 |
| Kentucky |
|
1 |
558,600 |
558,600 |
5.2% |
2,133,000 |
3.8% |
3.82 |
|
26,633,125 |
|
18,425,584 |
| Kansas |
|
3 |
499,280 |
499,280 |
4.7% |
2,397,000 |
4.3% |
4.80 |
|
28,790,736 |
|
16,133,696 |
| Michigan |
|
3 |
489,571 |
489,571 |
4.6% |
3,472,000 |
6.2% |
7.09 |
|
40,999,671 |
|
21,513,123 |
| North Carolina |
|
3 |
414,507 |
254,507 |
3.9% |
232,000 |
0.4% |
0.91 |
|
17,274,557 |
|
1,185,099 |
| Virginia |
|
5 |
407,265 |
407,265 |
3.8% |
2,595,000 |
4.6% |
6.37 |
|
33,788,938 |
|
11,035,224 |
| Pennsylvania |
|
2 |
315,920 |
315,920 |
3.0% |
1,249,000 |
2.2% |
3.95 |
|
12,148,913 |
|
4,972,652 |
| Georgia |
|
3 |
307,662 |
307,662 |
2.9% |
1,767,000 |
3.1% |
5.74 |
|
22,124,662 |
|
9,049,382 |
| Arizona |
|
1 |
283,358 |
283,358 |
2.6% |
1,252,000 |
2.2% |
4.42 |
|
15,172,511 |
|
7,277,697 |
| Wisconsin |
|
2 |
238,666 |
238,666 |
2.2% |
1,369,000 |
2.4% |
5.74 |
|
15,943,672 |
|
5,111,184 |
| New York |
|
3 |
230,381 |
230,381 |
2.2% |
1,903,000 |
3.4% |
8.26 |
|
20,148,376 |
|
5,160,803 |
| Oklahoma |
|
2 |
166,172 |
166,172 |
1.6% |
966,000 |
1.7% |
5.81 |
|
13,304,165 |
|
7,866,034 |
| Maryland |
|
1 |
144,523 |
144,523 |
1.3% |
1,426,000 |
2.5% |
9.87 |
|
14,386,784 |
|
6,695,087 |
| Colorado |
|
2 |
138,235 |
138,235 |
1.3% |
1,208,000 |
2.2% |
8.74 |
|
13,549,167 |
|
3,869,947 |
| New Jersey |
|
2 |
123,538 |
90,538 |
1.2% |
439,000 |
0.8% |
4.85 |
|
6,214,805 |
|
2,284,475 |
| Minnesota |
|
2 |
119,823 |
60,398 |
1.1% |
372,000 |
0.7% |
6.16 |
|
10,377,126 |
|
3,234,256 |
| Nebraska |
|
1 |
89,115 |
89,115 |
0.8% |
446,000 |
0.8% |
5.00 |
|
5,929,890 |
|
-0- |
| Alabama |
|
1 |
73,712 |
73,712 |
0.7% |
412,000 |
0.7% |
5.59 |
|
4,751,741 |
|
1,308,420 |
| Connecticut |
|
1 |
54,812 |
54,812 |
0.5% |
332,000 |
0.6% |
6.06 |
|
3,445,824 |
|
604,020 |
| Iowa |
|
1 |
36,270 |
36,270 |
0.3% |
137,000 |
0.2% |
3.78 |
|
2,161,895 |
|
-0- |
| Total as of 12/31/2013 |
|
81 |
10,708,439 |
10,323,343 |
100.0% |
$56,100,000 |
100.0% |
$5.43 |
|
$703,800,733 |
(A) |
$292,253,665 |
| |
|
|
|
|
|
|
|
|
|
|
|
|
| |
|
|
|
|
|
|
|
|
|
|
|
|
|
| (A) | Does not include $63,156 of vacant land and corporate office leasehold improvements not associated with a specific tenant. |
First Quarter FY 2014 Supplemental
of Monmouth Real Estate Investment Corp. Page 12 of 20
| Lease Expirations |
|
|
|
|
|
|
|
|
|
|
|
|
|
| (unaudited) |
|
|
|
|
|
|
|
|
|
|
|
|
|
| |
|
Property |
|
Square |
% of Total |
Annual |
% of Total |
Rent Per Sq. |
Lease Exp. |
|
Undepreciated |
|
Mortgage |
| Fiscal Year |
|
Count |
|
Footage |
Sq. Ft. |
Rent |
Ann. Rent |
Ft. Occup. |
Term in Years |
|
Cost |
|
Balance |
| |
|
|
|
|
|
|
|
|
|
|
|
|
|
| 2014 |
|
4 |
|
349,907 |
3.3% |
$528,000 |
0.9% |
$1.51 |
0.1 |
|
$18,101,326 |
|
$2,284,475 |
| 2015 |
|
6 |
|
782,302 |
7.3% |
3,831,000 |
6.8% |
4.90 |
1.3 |
|
41,621,772 |
|
9,075,950 |
| 2016 |
|
3 |
(B) |
325,656 |
3.0% |
1,315,000 |
2.3% |
4.04 |
2.3 |
|
18,418,397 |
|
2,710,360 |
| 2017 |
|
14 |
|
1,756,798 |
16.4% |
9,731,000 |
17.3% |
5.99 |
3.4 |
|
122,861,936 |
|
40,757,764 |
| 2018 |
|
11 |
(B) |
1,011,363 |
9.4% |
6,463,000 |
11.5% |
6.39 |
4.4 |
|
71,931,907 |
|
25,550,975 |
| 2019 |
|
8 |
|
1,179,228 |
11.0% |
6,685,000 |
11.9% |
5.67 |
5.3 |
|
80,794,475 |
|
32,984,375 |
| 2020 |
|
1 |
|
68,385 |
0.6% |
281,000 |
0.5% |
4.11 |
6.8 |
|
5,651,066 |
|
2,365,941 |
| 2021 |
|
4 |
|
271,768 |
2.5% |
1,755,000 |
3.1% |
6.46 |
7.6 |
|
20,354,197 |
|
11,576,368 |
| 2022 |
|
9 |
|
1,249,738 |
11.7% |
7,256,000 |
12.9% |
5.81 |
8.3 |
|
86,164,202 |
|
51,691,186 |
| 2023 |
|
12 |
|
2,031,705 |
19.0% |
10,809,000 |
19.3% |
5.32 |
9.5 |
|
141,060,563 |
|
75,946,962 |
| 2024 |
|
6 |
|
839,426 |
7.8% |
5,100,000 |
9.1% |
6.08 |
10.3 |
|
58,184,605 |
|
17,698,626 |
| 2034 |
|
1 |
|
558,600 |
5.2% |
2,133,000 |
3.8% |
3.82 |
19.8 |
|
26,633,125 |
|
18,425,584 |
| Various |
|
1 |
|
64,138 |
0.6% |
213,000 |
0.4% |
6.84 |
-0- |
|
1,376,213 |
|
- |
| Vacant |
|
2 |
|
219,425 |
2.0% |
-0- |
0.0% |
-0- |
-0- |
|
10,646,949 |
|
1,185,099 |
| Total as of 12/31/2013 |
|
81 |
(B) |
10,708,439 |
100.0% |
$56,100,000 |
100.0% |
$5.43 |
6.8 |
|
$703,800,733 |
(A) |
$292,253,665 |
| |
|
|
|
|
|
|
|
|
|
|
|
|
|
(A) Does not include $63,156 of vacant land and
corporate office leasehold improvements not associated with a specific tenant.
(B) Included in
2016 is Datatel Resources and included in 2018 is NF&M International which both occupy one property and therefore are counted
as one property in the property count total.
First Quarter FY 2014 Supplemental
of Monmouth Real Estate Investment Corp. Page 13 of 20
| Recent Acquisitions During Fiscal 2014 |
|
|
|
|
|
|
|
|
|
|
|
|
| (unaudited) |
|
|
|
|
|
|
|
|
|
|
|
|
| |
|
|
|
|
Fiscal Year |
Square |
Annual |
Rent Per |
Lease |
|
Undepreciated |
|
Initial Mortgage |
| No |
Tenant |
City (MSA) |
State |
|
Acquisition |
Footage |
Rent |
Sq. Ft. Occup. |
Expiration |
|
Cost |
|
Balance |
| 1 |
Dr Pepper Snapple |
Tulsa |
OK |
|
2014 |
46,260 |
$ 253,000 |
$5.47 |
2/28/2024 |
|
$3,700,000 |
|
$2,250,000 |
| 2 |
Ralcorp Holdings, Inc./ConAgra |
Buckner (Louisville) |
KY |
|
2014 |
558,600 |
2,133,000 |
3.82 |
10/31/2033 |
|
26,633,125 |
|
18,475,000 |
| 3 |
International Paper |
Edwardsville (Kansas City) |
KS |
|
2014 |
280,000 |
1,304,000 |
4.66 |
8/31/2023 |
|
18,085,492 |
|
12,550,000 |
| 4 |
FedEx Ground |
Altoona |
PA |
|
2014 |
122,522 |
651,000 |
5.31 |
8/31/2023 |
|
8,990,000 |
|
5,000,000 |
| 5 |
FedEx Ground |
Spring (Houston) |
TX |
|
2014 |
114,923 |
1,146,000 |
9.97 |
8/31/2023 |
|
15,281,318 |
|
10,630,000 |
| |
As of 12/31/2013 |
|
|
|
|
1,122,305 |
$5,487,000 |
$4.89 |
|
|
$72,689,935 |
|
$48,905,000 |
| |
|
|
|
|
|
|
|
|
|
|
|
|
|
First Quarter FY 2014 Supplemental
of Monmouth Real Estate Investment Corp. Page 14 of 20
| Property Table |
|
|
|
|
|
|
|
|
|
|
|
| (unaudited) |
|
|
|
|
|
|
|
Rent Per |
|
|
|
| |
|
|
|
|
Fiscal Year |
|
Square |
Annual |
Sq. Ft. |
Lease Exp. |
Undepreciated |
Mortgage |
| No |
Tenant |
|
City (MSA) |
State |
Acquisition |
Occup. |
Footage |
Rent |
Occup. |
Term in Years |
Cost |
Balance |
| |
|
|
|
|
|
|
|
|
|
|
|
|
| 1 |
Milwaukee Electric Tool Corp. |
|
Olive Branch (Memphis, TN) |
MS |
2013 |
100.0% |
615,305 |
$1,978,000 |
$3.21 |
9.3 |
$27,368,816 |
$16,233,190 |
| 2 |
Ralcorp Holdings, Inc./ConAgra |
|
Buckner (Louisville) |
KY |
2014 |
100.0% |
558,600 |
2,133,000 |
3.82 |
20.1 |
26,633,125 |
18,425,584 |
| 3 |
FedEx Supply Chain Services, Inc. |
|
Memphis |
TN |
2010 |
100.0% |
449,900 |
1,317,000 |
2.93 |
5.4 |
14,600,000 |
8,653,925 |
| 4 |
Woodstream Corporation |
|
St. Joseph |
MO |
2001 |
65.9% |
388,671 |
896,000 |
3.50 |
3.8 |
13,128,850 |
2,024,769 |
| 5 |
CBOCS Distribution, Inc. |
|
Lebanon (Nashville) |
TN |
2011 |
100.0% |
381,240 |
1,393,000 |
3.65 |
10.5 |
14,215,126 |
8,166,814 |
| 6 |
Best Buy Warehousing Logistics, Inc. |
|
Streetsboro (Cleveland) |
OH |
2012 |
100.0% |
368,060 |
1,611,000 |
4.38 |
8.1 |
19,600,000 |
11,827,048 |
| 7 |
Norton McNaughton of Squire, Inc. |
|
Hanahan (Charleston) |
SC |
2005 |
100.0% |
306,000 |
1,389,000 |
4.54 |
1.3 |
12,972,474 |
6,468,273 |
| 8 |
Western Container Corp |
|
Tolleson (Phoenix) |
AZ |
2003 |
100.0% |
283,358 |
1,252,000 |
4.42 |
3.3 |
15,172,511 |
7,277,697 |
| 9 |
International Paper |
|
Edwardsville (Kansas City) |
KS |
2014 |
100.0% |
280,000 |
1,303,000 |
4.65 |
9.9 |
18,085,492 |
12,496,671 |
| 10 |
FedEx Ground Package System, Inc. |
|
Orion |
MI |
2007 |
100.0% |
245,633 |
1,908,000 |
7.77 |
9.5 |
22,816,058 |
9,919,820 |
| 11 |
Anda Distribution |
|
Olive Branch (Memphis, TN) |
MS |
2012 |
100.0% |
234,660 |
1,186,000 |
5.05 |
8.6 |
14,550,000 |
10,206,467 |
| 12 |
Caterpillar Logistics Services, Inc. |
|
Griffin (Atlanta) |
GA |
2006 |
100.0% |
218,120 |
1,169,000 |
5.36 |
2.9 |
14,868,857 |
7,750,142 |
| 13 |
NF&M International |
(B) |
Monaca (Pittsburgh) |
PA |
1988 |
100.0% |
112,542 |
376,000 |
3.34 |
4.8 |
1,838,232 |
- |
| |
Datatel Resources |
(B) |
Monaca (Pittsburgh) |
PA |
1988 |
100.0% |
80,856 |
222,000 |
2.75 |
1.9 |
1,320,681 |
- |
| 14 |
Anheuser-Busch, Inc. |
|
Granite City (St. Louis) |
IL |
2001 |
100.0% |
184,800 |
785,000 |
4.25 |
2.4 |
12,386,675 |
2,710,360 |
| 15 |
United Technologies Corporation |
|
Carrollton (Dallas) |
TX |
2002 |
100.0% |
184,317 |
1,568,000 |
8.51 |
5.0 |
17,740,000 |
9,725,882 |
| 16 |
Carlisle Tire & Wheel Company |
|
Edwardsville (Kansas City) |
KS |
2003 |
100.0% |
179,280 |
761,000 |
4.24 |
4.4 |
7,025,401 |
1,681,100 |
| 17 |
FedEx Ground Package System, Inc. |
|
Ft. Mill (Charlotte, NC) |
SC |
2010 |
100.0% |
176,939 |
1,414,000 |
7.99 |
9.8 |
15,371,580 |
3,328,535 |
| 18 |
FedEx Ground Package System, Inc. |
|
Livonia (Detroit) |
MI |
2013 |
100.0% |
172,005 |
1,194,000 |
6.94 |
8.3 |
13,700,000 |
8,999,656 |
| 19 |
Home Depot USA, Inc. |
|
Montgomery (Chicago) |
IL |
2004 |
100.0% |
171,200 |
896,000 |
5.23 |
1.5 |
11,298,367 |
- |
| 20 |
FedEx Ground Package System, Inc. |
|
Tampa |
FL |
2001 |
100.0% |
170,779 |
1,412,000 |
8.27 |
5.1 |
17,755,625 |
8,409,759 |
| 21 |
Vacant |
|
Monroe |
NC |
2002 |
100.0% |
160,000 |
-0- |
na |
- |
5,489,822 |
1,185,099 |
| 22 |
Maidenform, Inc. |
|
Fayetteville |
NC |
1997 |
100.0% |
148,000 |
111,000 |
0.75 |
(C) |
4,870,749 |
- |
| 23 |
FedEx Ground Package System, Inc. |
|
Beltsville (Washington, DC) |
MD |
2001 |
100.0% |
144,523 |
1,426,000 |
9.87 |
4.6 |
14,386,784 |
6,695,087 |
| 24 |
FedEx Ground Package System, Inc. |
|
El Paso |
TX |
2006 |
100.0% |
143,619 |
1,045,000 |
7.28 |
9.8 |
11,232,648 |
4,181,335 |
| 25 |
FedEx Ground Package System, Inc. |
|
Cudahy (Milwaukee) |
WI |
2001 |
100.0% |
139,564 |
901,000 |
6.46 |
3.5 |
9,373,672 |
1,075,275 |
| 26 |
FedEx Ground Package System, Inc. |
|
Wheeling (Chicago) |
IL |
2003 |
100.0% |
123,000 |
1,386,000 |
11.27 |
3.4 |
18,537,652 |
4,263,519 |
| 27 |
FedEx Ground Package System, Inc. |
|
Altoona |
PA |
2014 |
100.0% |
122,522 |
651,000 |
5.31 |
9.9 |
8,990,000 |
4,972,652 |
| 28 |
FedEx Ground Package System, Inc. |
|
Oklahoma City |
OK |
2012 |
100.0% |
119,912 |
713,000 |
5.95 |
8.3 |
9,604,165 |
5,624,751 |
| 29 |
FedEx Ground Package System, Inc. |
|
Spring (Houston) |
TX |
2014 |
100.0% |
114,923 |
1,146,000 |
9.97 |
9.9 |
15,281,318 |
10,630,000 |
| 30 |
FedEx Ground Package System, Inc. |
|
Edinburg |
TX |
2011 |
100.0% |
113,582 |
598,000 |
5.26 |
7.7 |
7,426,242 |
4,233,648 |
| 31 |
FedEx Corporation |
|
Mechanicsville (Richmond) |
VA |
2001 |
100.0% |
112,799 |
541,000 |
4.80 |
9.3 |
7,718,163 |
1,080,719 |
| 32 |
FedEx Corporation |
|
Orlando |
FL |
2008 |
100.0% |
110,638 |
666,000 |
6.02 |
3.9 |
8,541,237 |
4,936,224 |
| 33 |
H.E.P. Direct, Inc. |
|
Winston-Salem |
NC |
2002 |
100.0% |
106,507 |
121,000 |
1.14 |
0.2 |
6,913,986 |
- |
| 34 |
FedEx Ground Package System, Inc. |
|
Cheektowaga (Buffalo) |
NY |
2000 |
100.0% |
104,981 |
966,000 |
9.20 |
5.7 |
10,932,057 |
1,110,573 |
| 35 |
FedEx Ground Package System, Inc. |
|
West Chester Twp (Cincinnati) |
OH |
1999 |
100.0% |
103,818 |
520,000 |
5.01 |
9.7 |
5,651,135 |
2,678,151 |
| 36 |
FedEx Ground Package System, Inc. |
|
Roanoke |
VA |
2013 |
100.0% |
103,402 |
755,000 |
7.30 |
9.3 |
10,200,000 |
6,484,260 |
| 37 |
Fedex Ground Package System. Inc. |
|
Waco |
TX |
2012 |
100.0% |
102,594 |
659,000 |
6.42 |
8.4 |
8,733,000 |
5,494,477 |
| 38 |
Pittsburgh Glass Works |
|
O' Fallon (St. Louis) |
MO |
1994 |
100.0% |
102,135 |
427,000 |
4.18 |
1.5 |
3,907,712 |
- |
| 39 |
Fedex Ground Package System. Inc. |
|
Green Bay |
WI |
2013 |
100.0% |
99,102 |
468,000 |
4.72 |
9.4 |
6,570,000 |
4,035,909 |
| 40 |
Holland 1916 Inc. |
|
Liberty (Kansas City) |
MO |
1998 |
100.0% |
95,898 |
333,000 |
3.47 |
5.5 |
7,344,498 |
- |
| 41 |
FedEx Corporation |
|
Jacksonville |
FL |
1999 |
100.0% |
95,883 |
518,000 |
5.40 |
5.4 |
6,155,500 |
2,220,510 |
| 42 |
FedEx Corporation |
|
Tampa |
FL |
2006 |
100.0% |
95,662 |
603,000 |
6.30 |
3.8 |
7,565,717 |
4,508,471 |
| 43 |
FedEx Ground Package System, Inc. |
|
Hanahan (Charleston) |
SC |
2005 |
100.0% |
91,776 |
675,000 |
7.35 |
4.6 |
7,614,653 |
1,786,134 |
| 44 |
National Oilwell Varco |
|
Houston |
TX |
2010 |
100.0% |
91,295 |
737,000 |
8.07 |
8.8 |
8,080,828 |
4,180,138 |
| 45 |
FedEx Corporation |
|
Omaha |
NE |
1999 |
100.0% |
89,115 |
446,000 |
5.00 |
9.8 |
5,929,890 |
- |
| 46 |
FedEx Ground Package System, Inc. |
|
Cocoa |
FL |
2008 |
100.0% |
89,101 |
739,000 |
8.29 |
2.9 |
11,507,074 |
5,846,399 |
| 47 |
Joseph T. Ryerson |
|
Elgin (Chicago) |
IL |
2002 |
100.0% |
89,052 |
506,000 |
5.68 |
3.1 |
6,867,596 |
1,632,371 |
| |
|
|
|
|
|
|
|
|
|
|
|
|
First Quarter FY 2014 Supplemental
of Monmouth Real Estate Investment Corp. Page 15 of 20
| Property Table |
|
|
|
|
|
|
|
Rent |
|
|
|
|
| (unaudited) |
|
|
|
|
|
|
|
Per |
|
|
|
|
| |
|
|
|
Fiscal Year |
|
Square |
Annual |
Sq. Ft. |
Lease Exp. |
Undepreciated |
|
Mortgage |
| No |
Tenant |
City (MSA) |
State |
Acquisition |
Occup. |
Footage |
Rent |
Occup. |
Term in Years |
Cost |
|
Balance |
| |
|
|
|
|
|
|
|
|
|
|
|
|
| |
|
|
|
|
|
|
|
|
|
|
|
|
| 48 |
FedEx Ground Package System, Inc. |
Ft. Myers |
FL |
2003 |
100.0% |
87,500 |
416,000 |
4.75 |
0.8 |
5,004,126 |
|
- |
| 49 |
DHL |
Roanoke |
VA |
2007 |
100.0% |
83,000 |
$662,000 |
$7.98 |
2.9 |
$6,815,697 |
|
$3,302,183 |
| 50 |
FedEx Corporation |
Bedford Heights (Cleveland) |
OH |
2007 |
100.0% |
82,269 |
408,000 |
4.96 |
4.7 |
6,716,832 |
|
3,148,165 |
| 51 |
FedEx Ground Package System, Inc. |
Richfield (Cleveland) |
OH |
2006 |
100.0% |
79,485 |
1,121,000 |
14.10 |
10.8 |
13,428,008 |
|
3,961,994 |
| 52 |
RGH Enterprises, Inc. |
Halfmoon (Albany) |
NY |
2012 |
100.0% |
75,000 |
584,000 |
7.79 |
7.9 |
5,525,600 |
|
4,050,230 |
| 53 |
FedEx Ground Package System, Inc. |
Huntsville |
AL |
2005 |
100.0% |
73,712 |
412,000 |
5.59 |
8.7 |
4,751,741 |
|
1,308,420 |
| 54 |
FedEx Corporation |
Schaumburg (Chicago) |
IL |
1997 |
100.0% |
73,500 |
515,000 |
7.01 |
3.2 |
4,967,639 |
|
- |
| 55 |
FedEx Corporation |
Romulus (Detroit) |
MI |
1998 |
100.0% |
71,933 |
370,000 |
5.14 |
7.4 |
4,483,613 |
|
2,593,646 |
| 56 |
FedEx Ground Package System, Inc. |
Denver |
CO |
2005 |
100.0% |
69,865 |
564,000 |
8.07 |
4.6 |
6,354,051 |
|
1,828,863 |
| 57 |
Tampa Bay Grand Prix |
Tampa |
FL |
2005 |
100.0% |
68,385 |
281,000 |
4.11 |
6.8 |
5,651,066 |
|
2,365,941 |
| 58 |
FedEx Ground Package System, Inc. |
Colorado Springs |
CO |
2006 |
100.0% |
68,370 |
644,000 |
9.42 |
4.8 |
7,195,115 |
|
2,041,084 |
| 59 |
Sherwin-Williams Company |
Rockford |
IL |
2011 |
100.0% |
66,387 |
473,000 |
7.12 |
10.0 |
5,540,000 |
|
- |
| 60 |
Kellogg Sales Company |
Kansas City |
MO |
2007 |
100.0% |
65,067 |
350,000 |
5.38 |
1.6 |
4,748,374 |
|
2,607,677 |
| 61 |
Various |
Somerset |
NJ |
1970 |
48.5% |
64,138 |
213,000 |
6.84 |
N/A |
1,376,213 |
|
- |
| 62 |
FedEx Corporation |
Chattanooga |
TN |
2007 |
100.0% |
60,637 |
311,000 |
5.13 |
3.8 |
4,971,161 |
|
2,135,080 |
| 63 |
FedEx Ground Package System, Inc. |
Stewartville (Rochester) |
MN |
2013 |
100.0% |
60,398 |
372,000 |
6.16 |
9.4 |
5,220,000 |
|
3,234,256 |
| 64 |
United Technologies Corporation |
Richmond |
VA |
2004 |
100.0% |
60,000 |
308,000 |
5.13 |
2.4 |
4,711,041 |
|
- |
| 65 |
Vacant |
White Bear Lake (Minneapolis/St. Paul) |
MN |
2001 |
- |
59,425 |
-0- |
na |
- |
5,157,126 |
|
- |
| 66 |
Macy’s East, Inc. |
Carlstadt (New York, NY) |
NJ |
2001 |
100.0% |
59,400 |
226,000 |
3.80 |
0.2 |
4,838,592 |
|
2,284,475 |
| 67 |
FedEx Ground Package System, Inc. |
Augusta |
GA |
2005 |
100.0% |
59,358 |
477,000 |
8.04 |
4.5 |
5,328,873 |
|
1,299,240 |
| 68 |
Kellogg Sales Company |
Newington (Hartford) |
CT |
2001 |
100.0% |
54,812 |
332,000 |
6.06 |
3.2 |
3,445,824 |
|
604,020 |
| 69 |
Siemens Real Estate |
Lebanon (Cincinnati) |
OH |
2012 |
100.0% |
51,130 |
462,000 |
9.04 |
5.3 |
4,416,000 |
|
2,863,726 |
| 70 |
Kellogg Sales Company |
Orangeburg (New York) |
NY |
1993 |
100.0% |
50,400 |
353,000 |
7.00 |
1.2 |
3,690,718 |
|
- |
| 71 |
FedEx Corporation |
Charlottesville |
VA |
1999 |
100.0% |
48,064 |
329,000 |
6.85 |
3.7 |
4,344,037 |
|
168,062 |
| 72 |
Dr Pepper Snapple |
Tulsa |
OK |
2014 |
100.0% |
46,260 |
254,000 |
5.49 |
10.4 |
3,700,000 |
|
2,241,283 |
| 73 |
FedEx Ground Package System, Inc. |
Corpus Christi |
TX |
2012 |
100.0% |
46,253 |
455,000 |
9.84 |
7.7 |
4,764,500 |
|
2,793,149 |
| 74 |
Coca Cola Enterprises, Inc. |
Topeka |
KS |
2009 |
100.0% |
40,000 |
332,000 |
8.30 |
7.8 |
3,679,843 |
|
1,955,926 |
| 75 |
Keystone Automotive |
Urbandale (Des Moines) |
IA |
1994 |
100.0% |
36,270 |
137,000 |
3.78 |
3.2 |
2,161,895 |
|
- |
| 76 |
FedEx Corporation |
Richland (Jackson) |
MS |
1994 |
100.0% |
36,000 |
70,000 |
1.94 |
0.2 |
1,478,000 |
|
- |
| 77 |
FedEx Corporation |
Punta Gorda |
FL |
2007 |
100.0% |
34,624 |
304,000 |
8.78 |
3.5 |
4,104,915 |
|
2,304,856 |
| 78 |
FedEx Corporation |
Lakeland |
FL |
2006 |
100.0% |
32,105 |
155,000 |
4.83 |
3.9 |
1,959,568 |
|
- |
| 79 |
FedEx Corporation |
Augusta |
GA |
2006 |
100.0% |
30,184 |
121,000 |
4.01 |
8.9 |
1,926,932 |
|
- |
| 80 |
Graybar Electric Company |
Ridgeland (Jackson) |
MS |
1993 |
100.0% |
26,340 |
109,000 |
4.14 |
5.6 |
1,850,794 |
|
- |
| 81 |
Sherwin-Williams Company |
Burr Ridge (Chicago) |
IL |
1997 |
100.0% |
12,500 |
160,000 |
12.80 |
7.8 |
1,618,868 |
|
- |
| |
Total as of 12/31/2013 |
|
|
|
96.4% |
10,708,439 |
$56,100,000 |
$5.43 |
6.8 |
$703,800,733 |
(A) |
$292,253,665 |
| |
|
|
|
|
|
|
|
|
|
|
|
|
| |
|
|
|
|
|
|
|
|
|
|
|
|
|
(A) Does not include $63,156 of vacant land and
corporate office leasehold improvements not associated with a specific tenant.
(B) Both tenants occupy one property.
(C) Maidenform is currently leasing the space on a
month-to-month basis, lease expired December 31, 2013.
First Quarter FY 2014 Supplemental
of Monmouth Real Estate Investment Corp. Page 16 of 20
| |
|
|
|
|
|
|
|
|
|
|
| |
|
|
 |
|
|
|
|
| |
|
|
|
|
|
|
| |
|
|
|
|
|
|
| |
|
|
|
|
|
|
| |
|
|
|
|
|
|
| |
|
|
|
|
|
|
| |
|
|
|
|
|
|
| |
|
|
|
|
|
|
|
|
|
|
| Definitions |
|
| |
|
|
|
|
|
|
|
|
|
|
|
Investors and analysts following the real estate industry
utilize funds from operations ("FFO"), core funds from operations ("Core FFO"), net operating income ("NOI"),
earnings before interest, taxes, depreciation and amortization ("EBITDA") and adjusted funds from operations ("AFFO"),
variously defined, as supplemental performance measures. While the Company believes net income available to common stockholders,
as defined by accounting principles generally accepted in the United States of America (US GAAP), is the most appropriate measure,
it considers NOI, EBITDA, FFO, Core FFO and AFFO, given their wide use by and relevance to investors and analysts, appropriate
supplemental performance measures. FFO, reflecting the assumption that real estate asset values rise or fall with market conditions,
principally adjusts for the effects of US GAAP depreciation and amortization of real estate assets. Core FFO reflects the same
assumptions as FFO except that is also adjusts for the effects of acquisitions costs. NOI provides a measure of rental operations,
and does not factor in depreciation and amortization and non-property specific expenses such as general and administrative expenses.
EBITDA provides a tool to further evaluate the ability to incur and service debt and to fund dividends and other cash needs. AFFO
provides a tool to further evaluate the ability to fund dividends. In addition, NOI, EBITDA, FFO, Core FFO and AFFO are commonly
used in various ratios, pricing multiples, yields and returns and valuation of calculations used to measure financial position,
performance and value. |
|
| |
| |
| |
| |
| |
| |
| |
| |
| As used herein, the Company calculates FFO, as defined by The National Association of Real Estate Investment Trusts (NAREIT), to be equal to net income (loss) applicable to common shareholders, as defined by US GAAP, excluding extraordinary items as defined under US GAAP, gains or losses from sales of previously depreciated real estate assets, impairment charges related to depreciable real estate assets, plus certain non-cash items such as real estate asset depreciation and amortization. FFO includes gains and losses realized on securities investments. |
|
| |
| |
|
|
|
|
|
|
|
|
|
|
| Core FFO is calculated as FFO plus acquisition costs. |
|
|
|
|
|
|
|
| |
|
|
|
|
|
|
|
|
|
|
| NOI is calculated as recurring revenues of the Company, less property expenses such as real estate taxes, repairs and maintenance, property management, utilities, insurance and other expenses. NOI excludes realized gains (losses) on securities transactions. |
|
| |
| |
|
|
|
|
|
|
|
|
|
|
| EBITDA is calculated as NOI, less general and administrative expenses, less NOI from discontinued operations, plus interest and dividend income. EBITDA excludes realized gains (losses) on securities transactions and interest expense. |
|
| |
| |
|
|
|
|
|
|
|
|
|
|
| AFFO is calculated as EBITDA, minus US GAAP interest expense, minus preferred stock dividends, minus recurring capital expenditures and straight-line rents, plus stock option expense. AFFO excludes realized gains (losses) on securities transactions. |
|
| |
NOI, EBITDA, FFO, Core FFO and AFFO do not represent cash generated from operating activities in accordance with US GAAP and are not necessarily indicative of cash available to fund cash needs, including the repayment of principal on debt and payment of dividends and distributions. NOI, EBITDA, FFO Core FFO and
AFFO should not be considered as substitutes for net income applicable to common shareholders (calculated in accordance with US GAAP) as a measure of results of operations or cash flows (calculated in accordance with US GAAP) as a measure of liquidity. NOI, EBITDA, FFO, Core FFO and AFFO as currently calculated by the Company may not be comparable to similarly titled, but variously calculated, measures of other REITs. |
|
| |
| |
| |
| |
First Quarter FY 2014 Supplemental
of Monmouth Real Estate Investment Corp. Page 17 of 20
FOR IMMEDIATE RELEASE February 5, 2014
Contact: Susan Jordan
732-577-9996
MONMOUTH REAL ESTATE INVESTMENT
CORPORATION
REPORTS RESULTS FOR THE FIRST QUARTER
ENDED DECEMBER 31, 2013
FREEHOLD, NJ,
February 5, 2014........ Monmouth Real Estate Investment Corporation (NYSE:MNR) reported Core Funds from Operations (Core FFO)
of $6,747,000 or $0.15 per diluted share for the three months ended December 31, 2013 as compared to $7,459,000 or $0.18 per diluted
share for the three months ended December 31, 2012. Excluding gains realized from the sale of securities during the quarter, Core
FFO was $6,596,000 or $0.15 per diluted share for the three months ended December 31, 2013, as compared to $5,348,000 or $0.13
per diluted share for the three months ended December 31, 2012. Adjusted Funds from Operations (AFFO), which excludes gains or
losses from the sale of securities, were $0.15 per diluted share for the three months ended December 31, 2013 compared to $0.13
per diluted share for December 31, 2012.
A summary of significant
financial information for the three months ended December 31, 2013 and 2012 is as follows:
| |
|
Three Months Ended
December 31, |
| |
|
2013 |
|
2012 |
| Rental Revenue |
$ |
13,571,000 |
$ |
11,309,000 |
| Reimbursement Revenue |
$ |
2,090,000 |
$ |
1,518,000 |
| Net Operating Income (NOI) (1) |
$ |
13,085,000 |
$ |
11,112,000 |
| Total Expenses |
$ |
8,416,000 |
$ |
6,985,000 |
| Interest and Dividend Income |
$ |
939,000 |
$ |
1,123,000 |
| Gain on Sale of Securities Transactions, net |
$ |
151,000 |
$ |
2,111,000 |
| Income from Continuing Operations |
$ |
4,290,000 |
$ |
5,711,000 |
| Loss from Discontinued Operations |
$ |
-0- |
$ |
(4,000) |
| Net Income Attributable to Common Shareholders |
$ |
2,138,000 |
$ |
3,555,000 |
| Net Income Attributable to Common Shareholders Per Diluted Common Share |
$ |
0.05 |
$ |
0.09 |
| Core FFO (1) |
$ |
6,747,000 |
$ |
7,459,000 |
| Core FFO per Diluted Common Share (1) |
$ |
0.15 |
$ |
0.18 |
| AFFO (1) |
$ |
6,692,000 |
$ |
5,532,000 |
| AFFO per Diluted Common Share (1) |
$ |
0.15 |
$ |
0.13 |
| |
|
|
|
|
| |
|
|
|
|
| Weighted Avg. Diluted Common Shares Outstanding |
|
45,331,000 |
|
41,110,000 |
A summary of
significant balance sheet information as of December 31, 2013 and September 30, 2013 is as follows:
| |
|
December 31, 2013 |
|
September 30, 2013 |
| Net Real Estate Investments |
$ |
608,955,000 |
$ |
536,799,000 |
| Securities Available for Sale at Fair Value |
$ |
53,596,000 |
$ |
45,452,000 |
| Total Assets |
$ |
697,862,000 |
$ |
617,241,000 |
| Mortgage Notes Payable |
$ |
292,254,000 |
$ |
250,093,000 |
| Loans Payable |
$ |
51,278,000 |
$ |
22,200,000 |
| Total Shareholders’ Equity |
$ |
343,768,000 |
$ |
335,915,000 |
First Quarter FY 2014 Supplemental
of Monmouth Real Estate Investment Corp. Page 18 of 20
Michael P. Landy, President
and CEO, commented on the results for the first quarter of fiscal 2014:
“This
was a very productive quarter for Monmouth and represents an excellent start to fiscal 2014. We are pleased to report continued
improvement in our recurring cash flow driven by our successful acquisition program. During the quarter
we acquired five new built-to-suit properties, all net-leased to investment grade tenants. These acquisitions contain a
total of 1.1 million square feet, and were purchased at an aggregate cost of $73.9 million. These
five single-tenant Class A industrial properties are leased to: The American Bottling Company (a division of Dr Pepper Snapple
Group), Ralcorp (a division of ConAgra Foods), International Paper Company, and FedEx Ground. The lease terms range from 10 to
20 years with a weighted average term of 15.2 years. These acquisitions represent a 12% increase in our gross leasable area.”
“At quarter end our
property portfolio was 96.4% occupied, representing a 40 basis point increase over the prior quarter. We are pleased to report
that we have entered into separate agreements to purchase five new Class A build-to-suit industrial buildings, representing approximately
1.6 million square feet, for a total purchase price of approximately $113.5 million. In keeping with our business model, leases
are 10 years or longer and are all net-leased to investment grade tenants. These properties are located in Indiana, Illinois, Kentucky,
and Texas. Subject to satisfactory due diligence, we anticipate closing these transactions upon completion and occupancy, which
is scheduled for the second half of fiscal 2014 and the first half of fiscal 2015.”
Monmouth Real Estate
Investment Corporation will host its First Quarter 2014 Financial Results Webcast and Conference Call. Senior management will discuss
the results, current market conditions and future outlook on Thursday, February 6, 2014 at 10:00 a.m. Eastern Time.
The Company’s
first quarter 2014 financial results being released herein will be available on the Company’s website at www.mreic.com in
the “Financial Information and Filings” section.
To participate in the Webcast,
select the microphone icon at the top of the homepage on the Company’s website at www.mreic.com.
Interested parties can also participate via conference call by calling toll free 888-317-6016 (domestically) or 412-317-6016
(internationally).
The replay of the
conference call will be available at 12:00 p.m. Eastern Time on Thursday, February 6, 2014. It will be available until April 30,
2014, and can be accessed by dialing toll free 877-344-7529 (domestically) and 412-317-0088 (internationally) and entering the
passcode 10038674. A transcript of the call and the webcast replay will be available at the Company’s website, www.mreic.com.
Monmouth Real Estate
Investment Corporation, founded in 1968 and one of the oldest public equity REITs in the U.S., specializes in net-leased industrial
properties subject to long-term leases primarily to investment grade tenants. The Company is a fully integrated and self-managed
real estate company, whose property portfolio consists of eighty industrial properties and one shopping center located in twenty-seven
states, containing a total of approximately 10.7 million rentable square feet. In addition, the Company owns a portfolio of REIT
securities.
Certain statements
included in this press release which are not historical facts may be deemed forward-looking statements within the meaning of the
Private Securities Litigation Reform Act of 1995. Any such forward-looking statements are based on the Company’s current
expectations and involve various risks and uncertainties. Although the Company believes the expectations reflected in any forward-looking
statements are based on reasonable assumptions, the Company can provide no assurance those expectations will be achieved. The risks
and uncertainties that could cause actual results or events to differ materially from expectations are contained in the Company’s
annual report on Form 10-K and described from time to time in the Company’s other filings with the SEC. The Company undertakes
no obligation to publicly update or revise any forward-looking statements whether as a result of new information, future events,
or otherwise.
First Quarter FY 2014 Supplemental
of Monmouth Real Estate Investment Corp. Page 19 of 20
Notes:
(1) Non-US GAAP Information: FFO is defined
by the National Association of Real Estate Investment Trusts ("NAREIT") as net income applicable to common shareholders,
excluding gains or losses from sales of depreciable assets, plus real estate-related depreciation and amortization. We define Core
FFO as FFO plus acquisition costs. We define AFFO as Core FFO excluding gains or losses on securities transactions, stock based
compensation expense, amortization of deferred financing and deferred leasing costs, recurring capital expenditures and straight-line
rent adjustments. We define NOI as recurring rental and reimbursement revenues less real estate and other operating expenses. FFO,
Core FFO and AFFO per diluted common share are defined as FFO, Core FFO and AFFO divided by weighted average diluted common shares
outstanding. FFO, Core FFO and AFFO per diluted common share, as well as NOI, should be considered as supplemental measures of
operating performance used by real estate investment trusts (REITs). FFO, Core FFO and AFFO per diluted common share exclude historical
cost depreciation as an expense and may facilitate the comparison of REITs which have different cost basis. The items excluded
from FFO, Core FFO and AFFO per diluted common share are significant components in understanding the Company’s financial
performance.
FFO, Core FFO and AFFO per diluted common
share (A) do not represent cash flow from operations as defined by accounting principles generally accepted in the United States
of America; (B) should not be considered as an alternative to net income as a measure of operating performance or to cash flows
from operating, investing and financing activities; and (C) are not alternatives to cash flow as a measure of liquidity. FFO, Core
FFO and AFFO per diluted common share, as well as NOI, as calculated by the Company, may not be comparable to similarly titled
measures reported by other REITs.
The Company’s
FFO and Core FFO for the three months ended December 31, 2013 and 2012 are calculated as follows:
| |
Three Months Ended |
|
| |
12/31/2013 |
|
12/31/2012 |
|
| Net Income Attributable to Common Shareholders |
$2,138,000 |
|
$3,555,000 |
|
|
| Depreciation Expense (including Discontinued Operations) |
3,813,000 |
|
3,134,000 |
|
|
| Amortization of Intangible Assets |
333,000 |
|
384,000 |
|
|
| FFO Attributable to Common Shareholders |
6,284,000 |
|
7,073,000 |
|
|
| Acquisition Costs |
463,000 |
|
386,000 |
|
|
| Core FFO Attributable to Common Shareholders |
$6,747,000 |
|
$7,459,000 |
|
|
| |
|
|
|
|
|
|
The Company’s
Core FFO, excluding the net Gain on Securities Transactions for the three months ended December 31, 2013 and 2012 are calculated
as follows:
| |
Three Months Ended |
|
| |
12/31/2013 |
|
12/31/2012 |
|
| Core FFO Attributable to Common Shareholders |
$6,747,000 |
|
$7,459,000 |
|
| Less: Gain on Securities Transactions, net |
151,000 |
|
2,111,000 |
|
|
Core FFO, excluding net Gain on Sale
of
Securities Transactions
Attributable to Common Shareholders |
$6,596,000 |
|
$5,348,000 |
|
The following are the Cash Flows provided
(used) by Operating, Investing and Financing Activities for the three months ended December 31, 2013 and 2012:
| |
Three Months Ended |
| |
12/31/2013 |
|
12/31/2012 |
| |
|
|
|
| Operating Activities |
$7,394,000 |
|
$4,992,000 |
| Investing Activities |
(87,173,000) |
|
(49,688,000) |
| Financing Activities |
75,827,000 |
|
30,329,000 |
# # # # #
First
Quarter FY 2014 Supplemental of Monmouth Real Estate Investment Corp. Page 20 of 20
