Attached files
| file | filename |
|---|---|
| 8-K - ESSEX PROPERTY TRUST, INC 8-K 1-30-2014 (EARNINGS RELEASE) - ESSEX PROPERTY TRUST, INC. | form8k.htm |
| EX-99.1 - EXHIBIT 99.1 - ESSEX PROPERTY TRUST, INC. | ex99_1.htm |
Exhibit 99.2
Fourth Quarter 2013Earnings Release & Supplemental Financial Information Investor Relations Contact:Barb PakDirector of Investor Relations (650) 494-3700 Essex Property Trust, Inc.925 East Meadow Drive Palo Alto, CA 94303(650) 494-3700 Epic Phase 1San Jose, CA 280 UnitsStabilized in October 201
Q4 2013 Supplemental
Table of Contents
|
|
Page
|
|
Consolidated Operating Results
|
S-1 – S-2
|
|
Consolidated Funds From Operations
|
S-3
|
|
Consolidated Balance Sheets
|
S-4
|
|
Debt Summary – December 31, 2013
|
S-5
|
|
Capitalization Data, Public Bond Covenants, Credit Ratings, and Selected Credit Ratios – December 31, 2013
|
S-6
|
|
Property Operating Results – Quarters ended December 31, 2013 and 2012
|
S-7
|
|
S-7.1
|
|
|
Revenue by County – Quarters ended December 31, 2013, December 31, 2012 and September 30, 2013
|
S-8
|
|
Revenue by County – Years ended December 31, 2013 and 2012
|
S-8.1
|
|
Development Pipeline – December 31, 2013
|
S-9
|
|
Redevelopment Pipeline and Capital Expenditures – December 31, 2013
|
S-10
|
|
Co-Investments – December 31, 2013
|
S-11
|
|
Summary of Consolidated Co-Investments and Noncontrolling Interest – December 31, 2013
|
S-12
|
|
Income From Discontinued Operations and Selected Financial Data – December 31, 2013
|
S-13
|
|
Assumptions for 2014 FFO Guidance Range
|
S-14
|
|
Summary of Apartment Community Acquisitions and Dispositions Activity
|
S-15
|
|
2014 MSA Level Forecasts: Supply, Jobs and Apartment Market Conditions
|
S-16
|
|
Axiometrics – Los Angeles Graph
|
S-17
|
|
Exhibit A - Property List by Region
|
1 - 5
|
ESSEX PROPERTY TRUST, INC.
|
Consolidated Operating Results
|
Three Months Ended
|
Year Ended
|
||||||||||||||
|
(Dollars in thousands, except per share amounts)
|
December 31,
|
December 31,
|
||||||||||||||
|
|
2013
|
2012
|
2013
|
2012
|
||||||||||||
|
|
||||||||||||||||
|
Revenues:
|
||||||||||||||||
|
Rental and other property
|
$
|
155,986
|
$
|
140,294
|
$
|
602,003
|
$
|
526,696
|
||||||||
|
Management and other fees
|
2,561
|
3,177
|
11,700
|
11,489
|
||||||||||||
|
|
158,547
|
143,471
|
613,703
|
538,185
|
||||||||||||
|
|
||||||||||||||||
|
Expenses:
|
||||||||||||||||
|
Property operating
|
51,070
|
45,699
|
196,012
|
172,167
|
||||||||||||
|
Depreciation
|
49,733
|
44,663
|
192,420
|
169,173
|
||||||||||||
|
General and administrative
|
6,676
|
6,866
|
25,601
|
23,307
|
||||||||||||
|
Merger expenses
|
4,284
|
-
|
4,284
|
-
|
||||||||||||
|
Cost of management and other fees
|
1,634
|
1,620
|
6,681
|
6,513
|
||||||||||||
|
|
113,397
|
98,848
|
424,998
|
371,160
|
||||||||||||
|
Earnings from operations
|
45,150
|
44,623
|
188,705
|
167,025
|
||||||||||||
|
|
||||||||||||||||
|
Interest expense before amortization
|
(26,875
|
)
|
(25,864
|
)
|
(104,600
|
)
|
(100,244
|
)
|
||||||||
|
Amortization expense
|
(2,986
|
)
|
(2,963
|
)
|
(11,924
|
)
|
(11,644
|
)
|
||||||||
|
Interest and other income
|
2,307
|
2,963
|
11,633
|
13,833
|
||||||||||||
|
Equity income from co-investments
|
3,570
|
32,747
|
55,865
|
41,745
|
||||||||||||
|
Loss on early retirement of debt
|
(1,146
|
)
|
(2,348
|
)
|
(300
|
)
|
(5,009
|
)
|
||||||||
|
Gain on sale of land
|
-
|
-
|
1,503
|
-
|
||||||||||||
|
Gain on remeasurement of co-investment
|
-
|
-
|
-
|
21,947
|
||||||||||||
|
Income before discontinued operations
|
20,020
|
49,158
|
140,882
|
127,653
|
||||||||||||
|
Income from discontinued operations
|
16,883
|
482
|
31,173
|
11,937
|
||||||||||||
|
Net income
|
36,903
|
49,640
|
172,055
|
139,590
|
||||||||||||
|
Net income attributable to noncontrolling interest
|
(3,661
|
)
|
(4,479
|
)
|
(15,772
|
)
|
(14,306
|
)
|
||||||||
|
Net income attributable to controlling interest
|
33,242
|
45,161
|
156,283
|
125,284
|
||||||||||||
|
Dividends to preferred stockholders
|
(1,368
|
)
|
(1,368
|
)
|
(5,472
|
)
|
(5,472
|
)
|
||||||||
|
Net income available to common stockholders
|
$
|
31,874
|
$
|
43,793
|
$
|
150,811
|
$
|
119,812
|
||||||||
|
|
||||||||||||||||
|
Net income per share - basic
|
$
|
0.85
|
$
|
1.22
|
$
|
4.05
|
$
|
3.42
|
||||||||
|
|
||||||||||||||||
|
Net income per share - diluted
|
$
|
0.85
|
$
|
1.22
|
$
|
4.04
|
$
|
3.41
|
||||||||
See Company's 10-K and 10-Q for additional disclosures
S-1
ESSEX PROPERTY TRUST, INC.
|
Consolidated Operating Results
|
Three Months Ended
|
Year Ended
|
||||||||||||||
|
Selected Line Item Detail
|
December 31,
|
December 31,
|
||||||||||||||
|
(Dollars in thousands)
|
2013
|
2012
|
2013
|
2012
|
||||||||||||
|
|
||||||||||||||||
|
Rental and other property
|
||||||||||||||||
|
Rental
|
$
|
145,231
|
$
|
130,385
|
$
|
561,109
|
$
|
490,570
|
||||||||
|
Other property
|
10,755
|
9,909
|
40,894
|
36,126
|
||||||||||||
|
Rental and other property
|
$
|
155,986
|
$
|
140,294
|
$
|
602,003
|
$
|
526,696
|
||||||||
|
|
||||||||||||||||
|
Management and other fees
|
||||||||||||||||
|
Management
|
$
|
1,451
|
$
|
2,264
|
$
|
7,263
|
$
|
8,457
|
||||||||
|
Development and redevelopment
|
1,110
|
913
|
4,437
|
3,032
|
||||||||||||
|
Management and other fees
|
$
|
2,561
|
$
|
3,177
|
$
|
11,700
|
$
|
11,489
|
||||||||
|
|
||||||||||||||||
|
Property operating expenses
|
||||||||||||||||
|
Real estate taxes
|
$
|
14,504
|
$
|
13,106
|
$
|
57,276
|
$
|
48,354
|
||||||||
|
Administrative and insurance
|
12,125
|
10,632
|
45,625
|
40,879
|
||||||||||||
|
Maintenance and repairs
|
10,645
|
9,922
|
40,831
|
36,318
|
||||||||||||
|
Utilities
|
10,016
|
8,880
|
37,791
|
33,973
|
||||||||||||
|
Property management
|
3,780
|
3,159
|
14,489
|
12,643
|
||||||||||||
|
Property operating expenses
|
$
|
51,070
|
$
|
45,699
|
$
|
196,012
|
$
|
172,167
|
||||||||
|
|
||||||||||||||||
|
General and administrative
|
||||||||||||||||
|
General and administrative
|
$
|
14,462
|
$
|
13,367
|
$
|
54,246
|
$
|
48,651
|
||||||||
|
Allocated to cost of management and other fees
|
(1,634
|
)
|
(1,620
|
)
|
(6,681
|
)
|
(6,513
|
)
|
||||||||
|
Allocated to property operating expenses - administrative
|
(3,780
|
)
|
(3,159
|
)
|
(14,489
|
)
|
(12,643
|
)
|
||||||||
|
Capitalized to real estate
|
(2,372
|
)
|
(1,722
|
)
|
(7,475
|
)
|
(6,188
|
)
|
||||||||
|
Net general and administrative
|
$
|
6,676
|
$
|
6,866
|
$
|
25,601
|
$
|
23,307
|
||||||||
|
|
||||||||||||||||
|
Interest and other income
|
||||||||||||||||
|
Marketable securities and other interest income
|
$
|
2,358
|
$
|
1,826
|
$
|
8,191
|
$
|
7,087
|
||||||||
|
Notes receivable
|
41
|
839
|
923
|
3,628
|
||||||||||||
|
(Loss) gain from sale of marketable securities and note prepayment
|
(92
|
)
|
298
|
2,519
|
819
|
|||||||||||
|
Co-investment promote fee
|
-
|
-
|
-
|
2,299
|
||||||||||||
|
Interest and other income
|
$
|
2,307
|
$
|
2,963
|
$
|
11,633
|
$
|
13,833
|
||||||||
|
|
||||||||||||||||
|
Equity income from co-investments
|
||||||||||||||||
|
Equity income (loss) from co-investments
|
$
|
14
|
$
|
230
|
$
|
836
|
$
|
(814
|
)
|
|||||||
|
Income from preferred equity investments
|
3,556
|
3,405
|
14,919
|
13,447
|
||||||||||||
|
Gain on sale of co-investment, net
|
-
|
29,112
|
38,752
|
29,112
|
||||||||||||
|
Income from early redemption of preferred equity investments
|
-
|
-
|
1,358
|
-
|
||||||||||||
|
Equity income from co-investments
|
$
|
3,570
|
$
|
32,747
|
$
|
55,865
|
$
|
41,745
|
||||||||
|
|
||||||||||||||||
|
Noncontrolling interest
|
||||||||||||||||
|
Limited partners of Essex Portfolio, L.P.
|
$
|
1,901
|
$
|
2,781
|
$
|
8,938
|
$
|
7,950
|
||||||||
|
DownREIT limited partners' distributions
|
1,144
|
1,074
|
4,635
|
4,367
|
||||||||||||
|
Third-party ownership interest
|
616
|
624
|
2,199
|
1,989
|
||||||||||||
|
Noncontrolling interest
|
$
|
3,661
|
$
|
4,479
|
$
|
15,772
|
$
|
14,306
|
||||||||
See Company's 10-K and 10-Q for additional disclosures
S-2
ESSEX PROPERTY TRUST, INC.
|
Consolidated Funds From Operations
|
Three Months Ended
|
Year Ended
|
||||||||||||||||||||||
|
(Dollars in thousands, except share and per share amounts)
|
December 31,
|
December 31,
|
||||||||||||||||||||||
|
|
2013
|
2012
|
% Change
|
2013
|
2012
|
% Change
|
||||||||||||||||||
|
|
||||||||||||||||||||||||
|
Funds from operations
|
||||||||||||||||||||||||
|
Net income available to common stockholders
|
$
|
31,874
|
$
|
43,793
|
$
|
150,811
|
$
|
119,812
|
||||||||||||||||
|
Adjustments:
|
||||||||||||||||||||||||
|
Depreciation
|
49,857
|
45,017
|
193,518
|
170,686
|
||||||||||||||||||||
|
Gains not included in FFO, net of internal disposition costs
|
(16,564
|
)
|
(29,112
|
)
|
(67,975
|
)
|
(60,842
|
)
|
||||||||||||||||
|
Depreciation add back from unconsolidated co-investments, and add back convertible preferred dividend - Series G
|
4,405
|
3,365
|
15,748
|
14,467
|
||||||||||||||||||||
|
Noncontrolling interest related to Operating Partnership units
|
1,901
|
2,781
|
8,938
|
7,950
|
||||||||||||||||||||
|
Depreciation attributable to noncontrolling interest
|
(328
|
)
|
(319
|
)
|
(1,309
|
)
|
(1,223
|
)
|
||||||||||||||||
|
Funds from operations
|
$
|
71,145
|
$
|
65,525
|
$
|
299,731
|
$
|
250,850
|
||||||||||||||||
|
FFO per share-diluted
|
$
|
1.80
|
$
|
1.72
|
4.6
|
%
|
$
|
7.59
|
$
|
6.71
|
13.1
|
%
|
||||||||||||
|
|
||||||||||||||||||||||||
|
Components of the change in FFO
|
||||||||||||||||||||||||
|
Non-core items:
|
||||||||||||||||||||||||
|
Loss on early retirement of debt
|
1,146
|
2,348
|
300
|
5,009
|
||||||||||||||||||||
|
Income from early redemption of preferred equity investments
|
-
|
-
|
(1,358
|
)
|
-
|
|||||||||||||||||||
|
Acquisition costs
|
369
|
1,480
|
1,161
|
2,255
|
||||||||||||||||||||
|
Loss (gain) on sale of marketable securities and note prepayment
|
92
|
(298
|
)
|
(2,519
|
)
|
(819
|
)
|
|||||||||||||||||
|
Gain on sale of land
|
-
|
-
|
(1,503
|
)
|
-
|
|||||||||||||||||||
|
Merger expenses
|
4,284
|
-
|
4,284
|
-
|
||||||||||||||||||||
|
Co-investment promote income
|
-
|
-
|
-
|
(2,299
|
)
|
|||||||||||||||||||
|
Core funds from operations
|
77,036
|
69,055
|
300,096
|
254,996
|
||||||||||||||||||||
|
Core FFO per share-diluted
|
$
|
1.94
|
$
|
1.81
|
7.5
|
%
|
$
|
7.60
|
$
|
6.82
|
11.4
|
%
|
||||||||||||
|
|
||||||||||||||||||||||||
|
Changes in core items:
|
||||||||||||||||||||||||
|
Same-property NOI
|
$
|
6,879
|
$
|
24,273
|
||||||||||||||||||||
|
Non-same property NOI
|
3,442
|
27,189
|
||||||||||||||||||||||
|
Management and other fees, net
|
(630
|
)
|
43
|
|||||||||||||||||||||
|
Equity income from co-investments
|
975
|
4,403
|
||||||||||||||||||||||
|
Interest and other income
|
(266
|
)
|
(1,601
|
)
|
||||||||||||||||||||
|
Interest and amortization expense
|
(1,034
|
)
|
(4,636
|
)
|
||||||||||||||||||||
|
General and administrative
|
(921
|
)
|
(3,388
|
)
|
||||||||||||||||||||
|
Discontinued operations
|
(392
|
)
|
(619
|
)
|
||||||||||||||||||||
|
Other items, net
|
(72
|
)
|
(564
|
)
|
||||||||||||||||||||
|
|
$
|
7,981
|
$
|
45,100
|
||||||||||||||||||||
|
|
||||||||||||||||||||||||
|
Weighted average number of shares outstanding diluted (1)
|
39,634,078
|
38,182,569
|
39,501,076
|
37,377,986
|
||||||||||||||||||||
| (1) | Assumes conversion of the weighted average operating partnership interests in the Operating Partnership into shares of the Company's common stock. |
See Company's 10-K and 10-Q for additional disclosures
S-3
ESSEX PROPERTY TRUST, INC.
|
Consolidated Balance Sheets
|
||||||||
|
(Dollars in thousands)
|
||||||||
|
|
December 31, 2013
|
December 31, 2012
|
||||||
|
|
||||||||
|
Real Estate:
|
||||||||
|
Land and land improvements
|
$
|
1,083,552
|
$
|
1,003,171
|
||||
|
Buildings and improvements
|
4,360,205
|
4,030,501
|
||||||
|
|
5,443,757
|
5,033,672
|
||||||
|
Less: accumulated depreciation
|
(1,254,886
|
)
|
(1,081,517
|
)
|
||||
|
|
4,188,871
|
3,952,155
|
||||||
|
Real estate under development
|
50,430
|
66,851
|
||||||
|
Co-investments
|
677,133
|
571,345
|
||||||
|
|
4,916,434
|
4,590,351
|
||||||
|
Cash and cash equivalents
|
53,766
|
42,126
|
||||||
|
Marketable securities
|
90,084
|
92,713
|
||||||
|
Notes and other receivables
|
68,255
|
66,163
|
||||||
|
Other assets
|
58,300
|
55,870
|
||||||
|
Total assets
|
$
|
5,186,839
|
$
|
4,847,223
|
||||
|
|
||||||||
|
Mortgage notes payable
|
$
|
1,404,080
|
$
|
1,565,599
|
||||
|
Unsecured debt
|
1,410,023
|
1,112,084
|
||||||
|
Lines of credit
|
219,421
|
141,000
|
||||||
|
Other liabilities
|
148,046
|
137,469
|
||||||
|
Derivative liabilities
|
2,682
|
6,606
|
||||||
|
Total liabilities
|
3,184,252
|
2,962,758
|
||||||
|
|
||||||||
|
Cumulative convertible preferred stock, carrying value
|
4,349
|
4,349
|
||||||
|
|
||||||||
|
Equity:
|
||||||||
|
Common stock
|
3
|
3
|
||||||
|
Cumulative redeemable preferred stock, liquidation value
|
73,750
|
73,750
|
||||||
|
Additional paid-in-capital
|
2,345,764
|
2,204,778
|
||||||
|
Distributions in excess of accumulated earnings
|
(474,426
|
)
|
(444,466
|
)
|
||||
|
Accumulated other comprehensive loss
|
(60,472
|
)
|
(69,261
|
)
|
||||
|
Total stockholders' equity
|
1,884,619
|
1,764,804
|
||||||
|
Noncontrolling interest
|
113,619
|
115,312
|
||||||
|
Total equity
|
1,998,238
|
1,880,116
|
||||||
|
Total liabilities and equity
|
$
|
5,186,839
|
$
|
4,847,223
|
||||
See Company's 10-K and 10-Q for additional disclosures
S-4
ESSEX PROPERTY TRUST, INC.
|
Debt Summary - December 31, 2013
|
||||||||||||||||||||||||||||||||||||||||
|
(Dollars in thousands)
|
||||||||||||||||||||||||||||||||||||||||
|
|
|
|
|
|
|
|
|
|
|
|
||||||||||||||||||||||||||||||
|
|
||||||||||||||||||||||||||||||||||||||||
|
|
Scheduled principal payments (excludes lines of credit)
|
|||||||||||||||||||||||||||||||||||||||
|
|
||||||||||||||||||||||||||||||||||||||||
|
|
Percentage
|
Weighted Average
|
Weighted
|
Percentage
|
||||||||||||||||||||||||||||||||||||
|
|
of Total
|
Balance
|
Interest
|
Maturity
|
Balance Outstanding
|
Average Interest
|
of Total
|
|||||||||||||||||||||||||||||||||
|
|
Debt
|
Outstanding
|
Rate
|
In Years
|
Secured
|
Unsecured
|
Total
|
Rate
|
Debt
|
|||||||||||||||||||||||||||||||
|
Mortgage Notes Payable
|
||||||||||||||||||||||||||||||||||||||||
|
Fixed rate - secured
|
41
|
%
|
$
|
1,236,479
|
6.1
|
%
|
5.2
|
2014
|
$
|
-
|
$
|
-
|
$
|
-
|
-
|
-
|
||||||||||||||||||||||||
|
Variable rate - secured (1)
|
5
|
%
|
167,601
|
1.6
|
%
|
19.9
|
2015
|
67,461
|
-
|
67,461
|
5.2
|
%
|
2.4
|
%
|
||||||||||||||||||||||||||
|
Total mortgage notes payable
|
46
|
%
|
1,404,080
|
5.6
|
%
|
6.9
|
2016
|
12,390
|
350,000
|
362,390
|
3.4
|
%
|
12.9
|
%
|
||||||||||||||||||||||||||
|
|
2017
|
182,731
|
190,000
|
372,731
|
4.3
|
%
|
13.2
|
%
|
||||||||||||||||||||||||||||||||
|
Unsecured Debt
|
2018
|
271,156
|
-
|
271,156
|
5.9
|
%
|
9.6
|
%
|
||||||||||||||||||||||||||||||||
|
Bonds private - fixed rate
|
15
|
%
|
465,000
|
4.5
|
%
|
5.2
|
2019
|
256,245
|
75,000
|
331,245
|
5.6
|
%
|
11.8
|
%
|
||||||||||||||||||||||||||
|
Bonds public - fixed rate
|
20
|
%
|
595,023
|
3.5
|
%
|
9.0
|
2020
|
398,776
|
-
|
398,776
|
6.4
|
%
|
14.2
|
%
|
||||||||||||||||||||||||||
|
Term loan (2)
|
11
|
%
|
350,000
|
2.5
|
%
|
3.2
|
2021
|
47,720
|
200,000
|
247,720
|
5.0
|
%
|
8.8
|
%
|
||||||||||||||||||||||||||
|
|
46
|
%
|
1,410,023
|
3.6
|
%
|
6.3
|
2022
|
-
|
297,311
|
297,311
|
3.7
|
%
|
10.6
|
%
|
||||||||||||||||||||||||||
|
Unsecured Lines of Credit
|
2023
|
-
|
297,712
|
297,712
|
3.3
|
%
|
10.6
|
%
|
||||||||||||||||||||||||||||||||
|
Line of credit (3)
|
7
|
%
|
199,000
|
2.2
|
%
|
2024
|
-
|
-
|
-
|
-
|
-
|
|||||||||||||||||||||||||||||
|
Line of credit (4)
|
1
|
%
|
20,421
|
2.2
|
%
|
Thereafter
|
167,601
|
-
|
167,601
|
1.6
|
%
|
5.9
|
%
|
|||||||||||||||||||||||||||
|
Total lines of credit
|
8
|
%
|
219,421
|
2.2
|
%
|
|||||||||||||||||||||||||||||||||||
|
|
Total
|
$
|
1,404,080
|
$
|
1,410,023
|
$
|
2,814,103
|
4.6
|
%
|
100.0
|
%
|
|||||||||||||||||||||||||||||
|
Total debt
|
100
|
%
|
$
|
3,033,524
|
4.4
|
%
|
||||||||||||||||||||||||||||||||||
|
|
||||||||||||||||||||||||||||||||||||||||
Capitalized interest for the three months and twelve months ended December 31, 2013 was approximately $3.8 million and $16.5 million, respectively.
| (1) | This variable rate debt is tax exempt to the note holders and is subject to interest rate protection agreements. |
| (2) | The unsecured term loan has a variable interest rate of LIBOR plus 1.05%. The Company has entered into interest rate swap contracts with a notional amount totaling $300 million, which effectively converts the interest rate on $300 million of the term loan to a fixed rate of 2.14%. |
| (3) | The unsecured line of credit facility is $1 billion and the line matures in December 2017 with one 18-month extension, exercisable at the Company's option. The underlying interest rate on this line is based on a tiered rate structure tied to the Company's corporate ratings and is currently at LIBOR plus 0.95%. |
| (4) | The unsecured line of credit facility is $25 million and has matured in January 2014. The Company has extended the facility for two additional years. The underlying interest rate on this line is based on a tiered rate structure tied to the Company's corporate ratings and is currently at LIBOR plus 0.95%. |
See Company's 10-K and 10-Q for additional disclosures
S-5
ESSEX PROPERTY TRUST, INC.
|
Capitalization Data, Public Bond Covenants, Credit Ratings and Selected Credit Ratios - December 31, 2013
|
|
|||||||||||
|
(Dollars and shares in thousands, except per share amounts)
|
|
|
||||||||||
|
|
|
|
|
|
||||||||
|
|
|
|
||||||||||
|
Capitalization Data
|
Public Bond Covenants
|
Actual
|
Requirement
|
|||||||||
|
Total debt
|
$
|
3,033,524
|
|
|
||||||||
|
|
Debt to Total Assets:
|
47
|
% |
< 65
|
% | |||||||
|
Common stock and potentially dilutive securities
|
|
|
||||||||||
|
Common stock outstanding
|
37,421
|
|
|
|||||||||
|
Limited partnership units (1)
|
2,150
|
|
|
|||||||||
|
Options-treasury method
|
112
|
Secured Debt to Total Assets:
|
22
|
%
|
< 40
|
% | ||||||
|
Total shares of common stock and potentially dilutive securities
|
39,683
|
|
|
|||||||||
|
|
|
|
||||||||||
|
Common stock price per share as of December 31, 2013
|
$
|
143.51
|
|
|
||||||||
|
|
Interest Coverage:
|
342
|
%
|
> 150
|
% | |||||||
|
Market value of common stock and potentially dilutive securities
|
$
|
5,694,907
|
|
|
||||||||
|
|
|
|
||||||||||
|
Preferred stock
|
$
|
73,079
|
Unsecured Debt Ratio (1) :
|
232
|
%
|
> 150
|
% | |||||
|
|
|
|
||||||||||
|
Total equity capitalization
|
$
|
5,767,986
|
|
|
||||||||
|
|
Selected Credit Ratios
|
Actual
|
|
|||||||||
|
Total market capitalization
|
$
|
8,801,510
|
|
|
||||||||
|
Ratio of debt to total market capitalization
|
34.5
|
%
|
Indebtedness Divided by Adjusted EBITDA (2):
|
7.0x
|
|
|||||||
|
|
|
|
||||||||||
|
(1) Assumes conversion of all outstanding operating partnership interests in the Operating Partnership into shares of the Company's common stock.
|
Unencumbered NOI to Total NOI:
|
60
|
%
|
|||||||||
|
(1) Unsecured Debt Ratio is unsecured assets (excluding investments in co-investments) divided by unsecured indebtedness.
|
||||||||||||
|
Credit Ratings
|
(2) Adjusted EBITDA is annualized current quarter NOI adjusted for non-recurring items and proforma NOI for current quarter acquisitions.
|
|||||||||||
|
Rating Agency
|
Rating | Outlook |
|
|||||||||
| Fitch | BBB+ | Stable |
|
|||||||||
|
Moody's
|
Baa2 | Stable | ||||||||||
|
Standard & Poors
|
BBB | Stable | ||||||||||
See Company's 10-K and 10-Q for additional disclosures
S-6
ESSEX PROPERTY TRUST, INC.
Property Operating Results - Quarters ended December 31, 2013 and 2012
(Dollars in thousands, except per unit amounts)
|
|
Southern California
|
Northern California
|
Seattle Metro
|
Other real estate assets (1)
|
Total
|
|||||||||||||||||||||||||||||||||||||||||||||||||||
|
|
2013
|
2012
|
% Change
|
2013
|
2012
|
% Change
|
2013
|
2012
|
% Change
|
2013
|
2012
|
2013
|
2012
|
% Change
|
||||||||||||||||||||||||||||||||||||||||||
|
|
||||||||||||||||||||||||||||||||||||||||||||||||||||||||
|
Revenues:
|
||||||||||||||||||||||||||||||||||||||||||||||||||||||||
|
Same-property revenue
|
$
|
60,069
|
57,361
|
4.7
|
%
|
$
|
47,673
|
$
|
44,019
|
8.3
|
%
|
$
|
23,992
|
22,249
|
7.8
|
%
|
$
|
-
|
-
|
$
|
131,734
|
$
|
123,629
|
6.6
|
%
|
|||||||||||||||||||||||||||||||
|
Non-same property revenue (2)
|
8,282
|
7,158
|
8,115
|
3,509
|
4,118
|
2,803
|
3,737
|
3,195
|
24,252
|
16,665
|
||||||||||||||||||||||||||||||||||||||||||||||
|
Total Revenues
|
$
|
68,351
|
$
|
64,519
|
$
|
55,788
|
$
|
47,528
|
$
|
28,110
|
$
|
25,052
|
$
|
3,737
|
$
|
3,195
|
$
|
155,986
|
$
|
140,294
|
||||||||||||||||||||||||||||||||||||
|
|
||||||||||||||||||||||||||||||||||||||||||||||||||||||||
|
Property operating expenses:
|
||||||||||||||||||||||||||||||||||||||||||||||||||||||||
|
Same-property operating expenses
|
||||||||||||||||||||||||||||||||||||||||||||||||||||||||
|
Real estate taxes
|
$
|
5,066
|
$
|
5,034
|
$
|
4,400
|
4,150
|
$
|
2,064
|
1,939
|
$
|
-
|
-
|
$
|
11,530
|
$
|
11,123
|
3.7
|
%
|
|||||||||||||||||||||||||||||||||||||
|
Administrative and insurance
|
5,380
|
5,211
|
2,849
|
2,930
|
1,702
|
1,672
|
-
|
-
|
9,931
|
9,813
|
1.2
|
%
|
||||||||||||||||||||||||||||||||||||||||||||
|
Maintenance and repairs
|
4,211
|
4,101
|
2,920
|
2,689
|
1,564
|
1,681
|
-
|
-
|
8,695
|
8,471
|
2.6
|
%
|
||||||||||||||||||||||||||||||||||||||||||||
|
Utilities
|
3,449
|
3,216
|
2,934
|
2,730
|
1,791
|
1,759
|
-
|
-
|
8,174
|
7,705
|
6.1
|
%
|
||||||||||||||||||||||||||||||||||||||||||||
|
Management fees
|
1,339
|
1,346
|
906
|
891
|
613
|
613
|
-
|
-
|
2,858
|
2,850
|
0.3
|
%
|
||||||||||||||||||||||||||||||||||||||||||||
|
Total same-property operating expenses
|
19,445
|
18,908
|
2.8
|
%
|
14,009
|
13,390
|
4.6
|
%
|
7,734
|
7,664
|
0.9
|
%
|
-
|
-
|
$
|
41,188
|
$
|
39,962
|
3.1
|
%
|
||||||||||||||||||||||||||||||||||||
|
Non-same property operating expenses (2)
|
3,614
|
2,833
|
3,143
|
1,338
|
1,422
|
1,017
|
1,703
|
549
|
9,882
|
5,737
|
||||||||||||||||||||||||||||||||||||||||||||||
|
Total property operating expenses
|
$
|
23,059
|
$
|
21,741
|
$
|
17,152
|
$
|
14,728
|
$
|
9,156
|
$
|
8,681
|
$
|
1,703
|
$
|
549
|
$
|
51,070
|
$
|
45,699
|
||||||||||||||||||||||||||||||||||||
|
|
||||||||||||||||||||||||||||||||||||||||||||||||||||||||
|
Net operating income (NOI):
|
||||||||||||||||||||||||||||||||||||||||||||||||||||||||
|
Same-property NOI
|
$
|
40,624
|
$
|
38,453
|
5.6
|
%
|
$
|
33,664
|
$
|
30,629
|
9.9
|
%
|
$
|
16,258
|
$
|
14,585
|
11.5
|
%
|
$
|
-
|
$
|
-
|
$
|
90,546
|
$
|
83,667
|
8.2
|
%
|
||||||||||||||||||||||||||||
|
Non-same property NOI (2)
|
||||||||||||||||||||||||||||||||||||||||||||||||||||||||
|
Redevelopment communities
|
1,070
|
1,293
|
-
|
-
|
762
|
566
|
-
|
-
|
1,832
|
1,859
|
||||||||||||||||||||||||||||||||||||||||||||||
|
Acquired communities - 2013 (3)
|
471
|
-
|
1,394
|
-
|
543
|
-
|
-
|
-
|
2,408
|
-
|
||||||||||||||||||||||||||||||||||||||||||||||
|
Acquired communities - 2012 (4)
|
3,127
|
3,032
|
3,578
|
2,171
|
1,391
|
1,220
|
-
|
-
|
8,096
|
6,423
|
||||||||||||||||||||||||||||||||||||||||||||||
|
Other real estate assets (1)
|
-
|
-
|
-
|
-
|
-
|
-
|
2,034
|
2,646
|
2,034
|
2,646
|
||||||||||||||||||||||||||||||||||||||||||||||
|
Total non-same property NOI
|
4,668
|
4,325
|
4,972
|
2,171
|
2,696
|
1,786
|
2,034
|
2,646
|
14,370
|
10,928
|
||||||||||||||||||||||||||||||||||||||||||||||
|
Total NOI
|
$
|
45,292
|
$
|
42,778
|
$
|
38,636
|
$
|
32,800
|
$
|
18,954
|
$
|
16,371
|
$
|
2,034
|
$
|
2,646
|
$
|
104,916
|
$
|
94,595
|
||||||||||||||||||||||||||||||||||||
|
|
||||||||||||||||||||||||||||||||||||||||||||||||||||||||
|
Same-property operating margin
|
68
|
%
|
67
|
%
|
71
|
%
|
70
|
%
|
68
|
%
|
66
|
%
|
69
|
%
|
68
|
%
|
||||||||||||||||||||||||||||||||||||||||
|
|
||||||||||||||||||||||||||||||||||||||||||||||||||||||||
|
Annualized same-property turnover percentage
|
47
|
%
|
48
|
%
|
46
|
%
|
45
|
%
|
41
|
%
|
41
|
%
|
45
|
%
|
46
|
%
|
||||||||||||||||||||||||||||||||||||||||
|
|
||||||||||||||||||||||||||||||||||||||||||||||||||||||||
|
Average same-property concessions per turn (5)
|
$
|
106
|
$
|
142
|
$
|
205
|
171
|
$
|
149
|
147
|
$
|
145
|
152
|
|||||||||||||||||||||||||||||||||||||||||||
|
|
||||||||||||||||||||||||||||||||||||||||||||||||||||||||
|
Reconciliation of apartment units at end of period
|
||||||||||||||||||||||||||||||||||||||||||||||||||||||||
|
|
||||||||||||||||||||||||||||||||||||||||||||||||||||||||
|
Same-property apartment units
|
12,305
|
8,106
|
5,749
|
26,160
|
||||||||||||||||||||||||||||||||||||||||||||||||||||
|
|
||||||||||||||||||||||||||||||||||||||||||||||||||||||||
|
Consolidated apartment units
|
13,855
|
13,656
|
9,431
|
8,987
|
6,703
|
6,598
|
29,989
|
29,241
|
||||||||||||||||||||||||||||||||||||||||||||||||
|
Joint venture
|
1,870
|
1,788
|
783
|
1,236
|
1,157
|
1,237
|
3,810
|
4,261
|
||||||||||||||||||||||||||||||||||||||||||||||||
|
Under development
|
492
|
492
|
2,289
|
1,728
|
-
|
275
|
2,781
|
2,495
|
||||||||||||||||||||||||||||||||||||||||||||||||
|
Total apartment units at end of period
|
16,217
|
15,936
|
12,503
|
11,951
|
7,860
|
8,110
|
36,580
|
35,997
|
||||||||||||||||||||||||||||||||||||||||||||||||
|
|
||||||||||||||||||||||||||||||||||||||||||||||||||||||||
|
Percentage of total
|
45
|
%
|
44
|
%
|
34
|
%
|
33
|
%
|
21
|
%
|
23
|
%
|
100
|
%
|
100
|
%
|
||||||||||||||||||||||||||||||||||||||||
|
|
||||||||||||||||||||||||||||||||||||||||||||||||||||||||
|
Average same-property financial occupancy
|
96.4
|
%
|
96.0
|
%
|
96.3
|
%
|
96.4
|
%
|
96.0
|
%
|
95.9
|
%
|
96.3
|
%
|
96.1
|
%
|
||||||||||||||||||||||||||||||||||||||||
| (1) | Other real estate assets consists mainly of retail space, commercial properties, and boat slips and their operating results are classified in non-same property results. |
| (2) | Includes properties which subsequent to January 1, 2012 were either acquired or in a stage of development or redevelopment without stabilized operations. |
| (3) | Acquired communities during 2013 includes Annaliese, Fox Plaza, Slater 116, Vox, and Domain. |
| (4) | Acquired communities during 2012 includes Reed Square, Essex Skyline at MacArthur Place, Park Catalina, The Huntington, Montebello, Park West, Domaine, Ascent, Willow Lake, and Bennett Lofts. |
| (5) | Average same-property concessions per turn is the dollar amount per unit resulting from the same-property concessions divided by the product of the same property turnover percentage for the quarter times the same-property apartment units. |
See Company's 10-K and 10-Q for additional disclosures
S-7
ESSEX PROPERTY TRUST, INC.
Property Operating Results - Year ended December 31, 2013 and 2012
(Dollars in thousands, except per unit amounts)
|
|
Southern California
|
Northern California
|
Seattle Metro
|
Other real estate assets (1)
|
Total
|
|||||||||||||||||||||||||||||||||||||||||||||||||||
|
|
2013
|
2012
|
% Change
|
2013
|
2012
|
% Change
|
2013
|
2012
|
% Change
|
2013
|
2012
|
2013
|
2012
|
% Change
|
||||||||||||||||||||||||||||||||||||||||||
|
|
||||||||||||||||||||||||||||||||||||||||||||||||||||||||
|
Revenues:
|
||||||||||||||||||||||||||||||||||||||||||||||||||||||||
|
Same-property revenue
|
$
|
235,306
|
225,435
|
4.4
|
%
|
$
|
184,508
|
170,578
|
8.2
|
%
|
$
|
93,139
|
86,483
|
7.7
|
%
|
$
|
-
|
-
|
$
|
512,953
|
$
|
482,496
|
6.3
|
%
|
||||||||||||||||||||||||||||||||
|
Non-same property revenue (2)
|
29,920
|
21,099
|
29,894
|
4,747
|
14,414
|
6,006
|
14,822
|
12,348
|
89,050
|
44,200
|
||||||||||||||||||||||||||||||||||||||||||||||
|
Total Revenues
|
$
|
265,226
|
$
|
246,534
|
$
|
214,402
|
$
|
175,325
|
$
|
107,553
|
$
|
92,489
|
$
|
14,822
|
$
|
12,348
|
$
|
602,003
|
$
|
526,696
|
||||||||||||||||||||||||||||||||||||
|
|
||||||||||||||||||||||||||||||||||||||||||||||||||||||||
|
Property operating expenses:
|
||||||||||||||||||||||||||||||||||||||||||||||||||||||||
|
Same-property operating expenses
|
||||||||||||||||||||||||||||||||||||||||||||||||||||||||
|
Real estate taxes
|
$
|
20,195
|
19,750
|
$
|
17,192
|
16,315
|
$
|
8,667
|
7,378
|
$
|
-
|
-
|
$
|
46,054
|
$
|
43,443
|
6.0
|
%
|
||||||||||||||||||||||||||||||||||||||
|
Administrative and insurance
|
21,149
|
20,343
|
11,401
|
11,473
|
6,776
|
6,609
|
-
|
-
|
39,326
|
38,425
|
2.3
|
%
|
||||||||||||||||||||||||||||||||||||||||||||
|
Maintenance and repairs
|
16,333
|
15,550
|
11,530
|
10,818
|
6,213
|
6,282
|
-
|
-
|
34,076
|
32,650
|
4.4
|
%
|
||||||||||||||||||||||||||||||||||||||||||||
|
Utilities
|
13,097
|
12,665
|
11,336
|
10,840
|
7,089
|
6,807
|
-
|
-
|
31,522
|
30,312
|
4.0
|
%
|
||||||||||||||||||||||||||||||||||||||||||||
|
Management fees
|
5,354
|
5,382
|
3,602
|
3,536
|
2,452
|
2,454
|
-
|
-
|
11,408
|
11,372
|
0.3
|
%
|
||||||||||||||||||||||||||||||||||||||||||||
|
Total same-property operating expenses
|
76,128
|
73,690
|
3.3
|
%
|
55,061
|
52,982
|
3.9
|
%
|
31,197
|
29,530
|
5.6
|
%
|
-
|
-
|
162,386
|
156,202
|
4.0
|
%
|
||||||||||||||||||||||||||||||||||||||
|
Non-same property operating expenses (2)
|
12,423
|
8,752
|
11,137
|
1,803
|
4,949
|
2,106
|
5,117
|
3,304
|
33,626
|
15,965
|
||||||||||||||||||||||||||||||||||||||||||||||
|
Total property operating expenses
|
$
|
88,551
|
$
|
82,442
|
$
|
66,198
|
$
|
54,785
|
$
|
36,146
|
$
|
31,636
|
$
|
5,117
|
$
|
3,304
|
$
|
196,012
|
$
|
172,167
|
||||||||||||||||||||||||||||||||||||
|
|
||||||||||||||||||||||||||||||||||||||||||||||||||||||||
|
Net operating income (NOI):
|
||||||||||||||||||||||||||||||||||||||||||||||||||||||||
|
Same-property NOI
|
$
|
159,178
|
$
|
151,745
|
4.9
|
%
|
$
|
129,447
|
$
|
117,596
|
10.1
|
%
|
$
|
61,942
|
$
|
56,953
|
8.8
|
%
|
$
|
-
|
$
|
-
|
$
|
350,567
|
$
|
326,294
|
7.4
|
%
|
||||||||||||||||||||||||||||
|
Non-same property NOI (2)
|
||||||||||||||||||||||||||||||||||||||||||||||||||||||||
|
Redevelopment communities
|
4,858
|
4,989
|
-
|
-
|
3,005
|
2,040
|
-
|
-
|
7,863
|
7,029
|
||||||||||||||||||||||||||||||||||||||||||||||
|
Acquired communities - 2013 (3)
|
471
|
-
|
4,684
|
-
|
1,097
|
-
|
-
|
-
|
6,252
|
-
|
||||||||||||||||||||||||||||||||||||||||||||||
|
Acquired communities - 2012 (4)
|
12,168
|
7,358
|
14,073
|
2,944
|
5,363
|
1,860
|
-
|
-
|
31,604
|
12,162
|
||||||||||||||||||||||||||||||||||||||||||||||
|
Other real estate assets (1)
|
-
|
-
|
-
|
-
|
-
|
-
|
9,705
|
9,044
|
9,705
|
9,044
|
||||||||||||||||||||||||||||||||||||||||||||||
|
Total non-same property NOI
|
17,497
|
12,347
|
18,757
|
2,944
|
9,465
|
3,900
|
9,705
|
9,044
|
55,424
|
28,235
|
||||||||||||||||||||||||||||||||||||||||||||||
|
Total NOI
|
$
|
176,675
|
$
|
164,092
|
$
|
148,204
|
$
|
120,540
|
$
|
71,407
|
$
|
60,853
|
$
|
9,705
|
$
|
9,044
|
$
|
405,991
|
$
|
354,529
|
||||||||||||||||||||||||||||||||||||
|
|
||||||||||||||||||||||||||||||||||||||||||||||||||||||||
|
Same-property operating margin
|
68
|
%
|
67
|
%
|
70
|
%
|
69
|
%
|
67
|
%
|
66
|
%
|
68
|
%
|
68
|
%
|
||||||||||||||||||||||||||||||||||||||||
|
|
||||||||||||||||||||||||||||||||||||||||||||||||||||||||
|
Annualized same-property turnover percentage
|
53
|
%
|
51
|
%
|
52
|
%
|
48
|
%
|
49
|
%
|
49
|
%
|
52
|
%
|
52
|
%
|
||||||||||||||||||||||||||||||||||||||||
|
|
||||||||||||||||||||||||||||||||||||||||||||||||||||||||
|
Average same-property concessions per turn (5)
|
$
|
110
|
153
|
$
|
149
|
153
|
$ |
100
|
115
|
$
|
120
|
128
|
||||||||||||||||||||||||||||||||||||||||||||
|
|
||||||||||||||||||||||||||||||||||||||||||||||||||||||||
|
Average same-property financial occupancy
|
96.1
|
%
|
96.1
|
%
|
96.3
|
%
|
96.7
|
%
|
96.1
|
%
|
96.1
|
%
|
96.2
|
%
|
96.3
|
%
|
||||||||||||||||||||||||||||||||||||||||
| (1) | Other real estate assets consists mainly of retail space, commercial properties, and boat slips and their operating results are classified in non-same property results. |
| (2) | Includes properties which subsequent to January 1, 2012 were either acquired or in a stage of development or redevelopment without stabilized operations. |
| (3) | Acquired communities during 2013 includes Annaliese, Fox Plaza, Slater 116, Vox, and Domain. |
| (4) | Acquired communities during 2012 includes Reed Square, Essex Skyline at MacArthur Place, Park Catalina, The Huntington, Montebello, Park West, Domaine, Ascent, Willow Lake, and Bennett Lofts. |
| (5) | Average same-property concessions per turn is the dollar amount per unit resulting from the same-property concessions divided by the product of the same property turnover percentage for the quarter times the same-property apartment units. |
See Company's 10-K and 10-Q for additional disclosures
S-7.1
ESSEX PROPERTY TRUST, INC.
Revenue by County - Quarters ended December 31, 2013, December 31, 2012 and September 30, 2013
(Dollars in thousands, except average property rental rates)
|
|
Average Property Rental Rates
|
Three months ended
December 31, 2013 |
Three months ended
December 31, 2012 |
|||||||||||||||||||||||||||||||||||||||||
|
Region
|
Units
|
QTD
2013
|
QTD
2012
|
% Change
|
Property Revenue
|
Financial Occupancy
|
Property Revenue
|
Financial Occupancy
|
Property Revenue
% Change
|
Property Revenue
September 30, 2013
|
Sequential % Change
|
|||||||||||||||||||||||||||||||||
|
|
||||||||||||||||||||||||||||||||||||||||||||
|
Southern California
|
||||||||||||||||||||||||||||||||||||||||||||
|
Los Angeles County
|
4,349
|
$
|
1,854
|
$
|
1,771
|
4.7
|
%
|
$
|
24,501
|
96.4
|
%
|
$
|
23,388
|
96.2
|
%
|
4.8
|
%
|
$
|
24,207
|
1.2
|
%
|
|||||||||||||||||||||||
|
Ventura County
|
2,898
|
1,426
|
1,377
|
3.6
|
%
|
12,815
|
96.7
|
%
|
12,323
|
96.4
|
%
|
4.0
|
%
|
12,616
|
1.6
|
%
|
||||||||||||||||||||||||||||
|
Orange County
|
2,262
|
1,709
|
1,640
|
4.2
|
%
|
11,734
|
96.1
|
%
|
11,175
|
95.7
|
%
|
5.0
|
%
|
11,597
|
1.2
|
%
|
||||||||||||||||||||||||||||
|
San Diego County
|
2,173
|
1,253
|
1,209
|
3.6
|
%
|
8,459
|
96.1
|
%
|
8,152
|
96.1
|
%
|
3.8
|
%
|
8,302
|
1.9
|
%
|
||||||||||||||||||||||||||||
|
Santa Barbara County
|
347
|
1,748
|
1,668
|
4.8
|
%
|
1,892
|
99.3
|
%
|
1,679
|
92.1
|
%
|
12.7
|
%
|
1,748
|
8.3
|
%
|
||||||||||||||||||||||||||||
|
Riverside County
|
276
|
789
|
797
|
-1.0
|
%
|
668
|
94.6
|
%
|
644
|
91.9
|
%
|
3.7
|
%
|
616
|
8.4
|
%
|
||||||||||||||||||||||||||||
|
Total same-property
|
12,305
|
1,594
|
1,530
|
4.2
|
%
|
60,069
|
96.4
|
%
|
57,361
|
96.0
|
%
|
4.7
|
%
|
59,086
|
1.7
|
%
|
||||||||||||||||||||||||||||
|
Los Angeles County
|
546
|
1,696
|
2,838
|
2,761
|
||||||||||||||||||||||||||||||||||||||||
|
San Diego County
|
379
|
1,899
|
888
|
-
|
||||||||||||||||||||||||||||||||||||||||
|
Orange County
|
625
|
2,342
|
4,556
|
4,397
|
||||||||||||||||||||||||||||||||||||||||
|
Non-same property
|
1,550
|
1,979
|
8,282
|
7,158
|
||||||||||||||||||||||||||||||||||||||||
|
|
||||||||||||||||||||||||||||||||||||||||||||
|
Northern California
|
||||||||||||||||||||||||||||||||||||||||||||
|
Santa Clara County
|
3,671
|
2,053
|
1,898
|
8.2
|
%
|
22,858
|
96.4
|
%
|
21,040
|
96.1
|
%
|
8.6
|
%
|
22,480
|
1.7
|
%
|
||||||||||||||||||||||||||||
|
Contra Costa County
|
1,720
|
1,753
|
1,640
|
6.9
|
%
|
9,094
|
95.5
|
%
|
8,652
|
96.7
|
%
|
5.1
|
%
|
9,089
|
0.1
|
%
|
||||||||||||||||||||||||||||
|
Alameda County
|
1,542
|
1,723
|
1,559
|
10.5
|
%
|
8,278
|
96.6
|
%
|
7,535
|
96.9
|
%
|
9.9
|
%
|
8,075
|
2.5
|
%
|
||||||||||||||||||||||||||||
|
San Mateo County
|
768
|
2,112
|
1,922
|
9.9
|
%
|
5,004
|
96.5
|
%
|
4,571
|
96.9
|
%
|
9.5
|
%
|
4,908
|
2.0
|
%
|
||||||||||||||||||||||||||||
|
San Francisco MSA
|
175
|
2,385
|
2,140
|
11.4
|
%
|
1,276
|
96.7
|
%
|
1,122
|
95.7
|
%
|
13.7
|
%
|
1,181
|
8.0
|
%
|
||||||||||||||||||||||||||||
|
Other
|
230
|
1,670
|
1,573
|
6.2
|
%
|
1,163
|
96.5
|
%
|
1,099
|
97.1
|
%
|
5.8
|
%
|
1,105
|
5.2
|
%
|
||||||||||||||||||||||||||||
|
Total same-property
|
8,106
|
1,928
|
1,777
|
8.5
|
%
|
47,673
|
96.3
|
%
|
44,019
|
96.4
|
%
|
8.3
|
%
|
46,838
|
1.8
|
%
|
||||||||||||||||||||||||||||
|
San Francisco MSA
|
717
|
2,479
|
4,494
|
878
|
||||||||||||||||||||||||||||||||||||||||
|
Santa Clara County
|
608
|
2,049
|
3,621
|
2,631
|
||||||||||||||||||||||||||||||||||||||||
|
Non-same property
|
1,325
|
2,264
|
8,115
|
3,509
|
||||||||||||||||||||||||||||||||||||||||
|
|
||||||||||||||||||||||||||||||||||||||||||||
|
Seattle Metro
|
||||||||||||||||||||||||||||||||||||||||||||
|
King County
|
5,284
|
1,346
|
1,252
|
7.5
|
%
|
22,557
|
96.0
|
%
|
20,915
|
95.8
|
%
|
7.9
|
%
|
22,265
|
1.3
|
%
|
||||||||||||||||||||||||||||
|
Snohomish County
|
465
|
981
|
906
|
8.3
|
%
|
1,435
|
96.1
|
%
|
1,334
|
96.5
|
%
|
7.6
|
%
|
1,398
|
2.6
|
%
|
||||||||||||||||||||||||||||
|
Total same-property
|
5,749
|
1,317
|
1,224
|
7.6
|
%
|
23,992
|
96.0
|
%
|
22,249
|
95.9
|
%
|
7.8
|
%
|
23,663
|
1.4
|
%
|
||||||||||||||||||||||||||||
|
King County
|
954
|
1,610
|
4,118
|
2,803
|
||||||||||||||||||||||||||||||||||||||||
|
Non-same property
|
954
|
1,610
|
4,118
|
2,803
|
||||||||||||||||||||||||||||||||||||||||
|
|
||||||||||||||||||||||||||||||||||||||||||||
|
Other real estate assets
|
3,737
|
3,195
|
||||||||||||||||||||||||||||||||||||||||||
|
|
||||||||||||||||||||||||||||||||||||||||||||
|
Total same-property revenue
|
26,160
|
$
|
1,637
|
1,539
|
6.4
|
%
|
$
|
131,734
|
96.3
|
%
|
$
|
123,629
|
96.1
|
%
|
6.6
|
%
|
$
|
129,587
|
1.7
|
%
|
||||||||||||||||||||||||
|
|
||||||||||||||||||||||||||||||||||||||||||||
|
Total non-same property revenue
|
3,829
|
$
|
1,951
|
$
|
24,252
|
$
|
16,665
|
|||||||||||||||||||||||||||||||||||||
See Company's 10-K and 10-Q for additional disclosures
S-8
ESSEX PROPERTY TRUST, INC.
Revenue by County - Year ended December 31, 2013 and 2012
(Dollars in thousands, except average property rental rates)
|
|
Average Property Rental Rates
|
Year ended
December 31, 2013 |
Year ended
December 31, 2012 |
|||||||||||||||||||||||||||||||||
|
Region
|
Units
|
YTD 2013
|
YTD 2012
|
% Change
|
Property
Revenue
|
Financial
Occupancy
|
Property
Revenue
|
Financial
Occupancy
|
Property
Revenue
% Change
|
|||||||||||||||||||||||||||
|
|
||||||||||||||||||||||||||||||||||||
|
Southern California
|
||||||||||||||||||||||||||||||||||||
|
Los Angeles County
|
4,349
|
$
|
1,822
|
$
|
1,735
|
5.0
|
%
|
$
|
96,020
|
96.2
|
%
|
$
|
91,461
|
96.5
|
%
|
5.0
|
%
|
|||||||||||||||||||
|
Ventura County
|
2,898
|
1,403
|
1,357
|
3.4
|
%
|
50,373
|
96.6
|
%
|
48,589
|
96.4
|
%
|
3.7
|
%
|
|||||||||||||||||||||||
|
Orange County
|
2,262
|
1,681
|
1,613
|
4.2
|
%
|
46,020
|
96.1
|
%
|
44,022
|
96.0
|
%
|
4.5
|
%
|
|||||||||||||||||||||||
|
San Diego County
|
2,173
|
1,234
|
1,198
|
3.0
|
%
|
33,145
|
95.7
|
%
|
32,163
|
96.1
|
%
|
3.1
|
%
|
|||||||||||||||||||||||
|
Santa Barbara County
|
347
|
1,703
|
1,667
|
2.2
|
%
|
7,193
|
95.7
|
%
|
6,642
|
91.6
|
%
|
8.3
|
%
|
|||||||||||||||||||||||
|
Riverside County
|
276
|
797
|
788
|
1.1
|
%
|
2,555
|
91.0
|
%
|
2,558
|
92.5
|
%
|
-0.1
|
%
|
|||||||||||||||||||||||
|
Total same-property
|
12,305
|
1,567
|
1,506
|
4.1
|
%
|
235,306
|
96.1
|
%
|
225,435
|
96.1
|
%
|
4.4
|
%
|
|||||||||||||||||||||||
|
Los Angeles County
|
546
|
1,681
|
11,166
|
9,960
|
||||||||||||||||||||||||||||||||
|
San Diego County
|
379
|
1,899
|
888
|
-
|
||||||||||||||||||||||||||||||||
|
Orange County
|
625
|
2,278
|
17,866
|
11,139
|
||||||||||||||||||||||||||||||||
|
Non-same property
|
1,550
|
1,963
|
29,920
|
21,099
|
||||||||||||||||||||||||||||||||
|
|
||||||||||||||||||||||||||||||||||||
|
Northern California
|
||||||||||||||||||||||||||||||||||||
|
Santa Clara County
|
3,671
|
1,993
|
1,831
|
8.8
|
%
|
88,552
|
96.3
|
%
|
81,567
|
96.8
|
%
|
8.6
|
%
|
|||||||||||||||||||||||
|
Contra Costa County
|
1,720
|
1,701
|
1,606
|
5.9
|
%
|
35,579
|
96.2
|
%
|
33,675
|
96.4
|
%
|
5.7
|
%
|
|||||||||||||||||||||||
|
Alameda County
|
1,542
|
1,651
|
1,515
|
9.0
|
%
|
31,823
|
96.7
|
%
|
29,270
|
96.8
|
%
|
8.7
|
%
|
|||||||||||||||||||||||
|
San Mateo County
|
768
|
2,037
|
1,837
|
10.9
|
%
|
19,366
|
96.9
|
%
|
17,451
|
97.2
|
%
|
11.0
|
%
|
|||||||||||||||||||||||
|
San Francisco MSA
|
175
|
2,288
|
2,046
|
11.8
|
%
|
4,707
|
93.1
|
%
|
4,292
|
95.9
|
%
|
9.7
|
%
|
|||||||||||||||||||||||
|
Other
|
230
|
1,621
|
1,548
|
4.7
|
%
|
4,481
|
95.3
|
%
|
4,323
|
96.0
|
%
|
3.7
|
%
|
|||||||||||||||||||||||
|
Total same-property
|
8,106
|
1,866
|
1,720
|
8.5
|
%
|
184,508
|
96.3
|
%
|
170,578
|
96.7
|
%
|
8.2
|
%
|
|||||||||||||||||||||||
|
San Francisco MSA
|
717
|
2,254
|
16,012
|
913
|
||||||||||||||||||||||||||||||||
|
Santa Clara County
|
608
|
1,948
|
13,882
|
3,834
|
||||||||||||||||||||||||||||||||
|
Non-same property
|
1,325
|
2,150
|
29,894
|
4,747
|
||||||||||||||||||||||||||||||||
|
|
||||||||||||||||||||||||||||||||||||
|
Seattle Metro
|
||||||||||||||||||||||||||||||||||||
|
King County
|
5,284
|
1,308
|
1,215
|
7.7
|
%
|
87,623
|
96.2
|
%
|
81,374
|
96.2
|
%
|
7.7
|
%
|
|||||||||||||||||||||||
|
Snohomish County
|
465
|
951
|
876
|
8.6
|
%
|
5,516
|
95.1
|
%
|
5,109
|
95.1
|
%
|
8.0
|
%
|
|||||||||||||||||||||||
|
Total same-property
|
5,749
|
1,279
|
1,188
|
7.7
|
%
|
93,139
|
96.1
|
%
|
86,483
|
96.1
|
%
|
7.7
|
%
|
|||||||||||||||||||||||
|
King County
|
954
|
1,569
|
14,414
|
6,006
|
||||||||||||||||||||||||||||||||
|
Non-same property
|
954
|
1,569
|
14,414
|
6,006
|
||||||||||||||||||||||||||||||||
|
|
||||||||||||||||||||||||||||||||||||
|
Other real estate assets
|
14,822
|
12,348
|
||||||||||||||||||||||||||||||||||
|
|
||||||||||||||||||||||||||||||||||||
|
Total same-property revenue
|
26,160
|
$
|
1,597
|
$
|
1,502
|
6.3
|
%
|
$
|
512,953
|
96.2
|
%
|
$
|
482,496
|
96.3
|
%
|
6.3
|
%
|
|||||||||||||||||||
|
|
||||||||||||||||||||||||||||||||||||
|
Total non-same property revenue
|
3,829
|
$
|
1,894
|
$
|
89,050
|
$
|
44,200
|
|||||||||||||||||||||||||||||
See Company's 10-K and 10-Q for additional disclosures
S-8.1
ESSEX PROPERTY TRUST, INC.
Development Pipeline - December 31, 2013
(Dollars in millions, except per unit amounts in thousands)
|
|
|
Ownership %
|
Estimated Units
|
Estimated Retail sq. feet
|
Incurred to Date
|
Remaining Costs
|
Estimated Total Cost
|
Essex Share of Estimated Total Cost
|
Apartment Cost per Unit
|
Construction Start
|
Initial Occupancy
|
Stabilized Operations
|
||||||||||||||||||||||||||||||||||
|
Development Projects - Consolidated
|
||||||||||||||||||||||||||||||||||||||||||||||
|
Project Name
|
Location
|
|||||||||||||||||||||||||||||||||||||||||||||
|
The Emme
|
Emeryville, CA
|
100
|
%
|
190
|
-
|
$
|
34.1
|
$
|
27.5
|
$
|
61.6
|
$
|
61.6
|
$
|
324
|
Q3 2012
|
Q3 2014
|
Q1 2015
|
||||||||||||||||||||||||||||
|
The Avery (1)
|
Los Angeles, CA
|
100
|
%
|
121
|
-
|
2.5
|
35.1
|
37.6
|
37.6
|
311
|
Q3 2012
|
Q1 2014
|
Q2 2014
|
|||||||||||||||||||||||||||||||||
|
Total Development Projects - Consolidated
|
311
|
-
|
36.6
|
62.6
|
99.2
|
99.2
|
319
|
|||||||||||||||||||||||||||||||||||||||
|
|
||||||||||||||||||||||||||||||||||||||||||||||
|
Predevelopment Projects - Consolidated
|
||||||||||||||||||||||||||||||||||||||||||||||
|
Project Name
|
Location
|
|||||||||||||||||||||||||||||||||||||||||||||
|
City Centre
|
Moorpark, CA
|
100
|
%
|
200
|
-
|
11.6
|
-
|
11.6
|
11.6
|
|||||||||||||||||||||||||||||||||||||
|
Other Projects
|
various
|
100
|
%
|
-
|
-
|
2.2
|
-
|
2.2
|
2.2
|
|||||||||||||||||||||||||||||||||||||
|
Total Predevelopment Projects - Consolidated
|
200
|
-
|
13.8
|
-
|
13.8
|
13.8
|
||||||||||||||||||||||||||||||||||||||||
|
Total Development Pipeline - Consolidated
|
511
|
-
|
50.4
|
62.6
|
113.0
|
113.0
|
||||||||||||||||||||||||||||||||||||||||
|
|
|
|||||||||||||||||||||||||||||||||||||||||||||
|
Development Projects - Joint Venture
|
||||||||||||||||||||||||||||||||||||||||||||||
|
Project Name
|
Location
|
|||||||||||||||||||||||||||||||||||||||||||||
|
Epic - Phase II
|
San Jose, CA
|
55
|
%
|
289
|
-
|
87.1
|
10.2
|
97.3
|
53.5
|
337
|
Q1 2012
|
Q4 2013
|
Q4 2014
|
|||||||||||||||||||||||||||||||||
|
Epic - Phase III
|
San Jose, CA
|
55
|
%
|
200
|
-
|
28.0
|
68.3
|
96.3
|
53.0
|
482
|
Q3 2013
|
Q3 2015
|
Q1 2016
|
|||||||||||||||||||||||||||||||||
|
Connolly Station
|
Dublin, CA
|
55
|
%
|
309
|
-
|
88.6
|
5.9
|
94.5
|
52.0
|
306
|
Q3 2011
|
Q3 2013
|
Q2 2014
|
|||||||||||||||||||||||||||||||||
|
The Huxley (2)
|
West Hollywood, CA
|
50
|
%
|
187
|
18,200
|
71.8
|
3.2
|
75.0
|
37.5
|
339
|
Q4 2011
|
Q1 2014
|
Q3 2014
|
|||||||||||||||||||||||||||||||||
|
The Dylan (2)
|
West Hollywood, CA
|
50
|
%
|
184
|
12,750
|
64.6
|
10.8
|
75.4
|
37.7
|
363
|
Q4 2011
|
Q2 2014
|
Q4 2014
|
|||||||||||||||||||||||||||||||||
|
Mosso I and Mosso II (2)
|
San Francisco, CA
|
55
|
%
|
463
|
9,300
|
191.2
|
58.8
|
250.0
|
137.5
|
530
|
Q2 2012
|
Q2 2014
|
Q1 2015
|
|||||||||||||||||||||||||||||||||
|
Park 20
|
San Mateo, CA
|
55
|
%
|
197
|
-
|
47.8
|
28.3
|
76.1
|
41.9
|
386
|
Q3 2012
|
Q3 2014
|
Q1 2015
|
|||||||||||||||||||||||||||||||||
|
One South Market (2)
|
San Jose, CA
|
55
|
%
|
312
|
6,000
|
30.9
|
114.2
|
145.1
|
79.8
|
458
|
Q2 2013
|
Q3 2015
|
Q2 2016
|
|||||||||||||||||||||||||||||||||
|
The Village (2)
|
Walnut Creek, CA
|
50
|
%
|
49
|
35,000
|
36.3
|
44.7
|
81.0
|
40.5
|
769
|
Q3 2013
|
Q3 2015
|
Q1 2016
|
|||||||||||||||||||||||||||||||||
|
Total Development Projects - Joint Venture
|
2,190
|
81,250
|
646.3
|
344.4
|
990.7
|
533.4
|
$
|
420
|
||||||||||||||||||||||||||||||||||||||
|
|
||||||||||||||||||||||||||||||||||||||||||||||
|
Grand Total - Development Pipeline
|
2,701
|
81,250
|
$
|
696.7
|
$
|
407.0
|
$
|
1,103.7
|
646.4
|
|||||||||||||||||||||||||||||||||||||
|
Essex Cost Incurred to Date
|
(397.2
|
)
|
||||||||||||||||||||||||||||||||||||||||||||
|
Essex Remaining Commitment
|
$
|
249.2
|
||||||||||||||||||||||||||||||||||||||||||||
| (1) | The Company invested $1.0 million and has incurred $1.5 million of additional internal costs as part of an agreement to purchase the property upon receipt of certificate of occupancy for total estimated cost of $37.6 million, which is expected in the first quarter of 2014. |
| (2) | Excludes the estimated allocation to retail square feet. |
See Company's 10-K and 10-Q for additional disclosures
S-9
ESSEX PROPERTY TRUST, INC.
Redevelopment Pipeline and Capital Expenditures - December 31, 2013
(Dollars in thousands, except per unit amounts)
|
|
|
|
|
|
|
|
|
|||||||||||||||||||||
|
|
Total
|
Estimated
|
Estimated
|
NOI
|
||||||||||||||||||||||||
|
|
Incurred
|
Remaining
|
Total
|
Project
|
For the year ended
|
|||||||||||||||||||||||
|
Region/Project Name
|
Units
|
To Date
|
Cost
|
Cost
|
Start
|
2013
|
2012
|
|||||||||||||||||||||
|
|
||||||||||||||||||||||||||||
|
Same-property - Redevelopment Projects (1) (2)
|
||||||||||||||||||||||||||||
|
Northern California
|
||||||||||||||||||||||||||||
|
Marina Cove, Santa Clara, CA
|
292
|
$
|
8,018
|
$
|
6,036
|
$
|
14,054
|
Q2 2007
|
||||||||||||||||||||
|
Magnolia Square, Sunnyvale, CA
|
188
|
9,571
|
3,722
|
13,293
|
Q3 2010
|
|||||||||||||||||||||||
|
Southern California
|
||||||||||||||||||||||||||||
|
Fairway @ Big Canyon
|
74
|
2,563
|
3,253
|
5,816
|
Q4 2012
|
|
|
|||||||||||||||||||||
|
Total Same-property - Redevelopment Projects
|
554
|
$
|
20,152
|
$
|
13,011
|
$
|
33,163
|
$
|
9,186
|
$
|
8,156
|
|||||||||||||||||
|
|
||||||||||||||||||||||||||||
|
Same-Property Redevelopment Vacancy Loss
|
$
|
2,320
|
$
|
1,531
|
||||||||||||||||||||||||
|
|
||||||||||||||||||||||||||||
|
Non-same property - Redevelopment Projects
|
||||||||||||||||||||||||||||
|
Seattle Metro
|
||||||||||||||||||||||||||||
|
Woodland Commons, Bellevue, WA
|
302
|
$
|
15,298
|
$
|
105
|
$
|
15,403
|
Q2 2007
|
||||||||||||||||||||
|
Southern California
|
||||||||||||||||||||||||||||
|
Bunker Hill Towers, Los Angeles
|
456
|
3,157
|
72,987
|
76,144
|
Q3 2013
|
|||||||||||||||||||||||
|
Total Non-same property - Redevelopment Projects
|
758
|
$
|
18,455
|
$
|
73,092
|
$
|
91,547
|
$
|
8,064
|
$
|
7,028
|
|||||||||||||||||
| (1) | Redevelopment activities are ongoing at these communities, but the communities have stabilized operations, therefore results are classified in same-property operations. |
| (2) | The Company incurred $0.4 million and $2.3 million of vacancy loss for the same-property portfolio, and $0.8 million and $3.6 million of vacancy loss for the total portfolio during the three and twelve months ended December 31, 2013, respectively. The Company completed the redevelopment of interiors totaling 319 and 1,524 units for the same-property portfolio and 339 and 1,692 units for the total portfolio, during the three and twelve months ended December 31, 2013, respectively. |
|
Non-revenue Generating Capital Expenditures
|
Q4 2013
|
Q3 2013
|
Q2 2013
|
Q1 2013
|
Q4 2012
|
Q3 2012
|
Q2 2012
|
|||||||||||||||||||||
|
|
||||||||||||||||||||||||||||
|
Non-revenue generating capital expenditures
|
$
|
5,153
|
$
|
9,536
|
$
|
8,330
|
$
|
4,019
|
$
|
14,715
|
$
|
8,736
|
$
|
5,840
|
||||||||||||||
|
Average apartment units in quarter
|
29,833
|
29,646
|
29,338
|
28,900
|
28,269
|
27,815
|
27,457
|
|||||||||||||||||||||
|
Capital expenditures per apartment unit in the quarter
|
$
|
173
|
$
|
322
|
$
|
284
|
$
|
139
|
$
|
521
|
$
|
314
|
$
|
213
|
||||||||||||||
|
Capital expenditures per apartment unit-trailing four quarters
|
$
|
906
|
$
|
1,235
|
$
|
1,220
|
$
|
1,153
|
$
|
1,079
|
$
|
1,004
|
$
|
926
|
See Company's 10-K and 10-Q for additional disclosures
S-10
ESSEX PROPERTY TRUST, INC.
|
Co-investments - December 31, 2013
|
Essex
|
Total
|
Essex
|
Weighted
|
Remaining
|
For the Quarter
|
For the Year Ended
|
|||||||||||||||||||||||||||||||||||||
|
(Dollars in thousands)
|
Ownership
|
Undepreciated
|
Debt
|
Book
|
Average
|
Term of
|
Ended December 31,
|
Ended December 31,
|
||||||||||||||||||||||||||||||||||||
|
|
Percentage
|
Units
|
Book Value
|
Amount
|
Value
|
Borrowing Rate
|
Debt/(in Years)
|
2013
|
2012
|
2013
|
2012
|
|||||||||||||||||||||||||||||||||
|
|
||||||||||||||||||||||||||||||||||||||||||||
|
Operating Non-consolidated Joint Ventures
|
Net Operating Income
|
|||||||||||||||||||||||||||||||||||||||||||
|
|
||||||||||||||||||||||||||||||||||||||||||||
|
Essex Apartment Value Fund II, L.P. (Fund II) (1)
|
28.2
|
%
|
165
|
$
|
30,894
|
$
|
12,724
|
$
|
4,166
|
5.8
|
%
|
0.7
|
$
|
611
|
$
|
7,268
|
$
|
2,375
|
$
|
33,936
|
||||||||||||||||||||||||
|
Wesco I, LLC (2)
|
50.0
|
%
|
2,713
|
670,361
|
355,953
|
142,025
|
4.0
|
%
|
9.3
|
8,412
|
6,992
|
33,236
|
23,445
|
|||||||||||||||||||||||||||||||
|
Wesco III, LLC (2) (3)
|
50.0
|
%
|
657
|
164,292
|
84,080
|
39,073
|
2.8
|
%
|
6.2
|
1,894
|
252
|
5,776
|
252
|
|||||||||||||||||||||||||||||||
|
Expo (4)
|
50.0
|
%
|
275
|
64,552
|
45,000
|
12,041
|
3.7
|
%
|
6.6
|
1,197
|
-
|
3,724
|
-
|
|||||||||||||||||||||||||||||||
|
Total Operating Non-consolidated Joint Ventures
|
3,810
|
$
|
930,099
|
$
|
497,757
|
197,305
|
3.8
|
%
|
8.3
|
$
|
12,114
|
$
|
14,512
|
$
|
45,111
|
$
|
57,633
|
|||||||||||||||||||||||||||
|
|
||||||||||||||||||||||||||||||||||||||||||||
|
|
Essex Portion of NOI and Expenses
|
|||||||||||||||||||||||||||||||||||||||||||
|
Essex portion of NOI
|
$
|
5,924
|
$
|
5,672
|
$
|
22,038
|
$
|
24,143
|
||||||||||||||||||||||||||||||||||||
|
Essex portion of depreciation
|
(4,351
|
)
|
(3,213
|
)
|
(15,532
|
)
|
(14,152
|
)
|
||||||||||||||||||||||||||||||||||||
|
Essex portion of interest expense and other
|
(1,933
|
)
|
(2,179
|
)
|
(5,718
|
)
|
(10,987
|
)
|
||||||||||||||||||||||||||||||||||||
|
Essex portion of gain (Fund II)
|
-
|
29,112
|
38,752
|
29,112
|
||||||||||||||||||||||||||||||||||||||||
|
Essex portion of net income (loss) from operating co-investments
|
$
|
(360
|
)
|
$
|
29,392
|
$
|
39,540
|
$
|
28,116
|
|||||||||||||||||||||||||||||||||||
|
|
||||||||||||||||||||||||||||||||||||||||||||
|
Development Joint Ventures (5) (6) (7)
|
50/55
|
%
|
2,470
|
$
|
740,116
|
$
|
97,700
|
337,198
|
1.6
|
%
|
32.9
|
$
|
374
|
$
|
(50
|
)
|
$
|
48
|
$
|
182
|
||||||||||||||||||||||||
|
|
||||||||||||||||||||||||||||||||||||||||||||
|
|
Weighted
|
Weighted
|
||||||||||||||||||||||||||||||||||||||||||
|
|
Average
|
Average
|
||||||||||||||||||||||||||||||||||||||||||
|
|
Preferred
|
Expected
|
||||||||||||||||||||||||||||||||||||||||||
|
|
Return
|
Term
|
Income from Preferred Equity Investments
|
|||||||||||||||||||||||||||||||||||||||||
|
|
Equity Investments
|
|||||||||||||||||||||||||||||||||||||||||||
|
Preferred Equity Investments (8)
|
142,630
|
10.0
|
%
|
4.1
|
$
|
3,556
|
$
|
3,405
|
$
|
16,277
|
$
|
13,447
|
||||||||||||||||||||||||||||||||
|
|
||||||||||||||||||||||||||||||||||||||||||||
|
Total Co-investments
|
$
|
677,133
|
$
|
3,570
|
$
|
32,747
|
$
|
55,865
|
$
|
41,745
|
||||||||||||||||||||||||||||||||||
| (1) | The Company has a 28.2% interest as a general partner and limited partner in Fund II, and may earn promote income if Fund II exceeds certain financial return benchmarks. As of Q4 2013, 12 of the 14 properties in Fund II were sold. The two remaining properties are expected to be sold in 2014. The three and twelve months ended December 31, 2012 reflect NOI results for the 14 properties. |
| (2) | The Company has a 50% interest in Wesco I and III and the Company may earn promote income if the co-investment exceeds certain financial benchmarks. |
| (3) | The Company has provided two bridge loans totaling $56.8 million to Wesco III at a rate of LIBOR + 250, permanent financing is expected to be placed on the Gas Company Lofts and Regency at Mt. View by the end of Q1 2014. In January, WESCO III repaid the loan on Gas Company Lofts and obtained a new $37.5 million loan at an all in rate of 3.71% and matures in 2020. |
| (4) | NOI generated from the lease-up of Expo was included in Development Joint Ventures in the prior year; operations from Expo were reclassified to Operating Joint Ventures in Q1 2013. |
| (5) | The Company has interests in nine development co-investments, which are detailed on S-9. NOI generated from the lease-up of Epic and Connolly Station are included in Development Joint Ventures. |
| (6) | The Huxley and The Dylan have a combined $97.7 million of long-term tax-exempt bond debt that are subject to total return swaps that mature in 2016. |
| (7) | Includes Phase I of Epic which stabilized in October 2013 but shares amenities and personnel with Phase II of Epic. |
| (8) | Included in preferred equity income are early redemption fees earned totaling $1.4 million for the twelve months ended December 31, 2013. |
See Company's 10-K and 10-Q for additional disclosures
S-11
ESSEX PROPERTY TRUST, INC.
Summary of Consolidated Co-Investments and Noncontrolling Interest - December 31, 2013
(Dollars in thousands)
The Company enters into co-investment transactions with third party developers, owners and investors of apartment communities. In accordance with GAAP, the Company consolidates certain of these co-investment transactions, resulting in noncontrolling interests corresponding to the ownership interest of the third-party developer, owner or investor.
The following table summarizes the consolidated co-investments and noncontrolling interest:
|
|
Operations for the year ended
|
|||||||||||||||||||||||||||
|
|
Balance as of December 31, 2013
|
December 31, 2013
|
||||||||||||||||||||||||||
|
|
Investment in
Real Estate |
Related
Debt |
Noncontrolling
Interest |
DownREIT
Units Outstanding (1) |
Revenue
|
Operating
Expenses |
NOI
|
|||||||||||||||||||||
|
|
||||||||||||||||||||||||||||
|
Noncontrolling Interest - DownREIT:
|
||||||||||||||||||||||||||||
|
Barkley Apartments
|
$
|
8,331
|
$
|
16,534
|
$
|
1,696
|
74,248
|
$
|
2,639
|
$
|
961
|
$
|
1,678
|
|||||||||||||||
|
Brentwood (2)
|
-
|
-
|
2,568
|
58,884
|
-
|
-
|
-
|
|||||||||||||||||||||
|
Brookside Oaks
|
31,698
|
19,652
|
2,239
|
80,903
|
3,938
|
854
|
3,084
|
|||||||||||||||||||||
|
Capri at Sunny Hills
|
15,760
|
-
|
2,945
|
158,665
|
2,514
|
731
|
1,783
|
|||||||||||||||||||||
|
Hidden Valley (3)
|
36,944
|
30,027
|
6,089
|
62,647
|
5,600
|
1,733
|
3,867
|
|||||||||||||||||||||
|
Highridge Apartments
|
30,177
|
44,807
|
2,826
|
270,158
|
6,710
|
1,475
|
5,235
|
|||||||||||||||||||||
|
Montejo Apartments
|
7,863
|
13,064
|
1,216
|
29,319
|
1,926
|
529
|
1,397
|
|||||||||||||||||||||
|
The Elliot at Mukilteo
|
15,714
|
10,750
|
1,212
|
100,713
|
3,438
|
1,398
|
2,040
|
|||||||||||||||||||||
|
Magnolia Square
|
31,001
|
18,133
|
6,356
|
57,231
|
3,650
|
992
|
2,658
|
|||||||||||||||||||||
|
Fairhaven Apartments
|
12,683
|
16,954
|
2,951
|
67,728
|
2,675
|
733
|
1,942
|
|||||||||||||||||||||
|
Valley Park Apartments
|
13,283
|
22,180
|
53
|
3,831
|
3,034
|
867
|
2,167
|
|||||||||||||||||||||
|
Villa Angelina Apartments
|
19,356
|
27,040
|
1,593
|
43,552
|
4,077
|
1,041
|
3,036
|
|||||||||||||||||||||
|
|
||||||||||||||||||||||||||||
|
|
$
|
222,810
|
$
|
219,141
|
31,744
|
1,007,879
|
$
|
40,201
|
$
|
11,314
|
$
|
28,887
|
||||||||||||||||
|
|
||||||||||||||||||||||||||||
|
Other Components of Noncontrolling Interest:
|
||||||||||||||||||||||||||||
|
Hillsdale Garden Apartments (4)
|
$
|
108,022
|
20,921
|
$
|
17,475
|
$
|
5,499
|
$
|
11,976
|
|||||||||||||||||||
|
Operating Limited Partnership Units and Other
|
60,954
|
|||||||||||||||||||||||||||
|
Total Noncontrolling Interest
|
$
|
113,619
|
||||||||||||||||||||||||||
| (1) | Generally, DownREIT units are redeemed for cash at a value equal to Essex's common stock. |
| (2) | The property was sold in Q4 2013 and will be used in a 1031 exchange. Attributable to the 1031 exchange, the partnership underlying the noncontrolling interest remains in place and the 1031 exchange is expected to be completed in 2014. The operating results are reflected in discontinued operations. |
| (3) | The DownREIT has a 75% interest in this community and a joint venture partner has a 25% interest. |
| (4) | The Company has an 81.5% interest in this community and the joint venture partner has an 18.5% interest. |
See Company's 10-K and 10-Q for additional disclosures
S-12
ESSEX PROPERTY TRUST, INC.
Income From Discontinued Operations and Selected Financial Data - December 31, 2013
(Dollars in thousands)
Income from Discontinued Operations
For the quarter ended December 31, 2013, the Company sold Cambridge, a 40 unit property located in Chula Vista, California for gross proceeds of $4.7 million resulting in a net gain of $2.5 million and Brentwood, a 140 unit property located in Santa Ana, California for gross proceeds of $27.5 million and a net gain of $14.0 million. During the year ended December 31, 2013, the Company also sold Linden Square in Seattle, Washington for $25.3 million with a net gain of $12.7 million. During 2012 the Company sold two properties located in San Diego, California for gross proceeds of $28.3 million resulting in a net gain of $9.8 million
|
|
Three Months Ended
|
Year Ended
|
||||||||||||||
|
|
December 31,
|
December 31,
|
||||||||||||||
|
|
2013
|
2012
|
2013
|
2012
|
||||||||||||
|
Rental revenues
|
$
|
574
|
$
|
1,334
|
$
|
4,454
|
$
|
5,848
|
||||||||
|
Property operating expenses
|
(131
|
)
|
(499
|
)
|
(1,406
|
)
|
(2,181
|
)
|
||||||||
|
Depreciation and amortization
|
(124
|
)
|
(353
|
)
|
(1,098
|
)
|
(1,513
|
)
|
||||||||
|
Income from real estate sold
|
319
|
482
|
1,950
|
2,154
|
||||||||||||
|
Gain on sale, net of internal disposition costs and taxes
|
16,564
|
-
|
29,223
|
9,783
|
||||||||||||
|
Income from discontinued operations
|
$
|
16,883
|
$
|
482
|
$
|
31,173
|
$
|
11,937
|
||||||||
|
|
||||||||||||||||
|
Shares Outstanding and Potentially Dilutive Securities
|
||||||||||||||||
|
|
||||||||||||||||
|
|
Q4 2013
|
Actual
|
YTD 2013
|
|||||||||||||
|
|
Weighted Avg.
|
As of 12/31/13
|
Weighted Avg.
|
|||||||||||||
|
Common Shares
|
37,373,783
|
37,421,219
|
37,248,960
|
|||||||||||||
|
Stock Options and Series G Preferred Stock
|
113,376
|
111,726
|
120,691
|
|||||||||||||
|
Weighted Avg. Shares Diluted - EPS
|
37,487,159
|
37,532,945
|
37,369,651
|
|||||||||||||
|
Operating Limited Partnership Units
|
2,146,919
|
2,149,802
|
2,131,425
|
|||||||||||||
|
Weighted Avg. Shares Diluted - FFO
|
39,634,078
|
39,682,747
|
39,501,076
|
|||||||||||||
See Company's 10-K and 10-Q for additional disclosures
S-13
ESSEX PROPERTY TRUST, INC.
Assumptions for 2014 FFO Guidance Range
All Estimates are for ESS on a Stand Alone Basis
Excludes Merger Related Costs in 2014
($'s in thousands, except share and per share data)
|
|
Low - end of
|
High - end of
|
||||||||||
|
|
Actual
|
Guidance range
|
Guidance range
|
|||||||||
|
|
YTD 2013
|
2014
|
2014
|
|||||||||
|
Net Operating Income ("NOI")
|
||||||||||||
|
Total NOI from consolidated communities
|
$
|
405,991
|
$
|
439,000
|
$
|
445,000
|
||||||
|
|
||||||||||||
|
Discontinued Operations NOI
|
3,048
|
-
|
-
|
|||||||||
|
|
||||||||||||
|
Accretion from external growth, net of dispositions
|
-
|
500
|
500
|
|||||||||
|
|
||||||||||||
|
Management Fees
|
11,700
|
10,100
|
11,200
|
|||||||||
|
|
||||||||||||
|
Interest Expense
|
||||||||||||
|
Interest and amortization expense, before capitalized interest
|
(133,024
|
)
|
(134,300
|
)
|
(131,300
|
)
|
||||||
|
Projected interest capitalized
|
16,500
|
12,200
|
13,200
|
|||||||||
|
Net interest expense
|
(116,524
|
)
|
(122,100
|
)
|
(118,100
|
)
|
||||||
|
|
||||||||||||
|
Recurring Income and Expenses
|
||||||||||||
|
Interest and other income
|
9,114
|
9,400
|
10,200
|
|||||||||
|
FFO from co-investments
|
31,287
|
36,200
|
37,200
|
|||||||||
|
General and administrative expense
|
(24,440
|
)
|
(25,000
|
)
|
(26,000
|
)
|
||||||
|
Cost of management and other fees
|
(6,681
|
)
|
(6,800
|
)
|
(6,800
|
)
|
||||||
|
Preferred dividends and non-controlling interest
|
(13,399
|
)
|
(14,000
|
)
|
(14,000
|
)
|
||||||
|
|
(4,119
|
)
|
(200
|
)
|
600
|
|||||||
|
|
||||||||||||
|
Non-Core Income and Expenses
|
||||||||||||
|
Promote income from co-investment
|
-
|
2,000
|
6,000
|
|||||||||
|
Gains on sales of marketable securities, land, note prepayment
|
4,022
|
-
|
-
|
|||||||||
|
Gains from early redemption of preferred equity investments
|
1,358
|
-
|
-
|
|||||||||
|
Loss on early retirement of debt
|
(300
|
)
|
-
|
-
|
||||||||
|
Merger expenses
|
(4,284
|
)
|
-
|
-
|
||||||||
|
Acquisition costs
|
(1,161
|
)
|
(1,000
|
)
|
(1,600
|
)
|
||||||
|
|
(365
|
)
|
1,000
|
4,400
|
||||||||
|
|
||||||||||||
|
Funds from Operations
|
$
|
299,731
|
$
|
328,300
|
$
|
343,600
|
||||||
|
|
||||||||||||
|
Funds from Operations per diluted Share
|
$
|
7.59
|
$
|
8.13
|
$
|
8.50
|
||||||
|
|
||||||||||||
|
% Change - Funds from Operations
|
13.1
|
%
|
7.1
|
%
|
12.1
|
%
|
||||||
|
|
||||||||||||
|
Funds from Operations excluding non-core items
|
$
|
300,096
|
$
|
327,300
|
$
|
339,200
|
||||||
|
|
||||||||||||
|
Core Funds from Operations per diluted Share
|
$
|
7.60
|
$
|
8.10
|
$
|
8.40
|
||||||
|
|
||||||||||||
|
% Change - Core Funds from Operations
|
11.4
|
%
|
6.6
|
%
|
10.5
|
%
|
||||||
|
|
||||||||||||
|
Weighted average shares outstanding
|
39,501,076
|
40,400,000
|
40,400,000
|
|||||||||
See Company's 10-K and 10-Q for additional disclosures
S-14
ESSEX PROPERTY TRUST, INC.
Summary of Apartment Community Acquisitions and Dispositions Activity
Year ended December 31, 2013 and Q1 2014 to date
(Dollars in thousands)
|
Acquisitions
|
|
|
Essex
Ownership |
|
|
Purchase
|
Price per
|
Average
|
||||||||||||||||||||
|
Property Name
|
Location
|
Units
|
Percentage
|
Ownership
|
Date
|
Price
|
Unit
|
Rent
|
||||||||||||||||||||
|
|
|
|
|
|||||||||||||||||||||||||
|
Annaliese
|
Seattle, WA
|
56
|
100
|
%
|
EPLP
|
Jan-13
|
$
|
19,000
|
$
|
339
|
$
|
1,734
|
||||||||||||||||
|
Bennett Lofts (1)
|
San Francisco, CA
|
34
|
100
|
%
|
EPLP
|
Jan-13
|
22,220
|
654
|
3,028
|
|||||||||||||||||||
|
Fox Plaza (2)
|
San Francisco, CA
|
444
|
100
|
%
|
EPLP
|
Feb-13
|
135,000
|
257
|
1,878
|
|||||||||||||||||||
|
Q1 2013 Total
|
534
|
176,220
|
291
|
|||||||||||||||||||||||||
|
|
|
|
|
|||||||||||||||||||||||||
|
Regency at Mountain View
|
Mountain View, CA
|
142
|
50
|
%
|
Wesco III, LLC
|
May-13
|
42,500
|
299
|
2,012
|
|||||||||||||||||||
|
Gas Company Lofts
|
Los Angeles, CA
|
251
|
50
|
%
|
Wesco III, LLC
|
Jun-13
|
71,000
|
283
|
2,017
|
|||||||||||||||||||
|
Q2 2013 Total
|
393
|
113,500
|
289
|
|||||||||||||||||||||||||
|
|
|
|
|
|||||||||||||||||||||||||
|
Slater 116
|
Kirkland, WA
|
108
|
100
|
%
|
EPLP
|
Sep-13
|
29,600
|
274
|
1,502
|
|||||||||||||||||||
|
Q3 2013 Total
|
108
|
29,600
|
274
|
|||||||||||||||||||||||||
|
|
|
|
|
|||||||||||||||||||||||||
|
Vox
|
Seattle, WA
|
58
|
100
|
%
|
EPLP
|
Oct-13
|
22,235
|
383
|
2,051
|
|||||||||||||||||||
|
Domain
|
San Diego, CA
|
379
|
100
|
%
|
EPLP
|
Nov-13
|
121,000
|
319
|
1,899
|
|||||||||||||||||||
|
Q4 2013 Total
|
437
|
$
|
143,235
|
$
|
328
|
|||||||||||||||||||||||
|
|
|
|
|
|||||||||||||||||||||||||
|
Dispositions
|
|
Essex
Ownership |
|
|
Sales
|
Price per
|
||||||||||||||||||||||
|
|
|
Units
|
Percentage
|
Ownership
|
Date
|
Price
|
Unit
|
|||||||||||||||||||||
|
|
|
|
|
|||||||||||||||||||||||||
|
|
|
|
|
|||||||||||||||||||||||||
|
Q2 2013 Total
|
222
|
28.2
|
%
|
Fund II
|
May-13
|
$
|
26,400
|
$
|
119
|
|||||||||||||||||||
|
|
|
|
|
|||||||||||||||||||||||||
|
|
|
897
|
28.2
|
%
|
Fund II
|
Various
|
294,000
|
328
|
||||||||||||||||||||
|
|
|
183
|
100
|
%
|
EPLP
|
Sep-13
|
25,300
|
138
|
||||||||||||||||||||
|
Q3 2013 Total
|
1,080
|
319,300
|
296
|
|||||||||||||||||||||||||
|
|
|
|
|
|||||||||||||||||||||||||
|
|
|
40
|
100
|
%
|
EPLP
|
Oct-13
|
4,650
|
116
|
||||||||||||||||||||
|
|
|
140
|
100
|
%
|
EPLP
|
Dec-13
|
27,535
|
197
|
||||||||||||||||||||
|
Q4 2013 Total
|
180
|
32,185
|
179
|
|||||||||||||||||||||||||
|
|
|
|
|
|||||||||||||||||||||||||
|
|
|
106
|
100
|
%
|
EPLP
|
Jan-14
|
14,350
|
135
|
||||||||||||||||||||
|
Q1 2014 to date
|
106
|
$
|
14,350
|
$
|
135
|
|||||||||||||||||||||||
| (1) | The 147 unit apartment community was acquired in two phases for $96.0 million. Approximately 75% was acquired in December 2012 with the remainder acquired on January 8, 2013. |
| (2) | The price per unit excludes $21.0 million attributed to the allocation of cost of the retail and parking garage at the community. |
See Company's 10-K and 10-Q for additional disclosures
S-15
ESSEX PROPERTY TRUST, INC.
|
2014 MSA Level Forecasts: Supply, Jobs and Apartment Market Conditions
|
||||||||||||||||||||||||||||||||
|
|
Residential Supply (1)
|
Job Forecast (2)
|
Market Forecast (3)
|
|||||||||||||||||||||||||||||
|
Market
|
New MF
Supply
|
New SF
Supply
|
Total Supply
|
% of MF
Supply to
MF Stock
|
% of Total
Supply to
Total Stock
|
Est. New
Jobs Dec-Dec
|
% Growth
|
Estimated Rent
Growth
|
||||||||||||||||||||||||
|
|
||||||||||||||||||||||||||||||||
|
Seattle
|
8,500
|
6,500
|
15,000
|
1.9
|
%
|
1.3
|
%
|
39,000
|
2.6
|
%
|
5.4
|
%
|
||||||||||||||||||||
|
|
||||||||||||||||||||||||||||||||
|
San Francisco
|
4,500
|
525
|
5,025
|
1.2
|
%
|
0.7
|
%
|
26,200
|
2.5
|
%
|
6.4
|
%
|
||||||||||||||||||||
|
Oakland
|
2,000
|
2,900
|
4,900
|
0.6
|
%
|
0.5
|
%
|
20,300
|
2.0
|
%
|
5.4
|
%
|
||||||||||||||||||||
|
San Jose
|
4,300
|
1,800
|
6,100
|
1.7
|
%
|
0.9
|
%
|
26,500
|
2.8
|
%
|
7.9
|
%
|
||||||||||||||||||||
|
No. Cal.
|
10,800
|
5,225
|
16,025
|
1.3
|
%
|
0.7
|
%
|
73,000
|
2.5
|
%
|
6.8
|
%
|
||||||||||||||||||||
|
|
||||||||||||||||||||||||||||||||
|
Ventura
|
650
|
1,200
|
1,850
|
1.0
|
%
|
0.7
|
%
|
4,800
|
1.7
|
%
|
4.3
|
%
|
||||||||||||||||||||
|
Los Angeles
|
9,000
|
3,300
|
12,300
|
0.6
|
%
|
0.4
|
%
|
75,500
|
1.9
|
%
|
5.3
|
%
|
||||||||||||||||||||
|
Orange
|
3,250
|
3,500
|
6,750
|
0.8
|
%
|
0.6
|
%
|
28,700
|
2.0
|
%
|
4.6
|
%
|
||||||||||||||||||||
|
San Diego
|
2,500
|
2,500
|
5,000
|
0.6
|
%
|
0.4
|
%
|
23,400
|
1.8
|
%
|
3.7
|
%
|
||||||||||||||||||||
|
So. Cal.
|
15,400
|
10,500
|
25,900
|
0.7
|
%
|
0.5
|
%
|
132,400
|
1.9
|
%
|
4.7
|
%
|
||||||||||||||||||||
|
|
||||||||||||||||||||||||||||||||
|
Weighted Average (4)
|
34,700
|
22,225
|
56,925
|
1.1
|
%
|
0.7
|
%
|
244,400
|
2.2
|
%
|
5.6
|
%
|
||||||||||||||||||||
All data are based on Essex Property Trust, Inc. forecasts.
U.S. Economic Assumptions: 2014 G.D.P. Growth: 2.8% , 2014 Job Growth: 1.8%
(1) New Residential Supply: MF reflects Company's internal estimate of actual multifamily deliveries; SF is based on 12 month single family trailing permits reported by the US Census Bureau.
(2) Job Forecast: refers to the difference between total non-farm industry employment (not seasonally adjusted) projected through Dec 2014 over estimated Dec 2013, expressed as total new jobs and growth rates.
(3) Market Forecast: the estimated rent growth represents the forecasted change in effective market rents for Q4 2014 vs Q4 2013 (excludes submarkets not targeted by Essex).
(4) Weighted Average: markets weighted by economic rent in the Company's portfolio.
See Company's 10-K and 10-Q for additional disclosures.
S-16
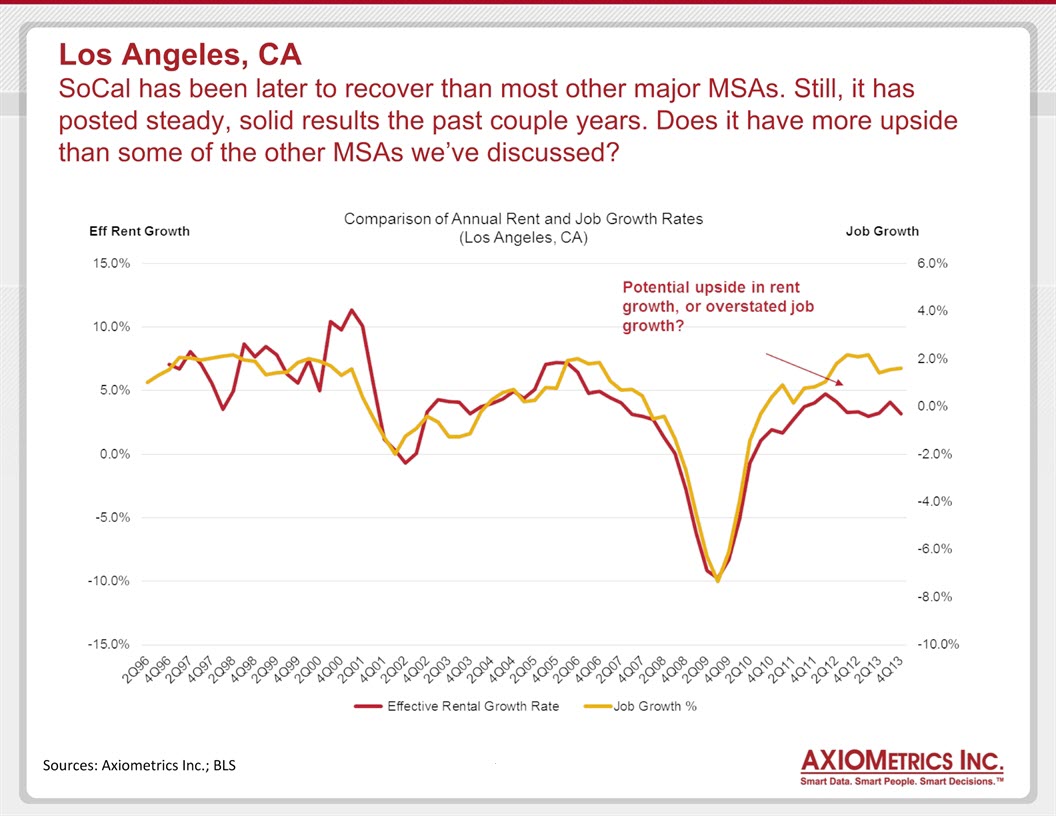
© 2013 AXIOMETRICS INC. ALL RIGHTS RESERVED. * Los Angeles, CASoCal has been later to recover than most other major MSAs. Still, it has posted steady, solid results the past couple years. Does it have more upside than some of the other MSAs we’ve discussed? Sources: Axiometrics Inc.; BLS S-17
S-17
ESSEX PROPERTY TRUST, INC. APARTMENT COMMUNITIES
Real Estate Information as of January 30, 2014
|
Property Name
|
Address
|
City
|
State
|
Units
|
Square
Footage |
|
Year
Acquired |
Year
Built |
Property
Ownership |
Age of
Property |
|
|
|
|
|
|
|
|
|
|
|
|
|
NORTHERN CALIFORNIA
|
||||||||||
|
Santa Clara County
|
|
|
|
|
|
|
|
|
|
|
|
The Commons
|
275 Union Avenue
|
Campbell
|
CA
|
264
|
153,168
|
|
2010
|
1973
|
EPLP
|
40
|
|
Pointe at Cupertino
|
19920 Olivewood Street
|
Cupertino
|
CA
|
116
|
135,200
|
|
1998
|
1963
|
EPLP
|
50
|
|
Regency at Mountain View
|
333 Escuela Avenue
|
Mountain View
|
CA
|
142
|
127,600
|
|
2013
|
1970
|
Wesco III
|
43
|
|
Bella Villagio
|
383 Vista Roma Way
|
San Jose
|
CA
|
231
|
227,511
|
|
2010
|
2004
|
EPLP
|
9
|
|
Epic - Phase I
|
545 River Oaks Parkway
|
San Jose
|
CA
|
280
|
249,080
|
|
|
2013
|
JV-55%
|
0
|
|
Epic - Phase II
|
545 River Oaks Parkway
|
San Jose
|
CA
|
289
|
223,156
|
|
|
|
JV-55%
|
|
|
Epic - Phase III
|
545 River Oaks Parkway
|
San Jose
|
CA
|
200
|
187,794
|
|
|
|
JV-55%
|
|
|
Carlyle, The
|
2909 Nieman Boulevard
|
San Jose
|
CA
|
132
|
129,200
|
|
2000
|
2000
|
EPLP
|
13
|
|
Esplanade
|
350 East Taylor St.
|
San Jose
|
CA
|
278
|
279,000
|
|
2004
|
2002
|
EPLP
|
11
|
|
One South Market
|
1 S. Market Street
|
San Jose
|
CA
|
312
|
283,268
|
|
|
|
JV-55%
|
|
|
Waterford, The
|
1700 N. First Street
|
San Jose
|
CA
|
238
|
219,600
|
|
2000
|
2000
|
EPLP
|
13
|
|
101 San Fernando
|
99 S. Fourth Street
|
San Jose
|
CA
|
323
|
296,078
|
|
2010
|
2001
|
EPLP
|
12
|
|
Willow Lake
|
1331 Lakeshore Circle
|
San Jose
|
CA
|
508
|
471,744
|
|
2012
|
1989
|
EPLP
|
24
|
|
1000 Kiely
|
1000 Kiely Blvd.
|
Santa Clara
|
CA
|
121
|
128,486
|
|
2011
|
1971
|
EPLP
|
42
|
|
Le Parc
|
440 N. Winchester Avenue
|
Santa Clara
|
CA
|
140
|
113,200
|
|
1994
|
1975
|
EPLP
|
38
|
|
Marina Cove
|
3480 Granada Avenue
|
Santa Clara
|
CA
|
292
|
250,200
|
|
1994
|
1974
|
EPLP
|
39
|
|
Riley Square
|
3707 Poinciana Drive
|
Santa Clara
|
CA
|
156
|
126,900
|
|
2012
|
1972
|
Wesco I
|
41
|
|
Bristol Commons
|
732 E. Evelyn Avenue
|
Sunnyvale
|
CA
|
188
|
142,600
|
|
1995
|
1989
|
EPLP
|
24
|
|
Brookside Oaks
|
1651 Belleville Way
|
Sunnyvale
|
CA
|
170
|
119,900
|
|
2000
|
1973
|
DownREIT
|
40
|
|
Magnolia Lane
|
113 South Mary Avenue
|
Sunnyvale
|
CA
|
32
|
31,541
|
|
2007
|
2001
|
EPLP
|
12
|
|
Montclaire
|
450 N. Mathilda Avenue
|
Sunnyvale
|
CA
|
390
|
294,100
|
|
1988
|
1973
|
EPLP
|
40
|
|
Reed Square
|
1070 Reed Avenue
|
Sunnyvale
|
CA
|
100
|
95,440
|
|
2011
|
1970
|
EPLP
|
43
|
|
Summerhill Park
|
972 Corte Madera Avenue
|
Sunnyvale
|
CA
|
100
|
78,500
|
|
1988
|
1988
|
EPLP
|
25
|
|
Magnolia Square
|
107 South Mary Avenue
|
Sunnyvale
|
CA
|
156
|
110,824
|
|
2007
|
1969
|
DownREIT
|
44
|
|
Via
|
315 Tasman Drive
|
Sunnyvale
|
CA
|
284
|
309,421
|
|
2011
|
2011
|
EPLP
|
2
|
|
Windsor Ridge
|
825 E. Evelyn Avenue
|
Sunnyvale
|
CA
|
216
|
161,800
|
|
1989
|
1989
|
EPLP
|
24
|
|
|
|
|
14%
|
4,857
|
4,251,093
|
|
|
|
|
|
|
Alameda County
|
|
|
|
|
|
|
|
|
|
|
|
Fourth & U
|
700 University Avenue
|
Berkeley
|
CA
|
171
|
146,255
|
|
2010
|
2010
|
EPLP
|
3
|
|
Briarwood
|
4200 Bay Street
|
Fremont
|
CA
|
160
|
111,160
|
|
2011
|
1978
|
Wesco I
|
35
|
|
Stevenson Place
|
4141 Stevenson Blvd.
|
Fremont
|
CA
|
200
|
146,200
|
|
2000
|
1975
|
EPLP
|
38
|
|
The Woods
|
40640 High Street
|
Fremont
|
CA
|
160
|
105,280
|
|
2011
|
1978
|
Wesco I
|
35
|
|
Boulevard
|
40001 Fremont Blvd.
|
Fremont
|
CA
|
172
|
131,200
|
|
1996
|
1978
|
EPLP
|
35
|
|
City View
|
25200 Carlos Bee Blvd.
|
Hayward
|
CA
|
572
|
462,400
|
|
1998
|
1975
|
EPLP
|
38
|
|
The Grand
|
100 Grand Avenue
|
Oakland
|
CA
|
243
|
205,026
|
|
2009
|
2009
|
EPLP
|
4
|
|
Bridgeport
|
36826 Cherry Street
|
Newark
|
CA
|
184
|
139,000
|
|
1987
|
1987
|
EPLP
|
26
|
|
Alderwood Park Apartments
|
37057 Magnolia Street
|
Newark
|
CA
|
96
|
74,624
|
|
2006
|
1987
|
Fund II
|
26
|
|
|
|
|
6%
|
1,958
|
1,521,145
|
|
|
|
|
|
|
Contra Costa County
|
|
|
|
|
|
|
|
|
|
|
|
Connolly Station
|
7550 St. Patrick Way
|
Dublin
|
CA
|
309
|
286,348
|
|
|
|
JV-55%
|
|
|
The Emme (fka 64th and Christie)
|
64th and Christie Avenue
|
Emeryville
|
CA
|
190
|
148,935
|
|
|
|
EPLP
|
|
|
San Marcos
|
2601 Hilltop Drive
|
Richmond
|
CA
|
432
|
407,600
|
|
2003
|
2003
|
EPLP
|
10
|
|
Bel Air
|
2000 Shoreline Drive
|
San Ramon
|
CA
|
462
|
391,000
|
|
1995
|
1988
|
EPLP
|
25
|
|
Foothill Gardens
|
1110 Harness Drive
|
San Ramon
|
CA
|
132
|
155,100
|
|
1997
|
1985
|
EPLP
|
28
|
|
Twin Creeks
|
2711-2731 Morgan Drive
|
San Ramon
|
CA
|
44
|
51,700
|
|
1997
|
1985
|
EPLP
|
28
|
|
Canyon Oaks
|
1 Amberstone Lane
|
San Ramon
|
CA
|
250
|
237,894
|
|
2007
|
2005
|
EPLP
|
8
|
|
Mill Creek at Windermere
|
2100 Waterstone Place
|
San Ramon
|
CA
|
400
|
381,060
|
|
2007
|
2005
|
EPLP
|
8
|
|
The Village
|
1500 Newell Avenue
|
Walnut Creek
|
CA
|
49
|
106,228
|
|
|
|
JV - 50%
|
|
| 5% |
1,720
|
1,624,354
|
||||||||
S-18
ESSEX PROPERTY TRUST, INC. APARTMENT COMMUNITIES
Real Estate Information as of January 30, 2014
| Property Name |
Address
|
City
|
State
|
Units
|
Square
Footage |
Year
Acquired |
Year
Built |
Property
Ownership |
Age of
Property |
|
|
San Mateo County
|
|
|
|
|
|
|
|
|
|
|
|
Belmont Terrace
|
1606 Continetals Way
|
Belmont
|
CA
|
71
|
72,951
|
|
2006
|
1974
|
EPLP
|
39
|
|
Davey Glen
|
200 Davey Glen Road
|
Belmont
|
CA
|
69
|
65,974
|
|
2006
|
1962
|
Fund II
|
51
|
|
Hillsdale Garden
|
3421 Edison Avenue
|
San Mateo
|
CA
|
697
|
611,505
|
|
2006
|
1948
|
JV - 81.5%
|
65
|
|
Park 20 (fka Elkhorn)
|
1950 Elkhorn Court
|
San Mateo
|
CA
|
197
|
140,547
|
|
|
|
JV - 55%
|
|
|
|
|
|
2%
|
837
|
750,430
|
|
|
|
|
|
|
|
|
|
|
|
|
|
|
|
|
|
|
San Francisco and Marin Counties
|
|
|
|
|
|
|
|
|
|
|
|
Mt. Sutro Terrace Apartments
|
480 Warren Drive
|
San Francisco
|
CA
|
99
|
64,000
|
|
1999
|
1973
|
EPLP
|
40
|
|
Park West
|
121 Funston
|
San Francisco
|
CA
|
126
|
90,060
|
|
2012
|
1958
|
EPLP
|
55
|
|
Bennett Lofts
|
530, 542, 548 Brannan
|
San Francisco
|
CA
|
150
|
184,713
|
|
2012
|
2004
|
EPLP
|
9
|
|
|
208 Pennsylvania and 1001 Mariposa
|
|
|
|
|
|
|
|
|
|
|
Mosso I and Mosso II
|
900 Folsom Street and 250 Fifth Street
|
San Francisco
|
CA
|
463
|
371,072
|
|
|
|
JV-55%
|
|
|
Vista Belvedere
|
15 Red Hill Circle
|
Tiburon
|
CA
|
76
|
78,300
|
|
2004
|
1963
|
EPLP
|
50
|
|
Fox Plaza
|
1390 Market Street
|
San Francisco
|
CA
|
443
|
230,017
|
|
2013
|
1968
|
EPLP
|
45
|
|
|
|
|
3%
|
894
|
647,090
|
|
|
|
|
|
|
|
|
|
|
|
|
|
|
|
|
|
|
Other
|
|
|
|
|
|
|
|
|
|
|
|
Tuscana
|
315 Mt. Oso
|
Tracy
|
CA
|
30
|
29,088
|
|
2007
|
2007
|
EPLP
|
6
|
|
Harvest Park
|
2327 Summercreek Drive
|
Santa Rosa
|
CA
|
104
|
116,628
|
|
2007
|
2004
|
EPLP
|
9
|
|
Chestnut Street Apartments
|
143 Chestnut Avenue
|
Santa Cruz
|
CA
|
96
|
87,640
|
|
2008
|
2002
|
EPLP
|
11
|
|
|
|
|
1%
|
230
|
233,356
|
|
|
|
|
|
|
|
|
|
|
|
|
|
|
|
|
|
|
Total Northern California
|
|
|
31%
|
10,496
|
9,027,468
|
|
|
|
|
28
|
|
|
|
|
|
|
|
|
|
|
|
|
|
SOUTHERN CALIFORNIA
|
||||||||||
|
Los Angeles County
|
|
|
|
|
|
|
|
|
|
|
|
Regency at Encino
|
15506 Moorpark Street
|
Encino
|
CA
|
75
|
78,487
|
|
2009
|
1989
|
EPLP
|
24
|
|
416 on Broadway
|
412 East Broadway
|
Glendale
|
CA
|
115
|
126,782
|
|
2010
|
2009
|
EPLP
|
4
|
|
Hampton Court
|
1136 N. Columbus Avenue
|
Glendale
|
CA
|
83
|
71,500
|
|
1999
|
1974
|
EPLP
|
39
|
|
Hampton Place
|
245 W. Loraine Street
|
Glendale
|
CA
|
132
|
141,500
|
|
1999
|
1970
|
EPLP
|
43
|
|
Marbrisa
|
1809 Termino Ave.
|
Long Beach
|
CA
|
202
|
122,800
|
|
2002
|
1987
|
EPLP
|
26
|
|
Pathways at Bixby Village
|
5945 E. Pacific Coast Hwy.
|
Long Beach
|
CA
|
296
|
197,700
|
|
1991
|
1975
|
EPLP
|
38
|
|
Bellerive
|
1921 Beloit Avenue
|
Los Angeles
|
CA
|
63
|
79,296
|
|
2011
|
2011
|
EPLP
|
2
|
|
Bunker Hill
|
222 and 234 S. Figueroa St.
|
Los Angeles
|
CA
|
456
|
346,600
|
|
1998
|
1968
|
EPLP
|
45
|
|
Cochran Apartments
|
612 South Cochran
|
Los Angeles
|
CA
|
58
|
51,400
|
|
1998
|
1989
|
EPLP
|
24
|
|
Gas Company Lofts
|
810 S. Flower Street
|
Los Angeles
|
CA
|
251
|
226,666
|
|
2013
|
2004
|
Wesco III
|
9
|
|
Kings Road
|
733 North Kings Road
|
Los Angeles
|
CA
|
196
|
132,100
|
|
1997
|
1979
|
EPLP
|
34
|
|
Marbella
|
600 South Detroit Street
|
Los Angeles
|
CA
|
60
|
50,108
|
|
2005
|
1991
|
EPLP
|
22
|
|
Belmont Station
|
1302 West 2nd St.
|
Los Angeles
|
CA
|
275
|
225,000
|
|
2009
|
2009
|
EPLP
|
4
|
|
Pacific Electric Lofts
|
610 South Main Street
|
Los Angeles
|
CA
|
314
|
277,980
|
|
2012
|
2006
|
Wesco I
|
7
|
|
Park Catalina
|
690 South Catalina Street
|
Los Angeles
|
CA
|
90
|
72,864
|
|
2012
|
2002
|
EPLP
|
11
|
|
Park Place
|
400 S. Detroit Street
|
Los Angeles
|
CA
|
60
|
48,000
|
|
1997
|
1988
|
EPLP
|
25
|
|
Windsor Court
|
401 S. Detroit Street
|
Los Angeles
|
CA
|
58
|
46,600
|
|
1997
|
1988
|
EPLP
|
25
|
|
Santee Court
|
716 S. Los Angeles Street
|
Los Angeles
|
CA
|
165
|
132,040
|
|
2010
|
2004
|
EPLP
|
9
|
|
Santee Village
|
743 South Santee Street
|
Los Angeles
|
CA
|
73
|
69,817
|
|
2011
|
2011
|
EPLP
|
2
|
|
Marina City Club
|
4333 Admiralty Way
|
Marina Del Rey
|
CA
|
101
|
127,200
|
|
2004
|
1971
|
EPLP
|
42
|
|
Mirabella
|
13701 Marina Point Drive
|
Marina Del Rey
|
CA
|
188
|
176,800
|
|
2000
|
2000
|
EPLP
|
13
|
|
Muse
|
5451 Vineland Avenue
|
North Hollywood
|
CA
|
152
|
135,292
|
|
2011
|
2011
|
EPLP
|
2
|
|
Monterra del Mar
|
280 E. Del Mar Boulevard
|
Pasadena
|
CA
|
123
|
74,400
|
|
1997
|
1972
|
EPLP
|
41
|
|
Monterra del Rey
|
350 Madison
|
Pasadena
|
CA
|
84
|
73,100
|
|
1999
|
1972
|
EPLP
|
41
|
|
Monterra del Sol
|
280 South Euclid
|
Pasadena
|
CA
|
85
|
69,200
|
|
1999
|
1972
|
EPLP
|
41
|
|
Fountain Park
|
13141 Fountain Park Drive
|
Playa Vista
|
CA
|
705
|
608,900
|
|
2004
|
2002
|
EPLP
|
11
|
2
ESSEX PROPERTY TRUST, INC. APARTMENT COMMUNITIES
Real Estate Information as of January 30, 2014
| Property Name |
Address
|
City
|
State
|
Units
|
Square
Footage |
Year
Acquired |
Year
Built |
Property
Ownership |
Age of
Property |
|
|
Highridge
|
28125 Peacock Ridge Drive
|
Rancho Palos Verde
|
CA
|
255
|
290,200
|
|
1997
|
1972
|
DownREIT
|
41
|
|
Coldwater Canyon
|
4250 Codlwater Canyon
|
Studio City
|
CA
|
39
|
34,125
|
|
2007
|
1979
|
EPLP
|
34
|
|
Allegro
|
11945 Magnolia Blvd.
|
Valley Village
|
CA
|
97
|
127,812
|
|
2010
|
2010
|
EPLP
|
3
|
|
The Avery
|
12005 Albers Street
|
Valley Village
|
CA
|
121
|
129,393
|
|
|
|
EPLP
|
|
|
Walnut Heights
|
20700 San Jose Hills Road
|
Walnut
|
CA
|
163
|
146,700
|
|
2003
|
1964
|
EPLP
|
49
|
|
The Huxley
|
1216-1234 North La Brea Avenue
|
West Hollywood
|
CA
|
187
|
154,776
|
|
|
|
JV - 50%
|
|
|
The Dylan
|
1111 North La Brea Avenue
|
West Hollywood
|
CA
|
184
|
150,678
|
|
|
|
JV - 50%
|
|
|
Avondale at Warner Center
|
22222 Victory Blvd.
|
Woodland Hills
|
CA
|
446
|
331,000
|
|
1999
|
1970
|
EPLP
|
43
|
|
Reveal
|
21201 Kittridge Street
|
Woodland Hills
|
CA
|
438
|
414,892
|
|
2011
|
2010
|
Wesco I
|
3
|
|
|
|
|
17%
|
5,898
|
5,106,861
|
|
|
|
|
|
|
Ventura County
|
|
|
|
|
|
|
|
|
|
|
|
Camarillo Oaks
|
921 Paseo Camarillo
|
Camarillo
|
CA
|
564
|
459,000
|
|
1996
|
1985
|
EPLP
|
28
|
|
Camino Ruiz Square
|
105 Camino Ruiz
|
Camarillo
|
CA
|
160
|
105,448
|
|
2006
|
1990
|
EPLP
|
23
|
|
Arbors at Parc Rose
|
1500 Tulipan Circle
|
Oxnard
|
CA
|
373
|
503,196
|
|
2011
|
2001
|
Wesco I
|
12
|
|
Mariner's Place
|
711 South B Street
|
Oxnard
|
CA
|
105
|
77,200
|
|
2000
|
1987
|
EPLP
|
26
|
|
Tierra Vista
|
1750 Montevina Circle
|
Oxnard
|
CA
|
404
|
387,100
|
|
2001
|
2001
|
EPLP
|
12
|
|
Monterey Villas
|
1040 Kelp Lane
|
Oxnard
|
CA
|
122
|
122,100
|
|
1997
|
1974
|
EPLP
|
39
|
|
Meadowood
|
1733 Cochran Street
|
Simi Valley
|
CA
|
320
|
264,500
|
|
1996
|
1986
|
EPLP
|
27
|
|
Hidden Valley
|
5065 Hidden Park Court
|
Simi Valley
|
CA
|
324
|
310,900
|
|
2004
|
2004
|
DownREIT
|
9
|
|
Lofts at Pinehurst,The
|
1021 Scandia Avenue
|
Ventura
|
CA
|
118
|
71,100
|
|
1997
|
1971
|
EPLP
|
42
|
|
Hillcrest Park
|
1800 West Hillcrest Drive
|
Newbury Park
|
CA
|
608
|
521,900
|
|
1998
|
1973
|
EPLP
|
40
|
|
Pinehurst
|
3980 Telegraph Road
|
Ventura
|
CA
|
28
|
21,200
|
|
2004
|
1973
|
EPLP
|
40
|
|
Woodside Village
|
675 Providence Ave.
|
Ventura
|
CA
|
145
|
136,500
|
|
2004
|
1987
|
EPLP
|
26
|
|
|
|
|
10%
|
3,271
|
2,980,144
|
|
|
|
|
|
|
|
|
|
|
|
|
|
|
|
|
|
|
Santa Barbara County
|
|
|
|
|
|
|
|
|
|
|
|
The Sweeps
|
775 Camino Del Sur Drive
|
Goleta
|
CA
|
91
|
|
|
2006
|
1967
|
EPLP
|
46
|
|
CBC
|
6721 El Colegio Drive
|
Goleta
|
CA
|
148
|
|
|
2006
|
1962
|
EPLP
|
51
|
|
Hope Ranch
|
3968-3974 & 3999 Via Lucero
|
Santa Barbara
|
CA
|
108
|
|
|
2007
|
1965/73
|
EPLP
|
48/40
|
|
|
|
|
1%
|
347
|
306,608
|
|
|
|
|
|
|
Orange County
|
|
|
|
|
|
|
|
|
|
|
|
Anavia
|
2045 South State College Blvd.
|
Anaheim
|
CA
|
250
|
312,343
|
|
2010
|
2009
|
EPLP
|
4
|
|
Barkley Apartments
|
2400 E. Lincoln Ave.
|
Anahiem
|
CA
|
161
|
139,800
|
|
2000
|
1984
|
DownREIT
|
29
|
|
Valley Park Apartments
|
17300 Euclid Ave.
|
Fountain Valley
|
CA
|
160
|
169,700
|
|
2001
|
1969
|
DownREIT
|
44
|
|
Capri at Sunny Hills
|
2341 Daphne Place
|
Fullerton
|
CA
|
100
|
128,100
|
|
2001
|
1961
|
DownREIT
|
52
|
|
Haver Hill
|
3100 East Yorba Linda Boulevard
|
Fullerton
|
CA
|
264
|
224,130
|
|
2012
|
1973
|
Wesco III
|
40
|
|
Wilshire Promenade
|
141 West Wilshire Avenue
|
Fullerton
|
CA
|
149
|
128,000
|
|
1997
|
1992
|
EPLP
|
21
|
|
Montejo Apartments
|
12911 Dale St.
|
Garden Grove
|
CA
|
124
|
103,200
|
|
2001
|
1974
|
DownREIT
|
39
|
|
Huntington Breakers
|
21270 Beach Boulevard
|
Huntington Beach
|
CA
|
342
|
241,700
|
|
1997
|
1984
|
EPLP
|
29
|
|
The Huntington
|
8400 Edinger Avenue
|
Huntington Beach
|
CA
|
276
|
202,256
|
|
2012
|
1975
|
EPLP
|
38
|
|
Axis 2300
|
2300 DuPont Drive
|
Irvine
|
CA
|
115
|
170,714
|
|
2010
|
2010
|
EPLP
|
3
|
|
Hillsborough Park
|
1501 South Beach Boulevard
|
La Habra
|
CA
|
235
|
215,500
|
|
1999
|
1999
|
EPLP
|
14
|
|
Trabuco Villas
|
25362 Mosswood Way
|
Lake Forest
|
CA
|
132
|
131,000
|
|
1997
|
1985
|
EPLP
|
28
|
|
Madrid Apartments
|
28401 Los Alisos Boulevard
|
Mission Viejo
|
CA
|
230
|
228,099
|
|
2012
|
2000
|
Wesco I
|
13
|
|
Fairway Apartments at Big Canyon
|
2 Pine Valley Lane
|
Newport Beach
|
CA
|
74
|
107,100
|
|
1999
|
1972
|
EPLP
|
41
|
|
Villa Angelina
|
201 E. Chapman Ave.
|
Placentia
|
CA
|
256
|
217,600
|
|
2001
|
1970
|
DownREIT
|
43
|
|
Fairhaven Apartments
|
1300 E. Fairhaven
|
Santa Ana
|
CA
|
164
|
135,700
|
|
2001
|
1970
|
DownREIT
|
43
|
|
Essex Skyline at MacArthur Place
|
9 & 15 MacArthur Place
|
Santa Ana
|
CA
|
349
|
512,791
|
|
2010
|
2008
|
EPLP
|
5
|
|
|
|
|
10%
|
3,381
|
3,367,733
|
|
|
|
|
|
|
San Diego County
|
|
|
|
|
|
|
|
|
|
|
|
Alpine Village
|
2055 Arnold Way
|
Alpine
|
CA
|
301
|
254,400
|
|
2002
|
1971
|
EPLP
|
42
|
|
Bonita Cedars
|
5155 Cedarwood Rd.
|
Bonita
|
CA
|
120
|
120,800
|
|
2002
|
1983
|
EPLP
|
30
|
|
Mesa Village
|
5265 Clairemont Mesa Blvd.
|
Clairemont
|
CA
|
133
|
43,600
|
|
2002
|
1963
|
EPLP
|
50
|
|
Mira Monte
|
10360 Maya Linda Rd.
|
Mira Mesa
|
CA
|
355
|
262,600
|
|
2002
|
1982
|
EPLP
|
31
|
3
ESSEX PROPERTY TRUST, INC. APARTMENT COMMUNITIES
Real Estate Information as of January 30, 2014
| Property Name |
Address
|
City
|
State
|
Units
|
Square
Footage |
Year
Acquired |
Year
Built |
Property
Ownership |
Age of
Property |
|
|
Country Villas
|
283 Douglas Drive
|
Oceanside
|
CA
|
180
|
179,700
|
|
2002
|
1976
|
EPLP
|
37
|
|
Mission Hills
|
218 Rancho Del Oro
|
Oceanside
|
CA
|
282
|
244,000
|
|
2005
|
1984
|
EPLP
|
29
|
|
Domain
|
8798 Spectrum Boulevard
|
San Diego
|
CA
|
379
|
345,044
|
|
2013
|
2013
|
EPLP
|
0
|
|
CentrePointe
|
6466 Friars Road
|
San Diego
|
CA
|
224
|
126,700
|
|
1997
|
1974
|
EPLP
|
39
|
|
Summit Park
|
8563 Lake Murray Blvd.
|
San Diego
|
CA
|
300
|
229,400
|
|
2002
|
1972
|
EPLP
|
41
|
|
Shadow Point
|
9830 Dale Ave.
|
Spring Valley
|
CA
|
172
|
131,200
|
|
2002
|
1983
|
EPLP
|
30
|
|
|
|
|
7%
|
2,446
|
1,937,444
|
|
|
|
|
|
|
Riverside County
|
|
|
|
|
|
|
|
|
|
|
|
Devonshire Apartments
|
2770 West Devonshire Ave.
|
Hemet
|
CA
|
276
|
207,200
|
|
2002
|
1988
|
EPLP
|
25
|
|
|
|
|
1%
|
276
|
207,200
|
|
|
|
|
|
|
|
|
|
|
|
|
|
|
|
|
|
|
Total Southern California
|
|
|
46%
|
15,619
|
13,905,990
|
|
|
|
|
27
|
|
|
|
|
|
|
|
|
|
|
|
|
|
SEATTLE METRO AREA
|
||||||||||
|
Cedar Terrace
|
3205 115th Ave. NE
|
Bellevue
|
WA
|
180
|
174,200
|
|
2005
|
1984
|
EPLP
|
29
|
|
Courtyard Off Main
|
136 102nd Avenue SE
|
Bellevue
|
WA
|
109
|
108,388
|
|
2010
|
2000
|
EPLP
|
13
|
|
Emerald Ridge
|
3010 118th Avenue SE
|
Bellevue
|
WA
|
180
|
144,000
|
|
1994
|
1987
|
EPLP
|
26
|
|
Foothill Commons
|
13800 NE 9th Place
|
Bellevue
|
WA
|
388
|
288,300
|
|
1990
|
1978
|
EPLP
|
35
|
|
Palisades, The
|
13808 NE 12th
|
Bellevue
|
WA
|
192
|
159,700
|
|
1990
|
1977
|
EPLP
|
36
|
|
Sammamish View
|
16160 SE Eastgate Way
|
Bellevue
|
WA
|
153
|
133,500
|
|
1994
|
1986
|
EPLP
|
27
|
|
Woodland Commons
|
13700 NE 10th Place
|
Bellevue
|
WA
|
302
|
217,878
|
|
1990
|
1978
|
EPLP
|
35
|
|
Canyon Pointe
|
1630 228th St. SE
|
Bothell
|
WA
|
250
|
210,400
|
|
2003
|
1990
|
EPLP
|
23
|
|
Inglenook Court
|
14220 Juanita Drive, NE
|
Bothell
|
WA
|
224
|
183,600
|
|
1994
|
1985
|
EPLP
|
28
|
|
Salmon Run at Perry Creek
|
2109 228th Street SE
|
Bothell
|
WA
|
132
|
117,100
|
|
2000
|
2000
|
EPLP
|
13
|
|
Stonehedge Village
|
14690 143rd Blvd., NE
|
Bothell
|
WA
|
196
|
214,800
|
|
1997
|
1986
|
EPLP
|
27
|
|
Highlands at Wynhaven
|
1460 NE Hawthorne Street
|
Issaquah
|
WA
|
333
|
424,674
|
|
2008
|
2000
|
EPLP
|
13
|
|
Park Hill at Issaquah
|
22516 SE 56th Street
|
Issaquah
|
WA
|
245
|
277,700
|
|
1999
|
1999
|
EPLP
|
14
|
|
Wandering Creek
|
12910 SE 240th
|
Kent
|
WA
|
156
|
124,300
|
|
1995
|
1986
|
EPLP
|
27
|
|
Ascent
|
12062 Slater Avenue NE
|
Kirkland
|
WA
|
90
|
75,840
|
|
2012
|
1988
|
EPLP
|
25
|
|
Bridle Trails
|
6600 130th Avenue, NE
|
Kirkland
|
WA
|
108
|
99,700
|
|
1997
|
1986
|
EPLP
|
27
|
|
Evergreen Heights
|
12233 NE 131st Way
|
Kirkland
|
WA
|
200
|
188,300
|
|
1997
|
1990
|
EPLP
|
23
|
|
Corbella at Juanita Bay
|
9520 NE 120th Street
|
Kirkland
|
WA
|
169
|
103,339
|
|
2010
|
1978
|
EPLP
|
35
|
|
Montebello
|
12000 131st Lane NE
|
Kirkland
|
WA
|
248
|
272,734
|
|
2012
|
1996
|
EPLP
|
17
|
|
Slater 116
|
11415 Slater Avenue NE
|
Kirkland
|
WA
|
108
|
81,415
|
|
2013
|
2013
|
EPLP
|
0
|
|
Laurels at Mill Creek
|
1110 164th Street SE
|
Mill Creek
|
WA
|
164
|
134,300
|
|
1996
|
1981
|
EPLP
|
32
|
|
The Elliot at Mukilteo (fka Anchor Village)
|
9507 49th Avenue West
|
Mukilteo
|
WA
|
301
|
245,900
|
|
1997
|
1981
|
DownREIT
|
32
|
|
Castle Creek
|
7000 132nd Place, SE
|
Newcastle
|
WA
|
216
|
191,900
|
|
1998
|
1998
|
EPLP
|
15
|
|
Delano
|
7805, 7903 and 7935 170th Place NE
|
Redmond
|
WA
|
126
|
116,340
|
|
2011
|
2011/2005
|
EPLP
|
2/8
|
|
Elevation
|
17202-17325 NE 85th Place
|
Redmond
|
WA
|
157
|
138,916
|
|
2010
|
1986
|
EPLP
|
27
|
|
Vesta
|
18666 Redmond Way
|
Redmond
|
WA
|
440
|
381,675
|
|
2011
|
1998
|
Wesco I
|
15
|
|
Redmond Hill
|
6110 186th Place NE
|
Redmond
|
WA
|
442
|
350,275
|
|
2011
|
1985
|
Wesco I
|
28
|
|
Brighton Ridge
|
2307 NE 4th Street
|
Renton
|
WA
|
264
|
201,300
|
|
1996
|
1986
|
EPLP
|
27
|
|
Fairwood Pond
|
14700 SE Petrovitsky Rd.
|
Renton
|
WA
|
194
|
189,200
|
|
2004
|
1997
|
EPLP
|
16
|
|
Forest View
|
650 Duvall Ave. NE
|
Renton
|
WA
|
192
|
182,500
|
|
2003
|
1998
|
EPLP
|
15
|
|
Annaliese
|
118 6th Ave. N
|
Seattle
|
WA
|
56
|
48,216
|
|
2013
|
2009
|
EPLP
|
4
|
|
Fountain Court
|
2400 4th Street
|
Seattle
|
WA
|
320
|
207,000
|
|
2000
|
2000
|
EPLP
|
13
|
|
Joule
|
523 Broadway Avenue, East
|
Seattle
|
WA
|
295
|
191,109
|
|
2010
|
2010
|
JV - 99%
|
3
|
|
Domaine
|
2483 Birch Avenue N
|
Seattle
|
WA
|
92
|
79,421
|
|
2012
|
2009
|
EPLP
|
4
|
|
Expo
|
100 Republican
|
Seattle
|
WA
|
275
|
190,176
|
|
2012
|
2012
|
JV - 50%
|
1
|
|
The Bernard
|
115 Warren Avenue North
|
Seattle
|
WA
|
63
|
43,151
|
|
2011
|
2008
|
EPLP
|
5
|
|
The Cairns
|
420 Yale Avenue
|
Seattle
|
WA
|
100
|
70,806
|
|
2007
|
2006
|
EPLP
|
7
|
|
Wharfside Pointe
|
3811 14th Avenue West
|
Seattle
|
WA
|
142
|
119,200
|
|
1994
|
1990
|
EPLP
|
23
|
|
Vox Apartments
|
1527 15th Avenue
|
Seattle
|
WA
|
58
|
42,173
|
|
2013
|
2013
|
EPLP
|
0
|
|
Total Seattle Metro Area
|
|
|
23%
|
7,860
|
6,723,426
|
|
|
|
|
19
|
4
ESSEX PROPERTY TRUST, INC. APARTMENT COMMUNITIES
Real Estate Information as of January 30, 2014
| Property Name |
Address
|
City
|
State
|
Units
|
Square
Footage |
Year
Acquired |
Year
Built |
Property
Ownership |
Age of
Property |
|
|
163
|
Apartment Communities
|
100%
|
33,975
|
29,656,884
|
(1)
|
|
|
|
|
|
|
11
|
Apartment Communities Under Construction
|
|
2,501
|
2,182,195
|
(2)
|
|
|
|
|
|
|
|
|
|
|
|
|
|
|
|
|
|
|
Avg. square footage
|
873
|
|
|
Definitions for Property Ownership
|
||||||
|
Avg. units per property
|
208
|
|
EPLP
|
The Company has a 100% ownership in the community.
|
||||||
|
|
|
|
Fund II
|
The community is owned by Fund II. The Company has a 28.2% interest in Fund II which is accounted for using the equity method of accounting.
|
||||||
|
Avg. age of property
|
25
|
|
|
|||||||
|
|
|
|
Wesco I
|
The community is owned by Wesco I, LLC. The Company has a 50% interest in Wesco I, LLC, which is accounted for using the equity method of accounting.
|
||||||
|
(1) Includes 349,465 square feet of retail or commercial space
|
|
|
||||||||
|
(2) Includes 36,225 square feet of estimated retail or commercial space
|
|
Wesco III
|
The community is owned by Wesco III, LLC. The Company has a 50% interest in Wesco III, LLC, which is accounted for using the equity method of accounting.
|
|||||||
|
|
|
|
|
|||||||
|
|
|
|
DownREIT
|
The Company holds a 1% special limited partner interest in the partnerships which owns the community. In accordance with GAAP, the Company consolidates this community.
|
||||||
|
|
|
|
|
|||||||
|
|
|
|
JV - 99%
|
The Company has a 99% ownership in this development and is consolidated.
|
||||||
|
|
|
|
JV - 81.5%
|
The Company has a 81.5% ownership in this community and is consolidated.
|
||||||
|
|
|
|
JV-55%
|
The Company has a 55.0% ownership in this community and is not consolidated.
|
||||||
|
|
|
|
JV - 50%
|
The Company has a 50% ownership in this community and is not consolidated.
|
||||||
|
OTHER REAL ESTATE ASSETS
|
||||||||||
|
Office/Retail Buildings
|
|
|
|
|
|
|
|
|
|
|
|
Essex Corporate Headquarter Bldg.
|
925 / 935 E. Meadow Dr.
|
Palo Alto
|
CA
|
|
39,600
|
|
1997 / 2007
|
1988 / 1962
|
EPLP
|
|
|
Derian Office Building
|
17461 Derian Av.
|
Irvine
|
CA
|
|
110,000
|
|
2000
|
1983
|
EPLP
|
|
|
Hollywood
|
6230 Sunset Blvd.
|
Los Angeles
|
CA
|
|
35,000
|
|
2006
|
1938
|
EPLP
|
|
|
Santa Clara Retail
|
3700 El Camino Real
|
Santa Clara
|
CA
|
|
139,000
|
|
2011
|
1970
|
EPLP
|
|
|
|
|
|
|
|
323,600
|
|
|
|
|
|
5