Attached files
| file | filename |
|---|---|
| 8-K - 8-K - SunCoke Energy Partners, L.P. | d666380d8k.htm |
| EX-99.1 - EX-99.1 - SunCoke Energy Partners, L.P. | d666380dex991.htm |
| EX-99.3 - EX-99.3 - SunCoke Energy Partners, L.P. | d666380dex993.htm |
Exhibit 99.2
|
|

SunCoke Energy Partners, L.P.
Q4 2013 Earnings
Conference Call
January 30, 2014
|
|
Forward-Looking Statements
This slide presentation should be reviewed in conjunction with the Fourth Quarter 2013 earnings releases of SunCoke Energy Partners, L.P. (SXCP) and the conference call held on January 30, 2014 at 10:00 a.m. ET.
Some of the information included in this presentation constitutes “forward-looking statements” as defined in Section 27A of the Securities Act of 1933, as amended and Section 21E of the Securities Exchange Act of 1934, as amended. All statements in this presentation that express opinions, expectations, beliefs, plans, objectives, assumptions or projections with respect to anticipated future performance of SunCoke or the Partnership, in contrast with statements of historical facts, are forward-looking statements. Such forward-looking statements are based on management’s beliefs and assumptions and on information currently available. Forward-looking statements include information concerning possible or assumed future results of operations, business strategies, financing plans, competitive position, potential growth opportunities, potential operating performance improvements, the effects of competition and the effects of future legislation or regulations. Forward-looking statements include all statements that are not historical facts and may be identified by the use of forward-looking terminology such as the words “believe,” “expect,” “plan,” “intend,” “anticipate,” “estimate,” “predict,” “potential,” “continue,” “may,” “will,” “should” or the negative of these terms or similar expressions.
Although management believes that its plans, intentions and expectations reflected in or suggested by the forward-looking statements made in this presentation are reasonable, no assurance can be given that these plans, intentions or expectations will be achieved when anticipated or at all. Moreover, such statements are subject to a number of assumptions, risks and uncertainties. Many of these risks are beyond the control of SunCoke and the Partnership, and may cause actual results to differ materially from those implied or expressed by the forward-looking statements. Each of SunCoke and the Partnership has included in its filings with the Securities and Exchange Commission cautionary language identifying important factors (but not necessarily all the important factors) that could cause actual results to differ materially from those expressed in any forward-looking statement. For more information concerning these factors, see the Securities and Exchange Commission filings of SunCoke and the Partnership. All forward-looking statements included in this presentation are expressly qualified in their entirety by such cautionary statements. Although forward-looking statements are based on current beliefs and expectations, caution should be taken not to place undue reliance on any such forward-looking statements because such statements speak only as of the date hereof. SunCoke and the Partnership do not have any intention or obligation to update publicly any forward-looking statement (or its associated cautionary language) whether as a result of new information or future events or after the date of this presentation, except as required by applicable law.
This presentation includes certain non-GAAP financial measures intended to supplement, not substitute for, comparable GAAP measures. Reconciliations of non-GAAP financial measures to GAAP financial measures are provided in the Appendix at the end of the presentation. Investors are urged to consider carefully the comparable GAAP measures and the reconciliations to those measures provided in the Appendix.
|
|
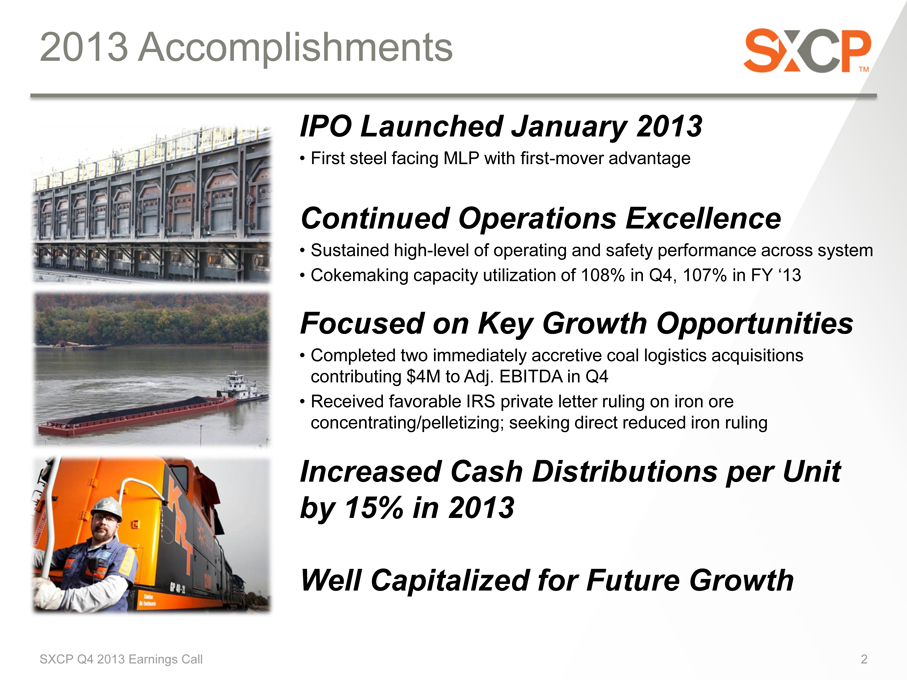
2013 Accomplishments
IPO Launched January 2013
First steel facing MLP with first-mover advantage
Continued Operations Excellence
Sustained high-level of operating and safety performance across system
Cokemaking capacity utilization of 108% in Q4, 107% in FY ‘13
Focused on Key Growth Opportunities
Completed two immediately accretive coal logistics acquisitions contributing $4M to Adj. EBITDA in Q4
Received favorable IRS private letter ruling on iron ore concentrating/pelletizing; seeking direct reduced iron ruling
Increased Cash Distributions per Unit by 15% in 2013
Well Capitalized for Future Growth
|
|
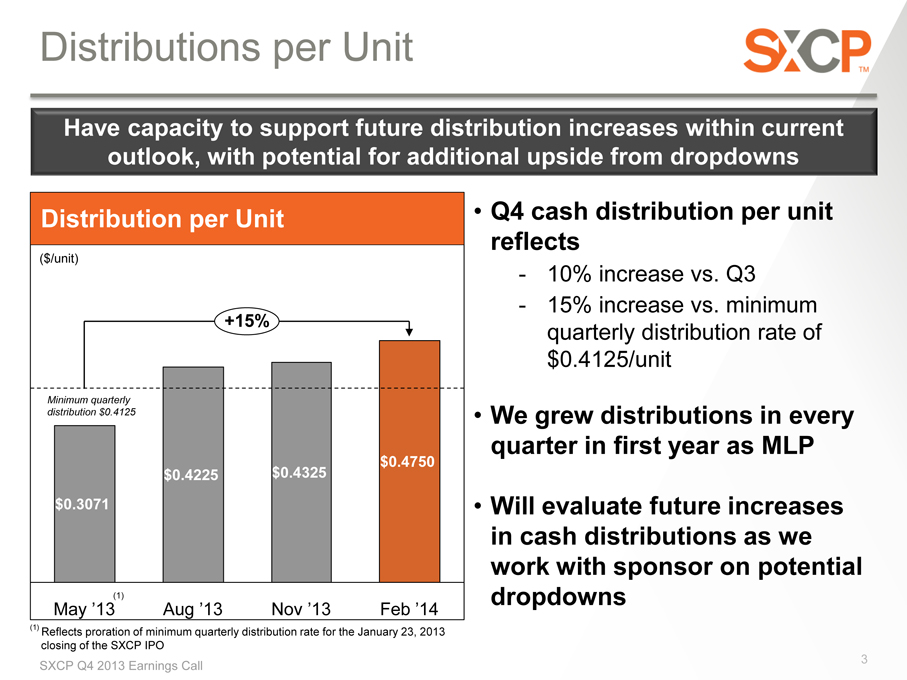
Distributions per Unit
Have capacity to support future distribution increases within current outlook, with potential for additional upside from dropdowns
Distribution per Unit Q4 cash distribution per unit reflects
($/unit)
- 10% increase vs. Q3
- 15% increase vs. minimum
+15%
quarterly distribution rate of $0.4125/unit
Minimum quarterly
distribution $0.4125 We grew distributions in every $0.4750 quarter in first year as MLP
$0.4225 $0.4325
$0.3071 • Will evaluate future increases in cash distributions as we work with sponsor on potential (1) dropdowns
May ’13 Aug ’13 Nov ’13 Feb ’14
(1) Reflects proration of minimum quarterly distribution rate for the January 23, 2013 closing of the SXCP IPO
3
SXCP Q4 2013 Earnings Call
|
|
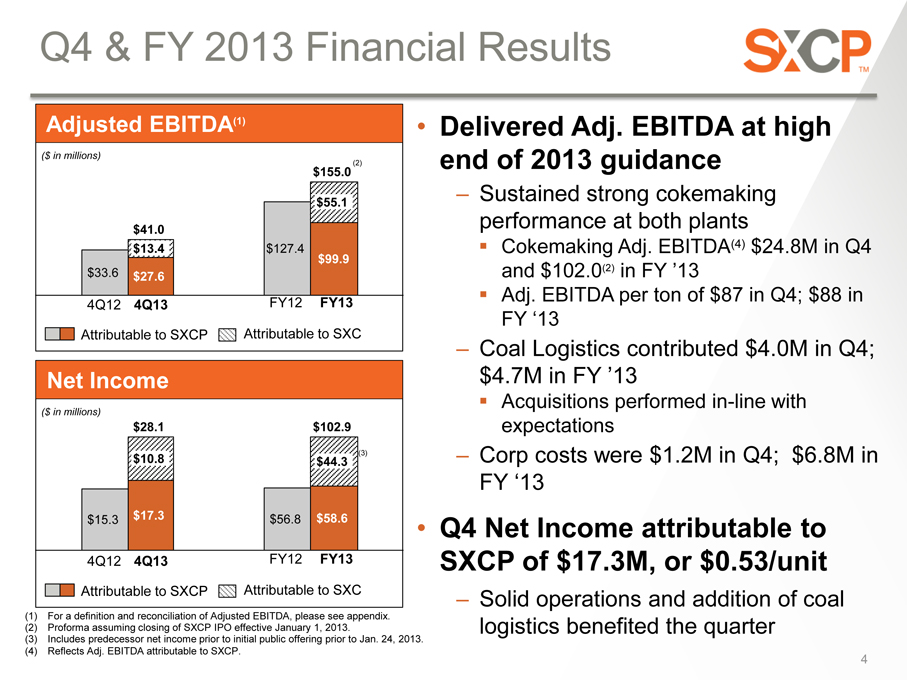
Q4 & FY 2013 Financial Results
Adjusted EBITDA(1) Delivered Adj. EBITDA at high ($ in millions) (2) end of 2013 guidance
$155.0
$55.1 – Sustained strong cokemaking
$41.0 performance at both plants
$13.4 $127.4 Cokemaking Adj. EBITDA(4) $24.8M in Q4
$99.9
$33.6 and $102.0(2) in FY ’13
$27.6
FY12 FY13 Adj. EBITDA per ton of $87 in Q4; $88 in
4Q12 4Q13
FY ‘13
Attributable to SXCP Attributable to SXC
– Coal Logistics contributed $4.0M in Q4;
Net Income $4.7M in FY ’13
Acquisitions performed in-line with
($ in millions)
$28.1 $102.9 expectations
$10.8 $44.3 (3) – Corp costs were $1.2M in Q4; $6.8M in
FY ‘13
$15.3 $17.3 $56.8 $58.6 • Q4 Net Income attributable to 4Q12 4Q13 FY12 FY13 SXCP of $17.3M, or $0.53/unit
Attributable to SXCP Attributable to SXC – Solid operations and addition of coal
(1) For a definition and reconciliation of Adjusted EBITDA, please see appendix.
(2) Proforma assuming closing of SXCP IPO effective January 1, 2013. logistics benefited the quarter (3) Includes predecessor net income prior to initial public offering prior to Jan. 24, 2013.
(4) Reflects Adj. EBITDA attributable to SXCP.
4
|
|
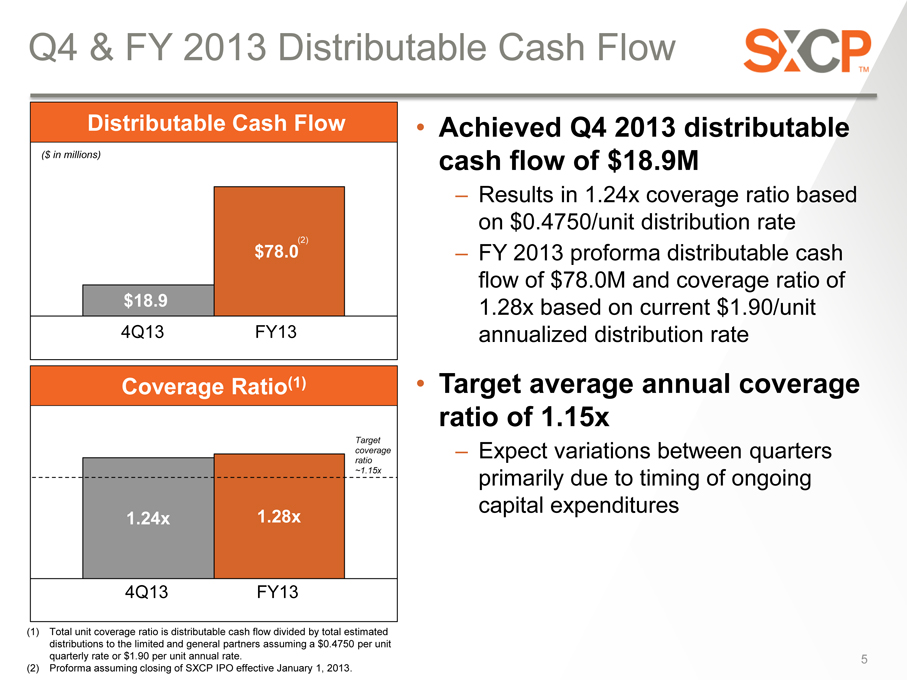
Q4 & FY 2013 Distributable Cash Flow
Distributable Cash Flow Achieved Q4 2013 distributable ($ in millions) cash flow of $18.9M
Results in 1.24x coverage ratio based on $0.4750/unit distribution rate
(2)
$78.0 FY 2013 proforma distributable cash flow of $78.0M and coverage ratio of $18.9 1.28x based on current $1.90/unit
4Q13 FY13 annualized distribution rate
Coverage Ratio(1) Target average annual coverage ratio of 1.15x
Target
coverage Expect variations between quarters
ratio
~1.15x primarily due to timing of ongoing capital expenditures
1.24x 1.28x
4Q13 FY13
(1) Total unit coverage ratio is distributable cash flow divided by total estimated distributions to the limited and general partners assuming a $0.4750 per unit quarterly rate or $1.90 per unit annual rate. 5 (2) Proforma assuming closing of SXCP IPO effective January 1, 2013.
|
|
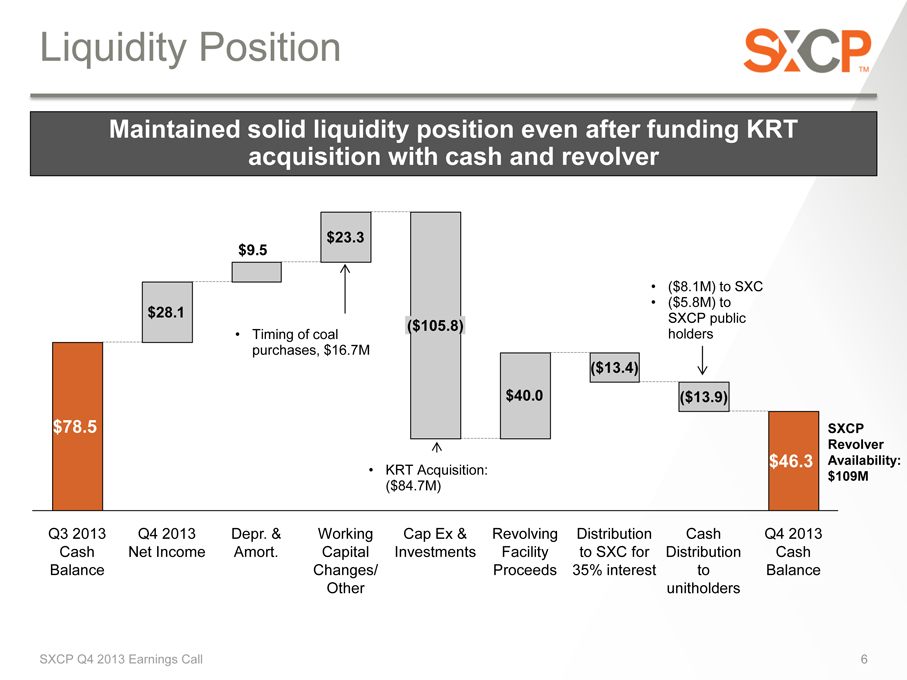
Liquidity Position
Maintained solid liquidity position even after funding KRT acquisition with cash and revolver
$9.5 $23.3
($8.1M) to SXC
($5.8M) to $28.1 ($105.8) SXCP public
Timing of coal holders purchases, $16.7M
($13.4) $40.0 ($13.9)
$78.5 SXCP
Revolver $46.3 Availability:
KRT Acquisition: $109M
($84.7M)
Q3 2013 Q4 2013 Depr. & Working Cap Ex & Revolving Distribution Cash Q4 2013 Cash Net Income Amort. Capital Investments Facility to SXC for Distribution Cash Balance Changes/ Proceeds 35% interest to Balance Other unitholders
SXCP Q4 2013 Earnings Call 6
|
|
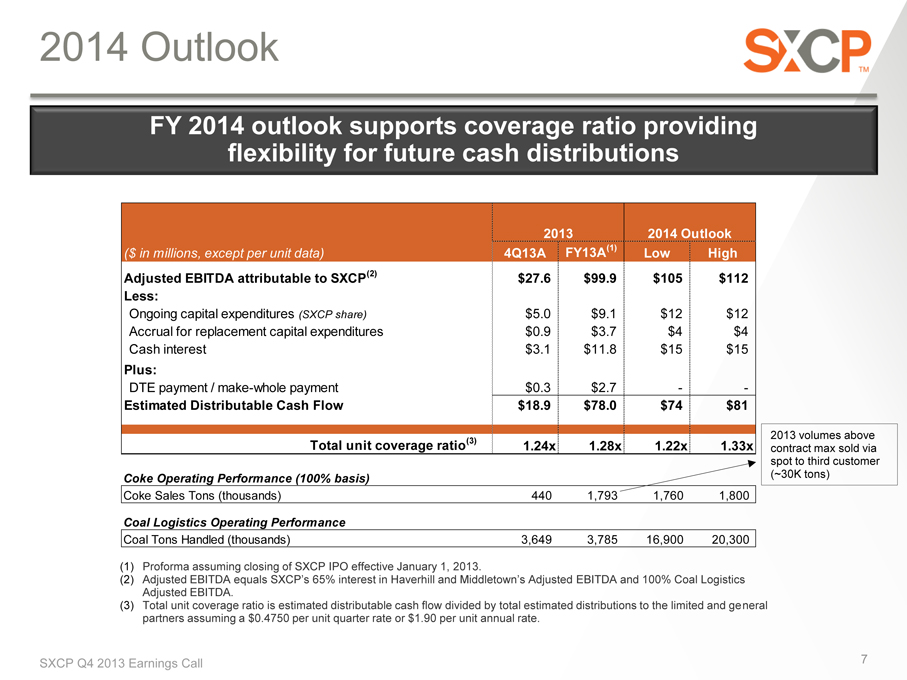
2014 Outlook
FY 2014 outlook supports coverage ratio providing flexibility for future cash distributions
2013 2014 Outlook
($ in millions, except per unit data) 4Q13A FY13A(1) Low High Adjusted EBITDA attributable to SXCP(2) $27.6 $99.9 $105 $112 Less:
Ongoing capital expenditures (SXCP share) $5.0 $9.1 $12 $12 Accrual for replacement capital expenditures $0.9 $3.7 $4 $4 Cash interest $3.1 $11.8 $15 $15
Plus:
DTE payment / make-whole payment $0.3 $2.7 - -
Estimated Distributable Cash Flow $18.9 $78.0 $74 $81
2013 volumes above
Total unit coverage ratio(3) 1.24x 1.28x 1.22x 1.33x contract max sold via spot to third customer
Coke Operating Performance (100% basis) (~30K tons)
Coke Sales Tons (thousands) 440 1,793 1,760 1,800
Coal Logistics Operating Performance
Coal Tons Handled (thousands) 3,649 3,785 16,900 20,300
(1) Proforma assuming closing of SXCP IPO effective January 1, 2013.
(2) Adjusted EBITDA equals SXCP’s 65% interest in Haverhill and Middletown’s Adjusted EBITDA and 100% Coal Logistics
Adjusted EBITDA.
(3) Total unit coverage ratio is estimated distributable cash flow divided by total estimated distributions to the limited and general partners assuming a $0.4750 per unit quarter rate or $1.90 per unit annual rate.
SXCP Q4 2013 Earnings Call 7
|
|
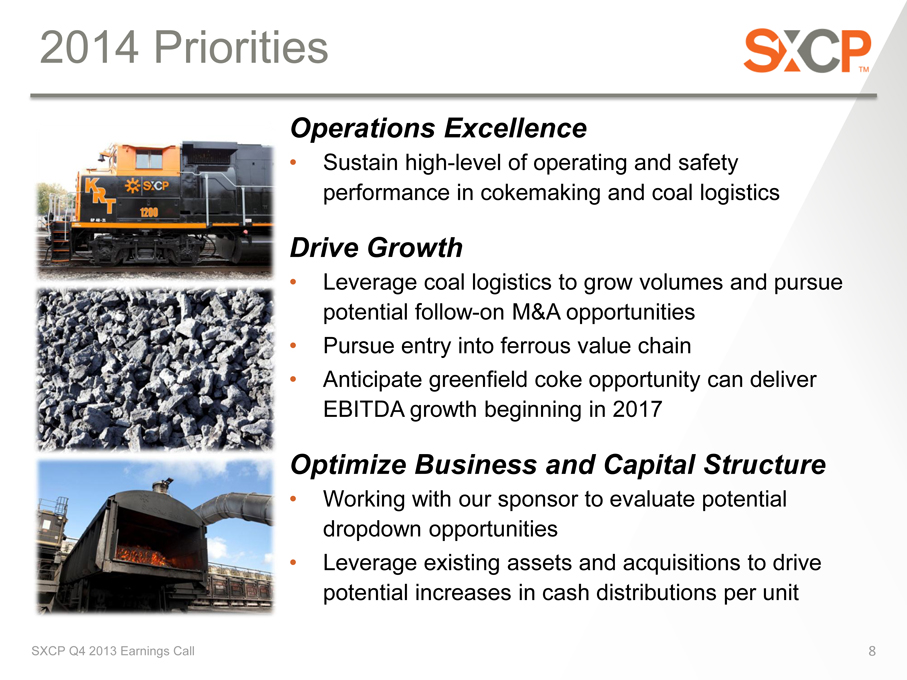
2014 Priorities
Operations Excellence
Sustain high-level of operating and safety performance in cokemaking and coal logistics
Drive Growth
Leverage coal logistics to grow volumes and pursue potential follow-on M&A opportunities
Pursue entry into ferrous value chain
Anticipate greenfield coke opportunity can deliver EBITDA growth beginning in 2017
Optimize Business and Capital Structure
Working with our sponsor to evaluate potential dropdown opportunities
Leverage existing assets and acquisitions to drive potential increases in cash distributions per unit
SXCP Q4 2013 Earnings Call 8
|
|

Investor Relations: 630-824-1987 www.sxcpartners.com
|
|
APPENDIX
10
|
|
Definitions
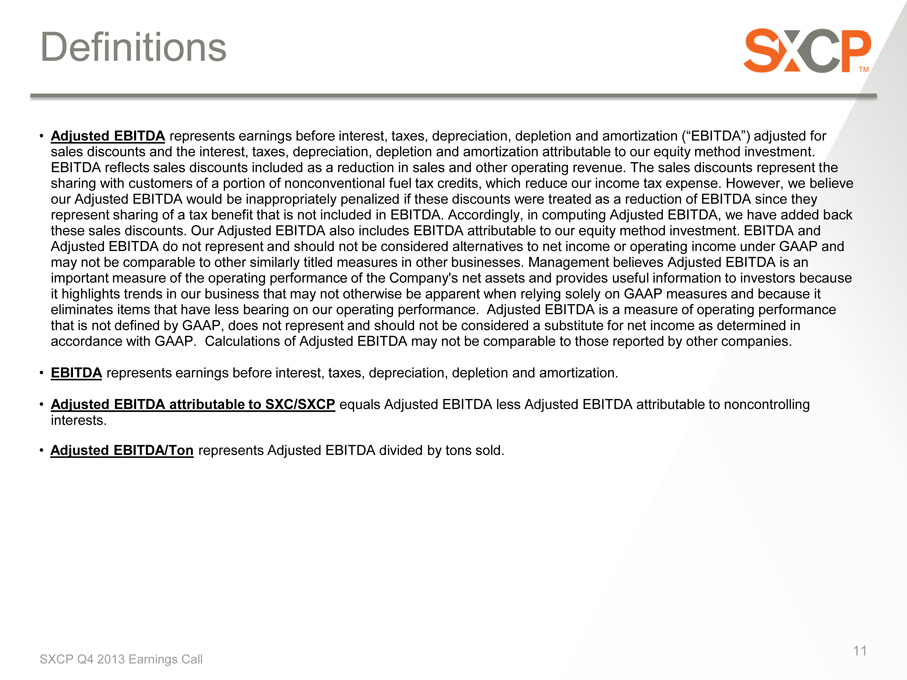
Adjusted EBITDA represents earnings before interest, taxes, depreciation, depletion and amortization (“EBITDA”) adjusted for sales discounts and the interest, taxes, depreciation, depletion and amortization attributable to our equity method investment. EBITDA reflects sales discounts included as a reduction in sales and other operating revenue. The sales discounts represent the sharing with customers of a portion of nonconventional fuel tax credits, which reduce our income tax expense. However, we believe our Adjusted EBITDA would be inappropriately penalized if these discounts were treated as a reduction of EBITDA since they represent sharing of a tax benefit that is not included in EBITDA. Accordingly, in computing Adjusted EBITDA, we have added back these sales discounts. Our Adjusted EBITDA also includes EBITDA attributable to our equity method investment. EBITDA and Adjusted EBITDA do not represent and should not be considered alternatives to net income or operating income under GAAP and may not be comparable to other similarly titled measures in other businesses. Management believes Adjusted EBITDA is an important measure of the operating performance of the Company’s net assets and provides useful information to investors because it highlights trends in our business that may not otherwise be apparent when relying solely on GAAP measures and because it eliminates items that have less bearing on our operating performance. Adjusted EBITDA is a measure of operating performance that is not defined by GAAP, does not represent and should not be considered a substitute for net income as determined in accordance with GAAP. Calculations of Adjusted EBITDA may not be comparable to those reported by other companies.
EBITDA represents earnings before interest, taxes, depreciation, depletion and amortization.
Adjusted EBITDA attributable to SXC/SXCP equals Adjusted EBITDA less Adjusted EBITDA attributable to noncontrolling interests.
Adjusted EBITDA/Ton represents Adjusted EBITDA divided by tons sold.
11
|
|
Definitions
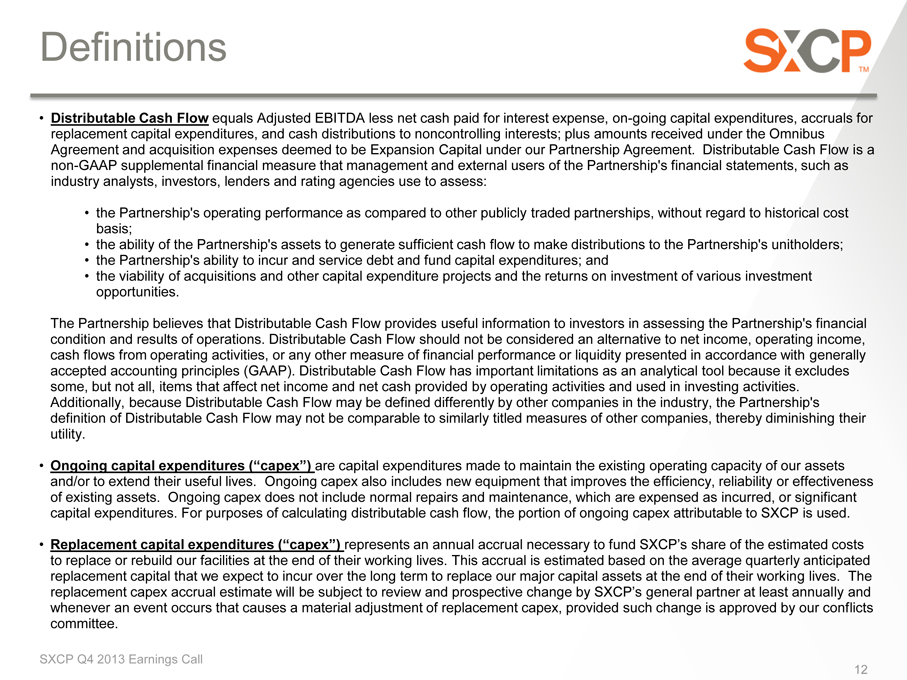
Distributable Cash Flow equals Adjusted EBITDA less net cash paid for interest expense, on-going capital expenditures, accruals for replacement capital expenditures, and cash distributions to noncontrolling interests; plus amounts received under the Omnibus Agreement and acquisition expenses deemed to be Expansion Capital under our Partnership Agreement. Distributable Cash Flow is a non-GAAP supplemental financial measure that management and external users of the Partnership’s financial statements, such as industry analysts, investors, lenders and rating agencies use to assess:
the Partnership’s operating performance as compared to other publicly traded partnerships, without regard to historical cost basis; the ability of the Partnership’s assets to generate sufficient cash flow to make distributions to the Partnership’s unitholders; the Partnership’s ability to incur and service debt and fund capital expenditures; and the viability of acquisitions and other capital expenditure projects and the returns on investment of various investment opportunities.
The Partnership believes that Distributable Cash Flow provides useful information to investors in assessing the Partnership’s financial condition and results of operations. Distributable Cash Flow should not be considered an alternative to net income, operating income, cash flows from operating activities, or any other measure of financial performance or liquidity presented in accordance with generally accepted accounting principles (GAAP). Distributable Cash Flow has important limitations as an analytical tool because it excludes some, but not all, items that affect net income and net cash provided by operating activities and used in investing activities.
Additionally, because Distributable Cash Flow may be defined differently by other companies in the industry, the Partnership’s definition of Distributable Cash Flow may not be comparable to similarly titled measures of other companies, thereby diminishing their utility.
Ongoing capital expenditures (“capex”) are capital expenditures made to maintain the existing operating capacity of our assets and/or to extend their useful lives. Ongoing capex also includes new equipment that improves the efficiency, reliability or effectiveness of existing assets. Ongoing capex does not include normal repairs and maintenance, which are expensed as incurred, or significant capital expenditures. For purposes of calculating distributable cash flow, the portion of ongoing capex attributable to SXCP is used.
Replacement capital expenditures (“capex”) represents an annual accrual necessary to fund SXCP’s share of the estimated costs to replace or rebuild our facilities at the end of their working lives. This accrual is estimated based on the average quarterly anticipated replacement capital that we expect to incur over the long term to replace our major capital assets at the end of their working lives. The replacement capex accrual estimate will be subject to review and prospective change by SXCP’s general partner at least annually and whenever an event occurs that causes a material adjustment of replacement capex, provided such change is approved by our conflicts committee.
SXCP Q4 2013 Earnings Call
12
|
|
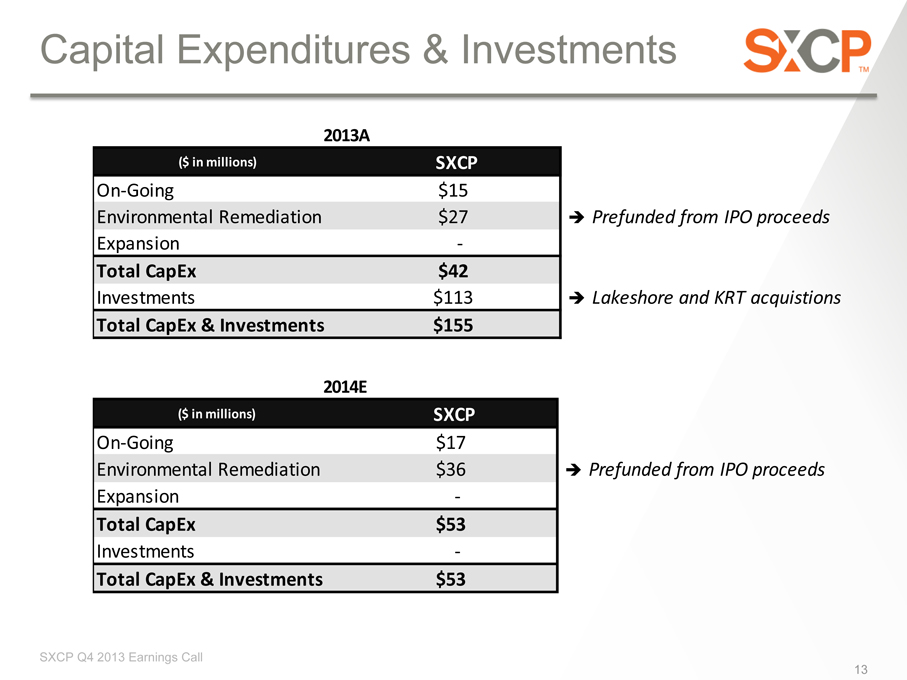
Capital Expenditures & Investments
2013A
($ in millions) SXCP
On-Going $15
Environmental Remediation $27 Prefunded from IPO proceeds Expansion —
Total CapEx $42
Investments $113 Lakeshore and KRT acquistions
Total CapEx & Investments $155
2014E
($ in millions) SXCP
On-Going $17
Environmental Remediation $36 Prefunded from IPO proceeds Expansion —
Total CapEx $53
Investments —
Total CapEx & Investments $53
SXCP Q4 2013 Earnings Call
13
|
|
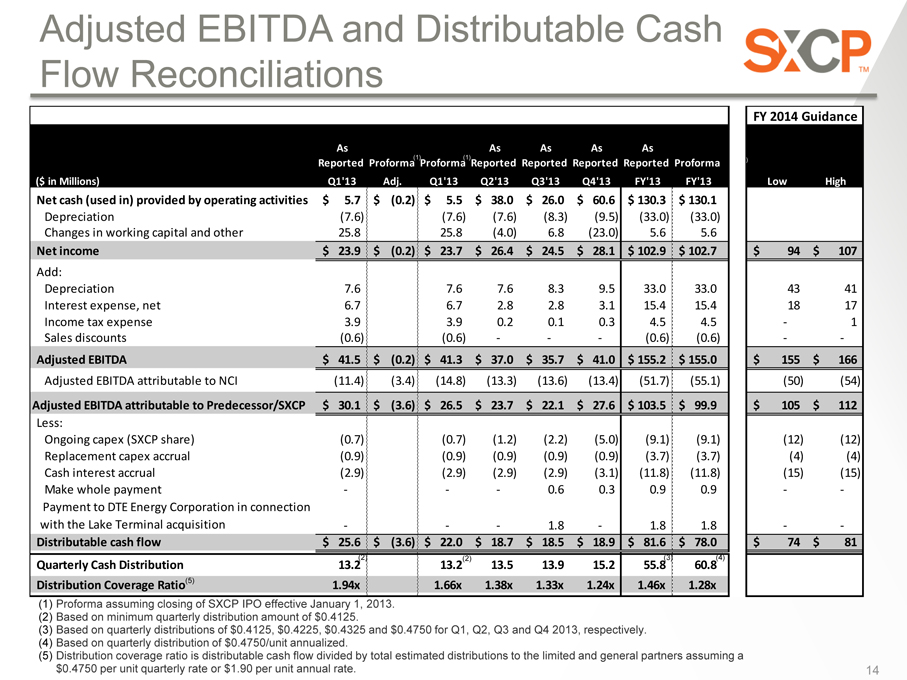
Adjusted EBITDA and Distributable Cash Flow Reconciliations
FY 2014 Guidance
As As As As As
(1) (1) (1)
Reported Proforma Proforma Reported Reported Reported Reported Proforma
($ in Millions) Q1’13 Adj. Q1’13 Q2’13 Q3’13 Q4’13 FY’13 FY’13 Low High
Net cash (used in) provided by operating activities $ 5.7 $ (0.2) $ 5.5 $ 38.0 $ 26.0 $ 60.6 $ 130.3 $ 130.1
Depreciation (7.6) (7.6) (7.6) (8.3) (9.5) (33.0) (33.0)
Changes in working capital and other 25.8 25.8 (4.0) 6.8 (23.0) 5.6 5.6
Net income $ 23.9 $ (0.2) $ 23.7 $ 26.4 $ 24.5 $ 28.1 $ 102.9 $ 102.7 $ 94 $ 107
Add:
Depreciation 7.6 7.6 7.6 8.3 9.5 33.0 33.0 43 41 Interest expense, net 6.7 6.7 2.8 2.8 3.1 15.4 15.4 18 17 Income tax expense 3.9 3.9 0.2 0.1 0.3 4.5 4.5 — 1 Sales discounts (0.6) (0.6) — — — (0.6) (0.6) — -
Adjusted EBITDA $ 41.5 $ (0.2) $ 41.3 $ 37.0 $ 35.7 $ 41.0 $ 155.2 $ 155.0 $ 155 $ 166
Adjusted EBITDA attributable to NCI (11.4) (3.4) (14.8) (13.3) (13.6) (13.4) (51.7) (55.1) (50) (54)
Adjusted EBITDA attributable to Predecessor/SXCP $ 30.1 $ (3.6) $ 26.5 $ 23.7 $ 22.1 $ 27.6 $ 103.5 $ 99.9 $ 105 $ 112
Less:
Ongoing capex (SXCP share) (0.7) (0.7) (1.2) (2.2) (5.0) (9.1) (9.1) (12) (12) Replacement capex accrual (0.9) (0.9) (0.9) (0.9) (0.9) (3.7) (3.7) (4) (4) Cash interest accrual (2.9) (2.9) (2.9) (2.9) (3.1) (11.8) (11.8) (15) (15) Make whole payment — — — 0.6 0.3 0.9 0.9 — -
Payment to DTE Energy Corporation in connection with the Lake Terminal acquisition — — — 1.8 — 1.8 1.8 — -
Distributable cash flow $ 25.6 $ (3.6) $ 22.0 $ 18.7 $ 18.5 $ 18.9 $ 81.6 $ 78.0 $ 74 $ 81
(2) (2) (3) (4)
Quarterly Cash Distribution 13.2 13.2 13.5 13.9 15.2 55.8 60.8 Distribution Coverage Ratio(5) 1.94x 1.66x 1.38x 1.33x 1.24x 1.46x 1.28x
(1) Proforma assuming closing of SXCP IPO effective January 1, 2013. (2) Based on minimum quarterly distribution amount of $0.4125.
(3) Based on quarterly distributions of $0.4125, $0.4225, $0.4325 and $0.4750 for Q1, Q2, Q3 and Q4 2013, respectively. (4) Based on quarterly distribution of $0.4750/unit annualized.
(5) Distribution coverage ratio is distributable cash flow divided by total estimated distributions to the limited and general partners assuming a $0.4750 per unit quarterly rate or $1.90 per unit annual rate. 14