Attached files
| file | filename |
|---|---|
| 8-K - 8-K - Rockwood Holdings, Inc. | a14-4557_18k.htm |
Exhibit 99.1
|
|
Investor Presentation – January 2014 |
|
|
Forward Looking Statements This presentation contains, and management may make, certain "forward-looking statements" within the meaning of the Private Securities Litigation Reform Act of 1995. All statements other than statements of historical facts may be forward-looking statements. Words such as "may,” “will,” “should,” “could,” “likely,” “anticipates," “intends,” "believes," "estimates," "expects," "forecasts," “plans,” “projects,” "predicts" and “outlook” and similar words and expressions are intended to identify forward-looking statements. Examples of our forward-looking statements include, among others, statements relating to our outlook, our future operating results on a segment basis, our dividend yield, the timing of the closing of this transaction, the impact on earnings per share, expected lithium reserves, the expected timing and closing of the announced divestitures and the proceeds from the announced divestitures, our future Adjusted EBITDA, Adjusted EBITDA margins and free cash flows, our share repurchase plans and our strategic initiatives. Although they reflect Rockwood’s current expectations, they involve a number of known and unknown risks, uncertainties and other factors that could cause actual results to differ materially from those expressed or implied, and not guarantees of future performance. These risks, uncertainties and other factors include, without limitation, Rockwood’s business strategy; changes in general economic conditions in North America and Europe and in other locations in which Rockwood currently does business; competitive pricing or product development activities affecting demand for Rockwood’s products; technological changes affecting production of Rockwood’s materials; fluctuations in interest rates, exchange rates and currency values; availability and pricing of raw materials; governmental and environmental regulations and changes in those regulations; fluctuations in energy prices; changes in the end-use markets in which Rockwood’s products are sold; hazards associated with chemicals manufacturing; Rockwood’s ability to access capital markets; Rockwood’s high level of indebtedness; risks associated with competition and the introduction of new competing products, especially from the Asia-Pacific region; risks associated with international sales and operations; risks associated with information securities and the risks, uncertainties and other factors discussed under "Risk Factors" and “Management’s Discussion and Analysis of Financial Condition and Results of Operations” in Rockwood's Form 10-K for the year ended December 31, 2012 and other periodic reports filed with or furnished to the Securities and Exchange Commission. Rockwood does not undertake any obligation to publicly update or revise any forward-looking statement, whether as a result of new information, future events or otherwise. |
|
|
Agenda Rockwood’s Lithium Business Lithium Market Overview Appendices |
|
|
Rockwood’s Lithium Business |
|
|
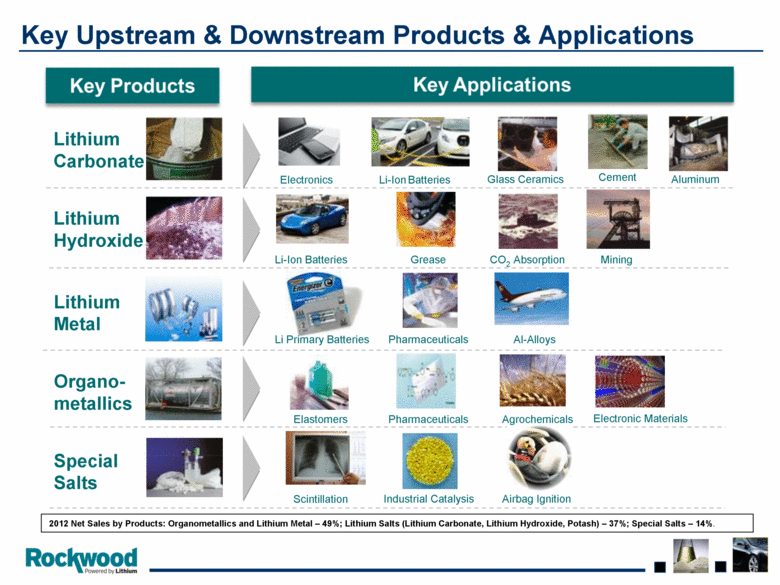
Organo- metallics Lithium Metal Special Salts Pharmaceuticals Pharmaceuticals Glass Ceramics Grease CO2 Absorption Elastomers Aluminum Li Primary Batteries Electronic Materials Cement Al-Alloys Mining Agrochemicals Li-Ion Batteries Li-Ion Batteries Scintillation Industrial Catalysis Airbag Ignition Key Upstream & Downstream Products & Applications Electronics Lithium Carbonate Lithium Hydroxide 2012 Net Sales by Products: Organometallics and Lithium Metal – 49%; Lithium Salts (Lithium Carbonate, Lithium Hydroxide, Potash) – 37%; Special Salts – 14%. |
|
|
Rockwood Lithium: #1 Global Integrated Producer of Lithium Compounds & Chemicals Secure access to significant and diverse long term lithium reserves Second largest brine producer globally with operations in U.S. and Chile Largest spodumene mine, with close of acquisition of 49% in Talison Lowest Cost Producer due to high quality brine Integrated Business Model from Resource to Downstream Specialty Products Industry leading process technology and high quality products Longest history in the business with experienced management |
|
|
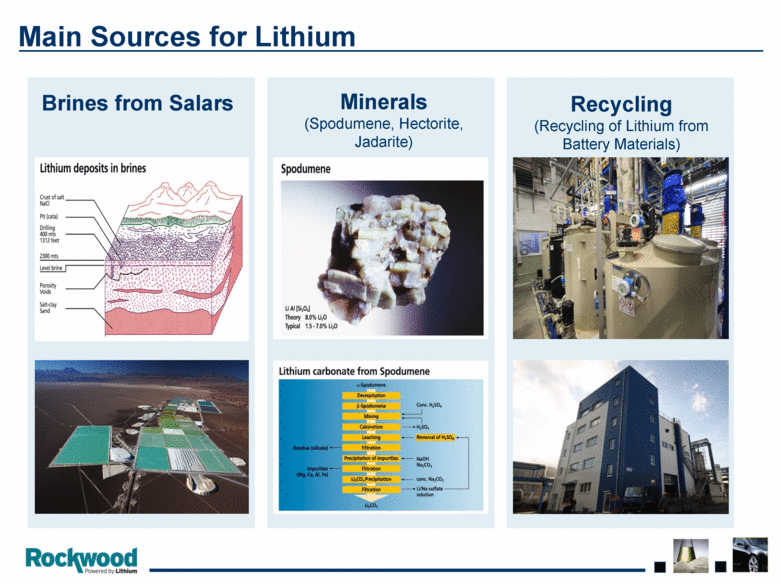
Recycling (Recycling of Lithium from Battery Materials) Brines from Salars Minerals (Spodumene, Hectorite, Jadarite) Main Sources for Lithium |
|
|
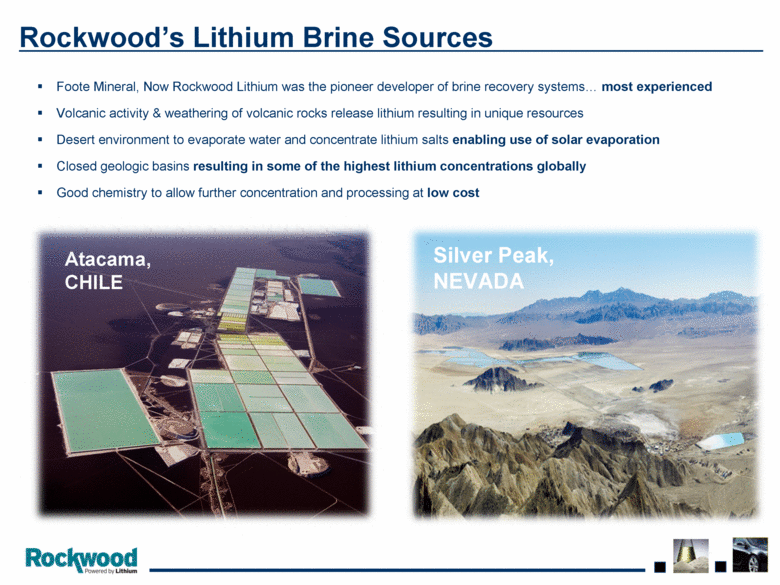
Atacama, CHILE Foote Mineral, Now Rockwood Lithium was the pioneer developer of brine recovery systems most experienced Volcanic activity & weathering of volcanic rocks release lithium resulting in unique resources Desert environment to evaporate water and concentrate lithium salts enabling use of solar evaporation Closed geologic basins resulting in some of the highest lithium concentrations globally Good chemistry to allow further concentration and processing at low cost Silver Peak, NEVADA Rockwood’s Lithium Brine Sources |
|
|
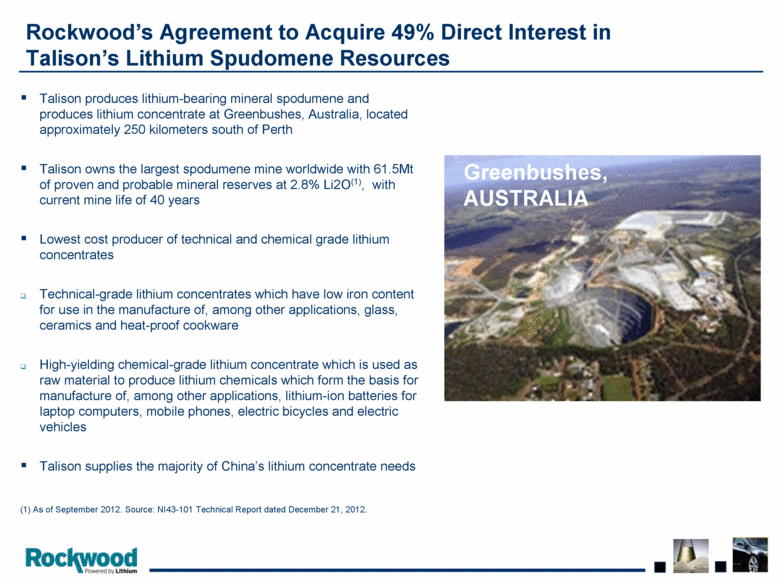
Talison produces lithium-bearing mineral spodumene and produces lithium concentrate at Greenbushes, Australia, located approximately 250 kilometers south of Perth Talison owns the largest spodumene mine worldwide with 61.5Mt of proven and probable mineral reserves at 2.8% Li2O(1), with current mine life of 40 years Lowest cost producer of technical and chemical grade lithium concentrates Technical-grade lithium concentrates which have low iron content for use in the manufacture of, among other applications, glass, ceramics and heat-proof cookware High-yielding chemical-grade lithium concentrate which is used as raw material to produce lithium chemicals which form the basis for manufacture of, among other applications, lithium-ion batteries for laptop computers, mobile phones, electric bicycles and electric vehicles Talison supplies the majority of China’s lithium concentrate needs (1) As of September 2012. Source: NI43-101 Technical Report dated December 21, 2012. Australia Rockwood’s Agreement to Acquire 49% Direct Interest in Talison’s Lithium Spudomene Resources Greenbushes,AUSTRALIA |
|
|
Largest market share of lithium-based sales A very broad portfolio of lithium compounds/materials Production capability worldwide Global Market Reach * Entered into acquisition agreement in December 2013; pending close of regulatory approvals. |
|
|
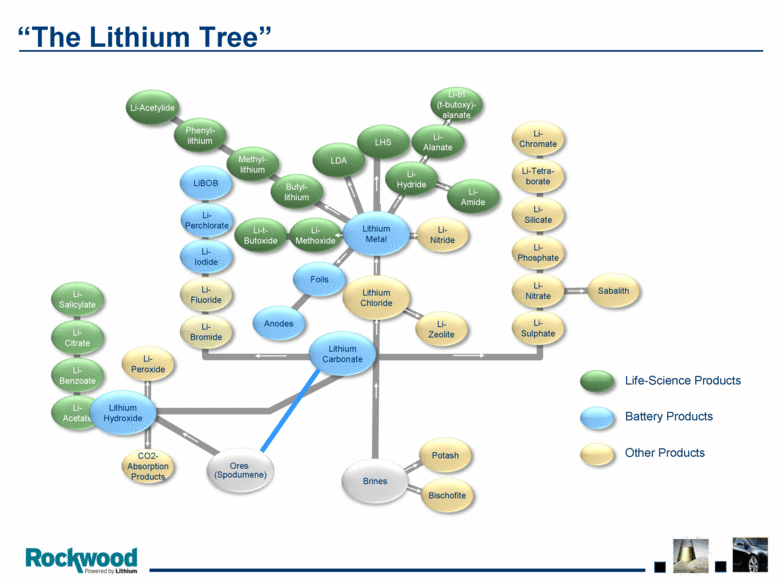
Li-Acetylide Methyl- lithium Phenyl- lithium LDA LHS Li-t- Butoxide Li- Methoxide Li- Hydride Li-tri (t-butoxy)- alanate Li- Amide Li- Salicylate Li- Citrate Li- Benzoate Li- Acetate Li- Zeolite Potash Bischofite Li- Sulphate Li- Nitrate Li- Phosphate Li- Silicate Li-Tetra- borate Li- Chromate Sabalith Li- Nitride Li- Bromide Li- Fluoride Li- Peroxide CO2- Absorption Products Li- Iodide Li- Perchlorate LiBOB Anodes Foils Lithium Chloride Brines Butyl- lithium Li- Alanate Lithium Metal Life-Science Products Battery Products Other Products Lithium Carbonate Lithium Hydroxide Ores (Spodumene) “The Lithium Tree” |
|
|
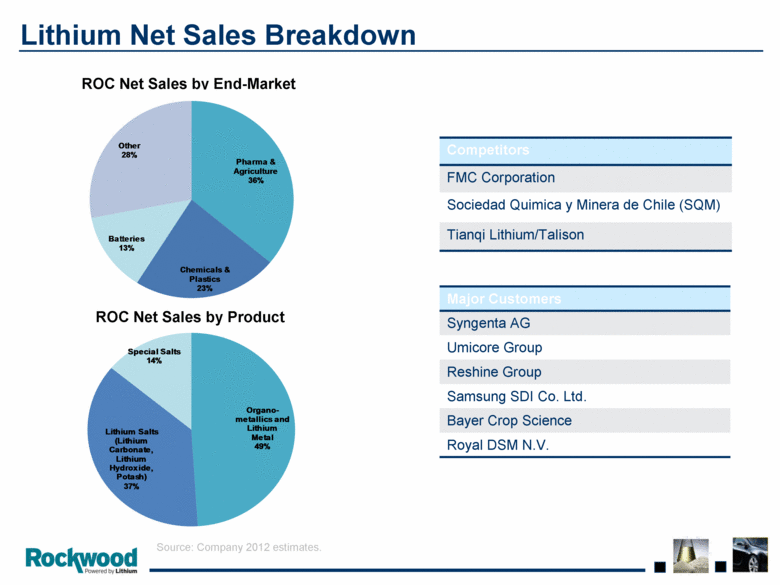
Lithium Net Sales Breakdown Source: Company 2012 estimates. Competitors FMC Corporation Sociedad Quimica y Minera de Chile (SQM) Tianqi Lithium/Talison Major Customers Syngenta AG Umicore Group Reshine Group Samsung SDI Co. Ltd. Bayer Crop Science Royal DSM N.V. ROC Net Sales by End-Market ROC Net Sales by Product Organo - metallics and Lithium Metal 49 % Lithium Salts (Lithium Carbonate, Lithium Hydroxide, Potash) 37 % Special Salts 14 % Pharma & Agriculture 36 % Chemicals & Plastics 23 % Batteries 13 % Other 28 % |
|
|
Lithium Market Overview |
|
|
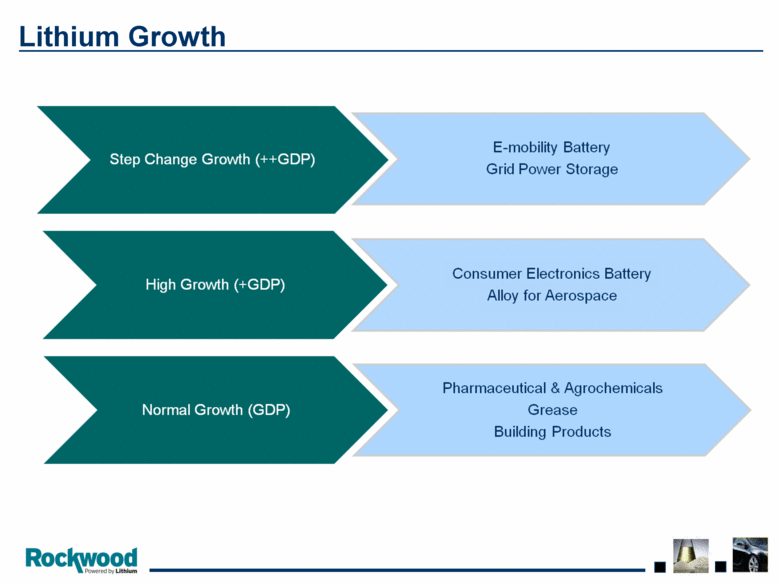
Lithium Growth |
|
|
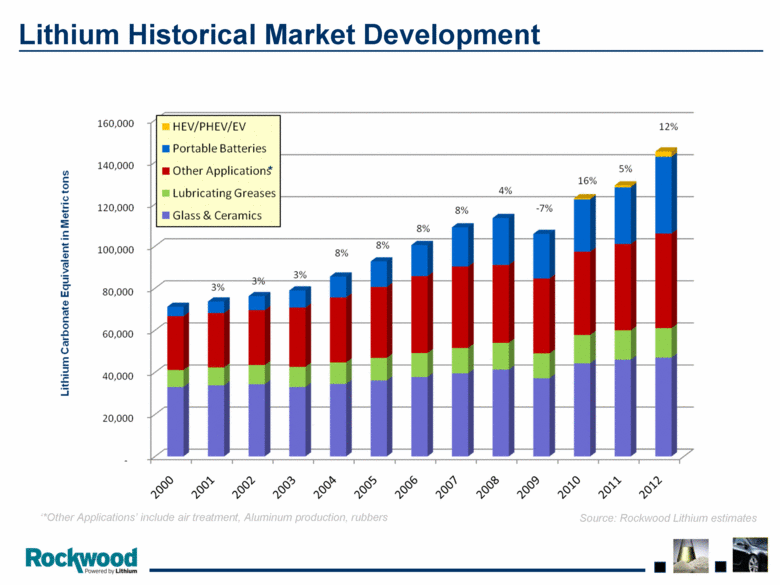
Lithium Historical Market Development Source: Rockwood Lithium estimates ‘*Other Applications’ include air treatment, Aluminum production, rubbers * |
|
|
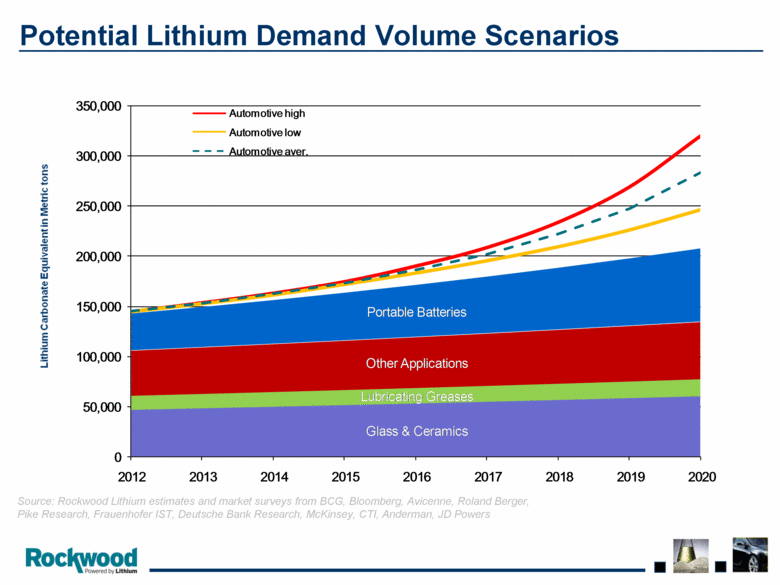
Potential Lithium Demand Volume Scenarios Source: Rockwood Lithium estimates and market surveys from BCG, Bloomberg, Avicenne, Roland Berger, Pike Research, Frauenhofer IST, Deutsche Bank Research, McKinsey, CTI, Anderman, JD Powers Glass & Ceramics Lubricating Greases Other Applications Portable Batteries 0 50,000 100,000 150,000 200,000 250,000 300,000 350,000 2012 2013 2014 2015 2016 2017 2018 2019 2020 Automotive high Automotive low Automotive aver. |
|
|
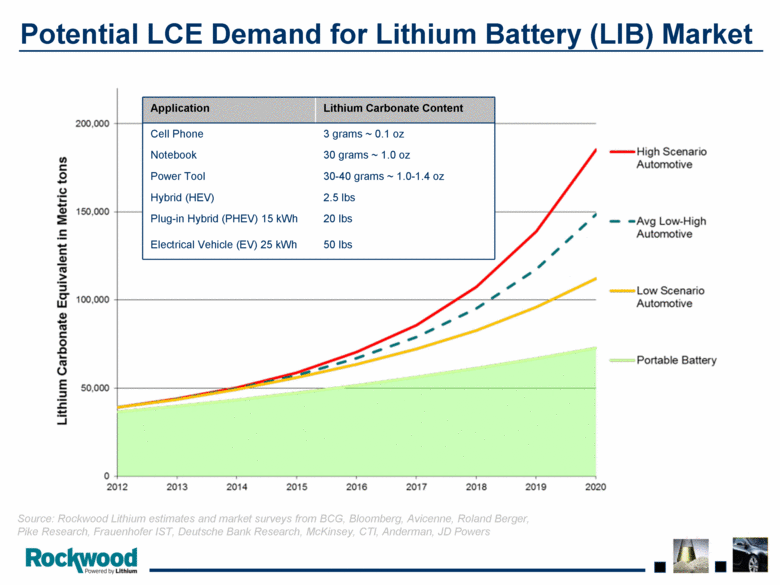
Potential LCE Demand for Lithium Battery (LIB) Market Source: Rockwood Lithium estimates and market surveys from BCG, Bloomberg, Avicenne, Roland Berger, Pike Research, Frauenhofer IST, Deutsche Bank Research, McKinsey, CTI, Anderman, JD Powers Application Lithium Carbonate Content Cell Phone 3 grams ~ 0.1 oz Notebook 30 grams ~ 1.0 oz Power Tool 30-40 grams ~ 1.0-1.4 oz Hybrid (HEV) 2.5 lbs Plug-in Hybrid (PHEV) 15 kWh 20 lbs Electrical Vehicle (EV) 25 kWh 50 lbs |
|
|
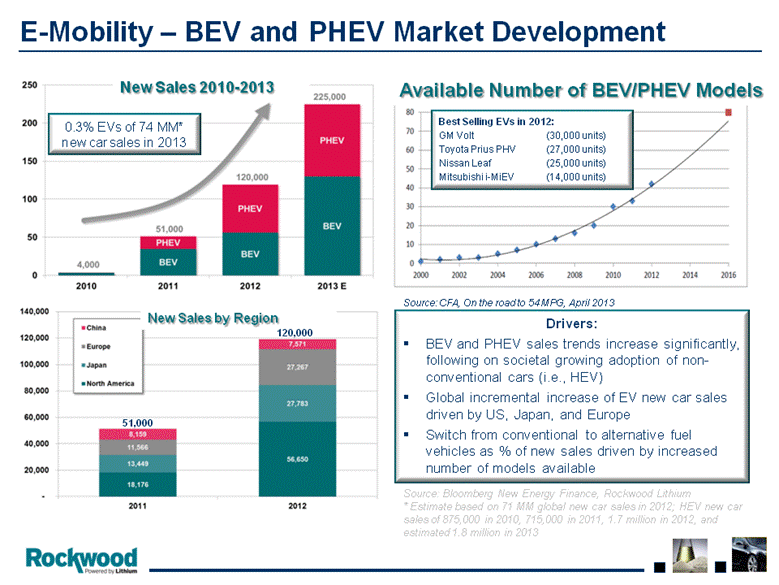
E-Mobility – BEV and PHEV Market Development Source: Bloomberg New Energy Finance, Rockwood Lithium * Estimate based on 71 MM global new car sales in 2012; HEV new car sales of 875,000 in 2010, 715,000 in 2011, 1.7 million in 2012, and estimated 1.8 million in 2013 Drivers: BEV and PHEV sales trends increase significantly, following on societal growing adoption of non-conventional cars (i.e., HEV) Global incremental increase of EV new car sales driven by US, Japan, and Europe Switch from conventional to alternative fuel vehicles as % of new sales driven by increased number of models available New Sales 2010-2013 Available Number of BEV/PHEV Models Source: CFA‚ On the road to 54 MPG, April 2013 New Sales by Region Best Selling EVs in 2012: GM Volt (30,000 units) Toyota Prius PHV (27,000 units) Nissan Leaf (25,000 units) Mitsubishi i-MiEV (14,000 units) 0.3% EVs of 74 MM* new car sales in 2013 51,000 120,000 |
|
|
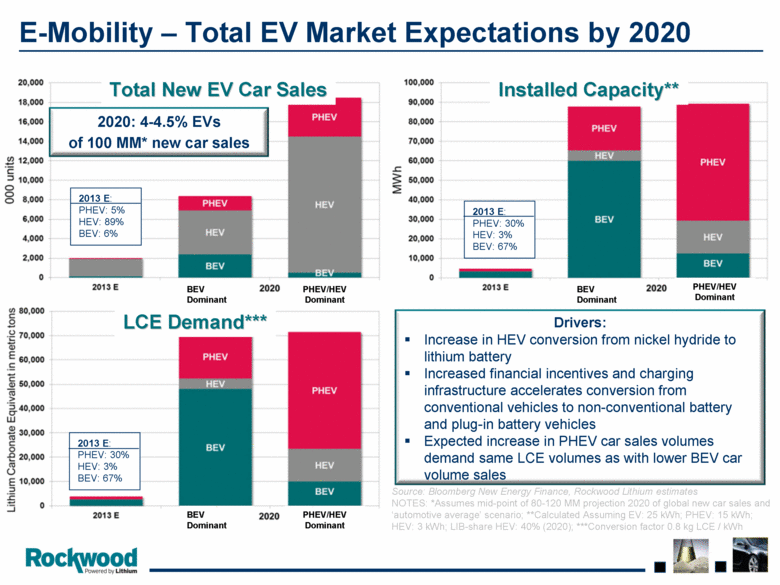
E-Mobility – Total EV Market Expectations by 2020 Source: Bloomberg New Energy Finance, Rockwood Lithium estimates NOTES: *Assumes mid-point of 80-120 MM projection 2020 of global new car sales and ‘automotive average’ scenario; **Calculated Assuming EV: 25 kWh; PHEV: 15 kWh; HEV: 3 kWh; LIB-share HEV: 40% (2020); ***Conversion factor 0.8 kg LCE / kWh Total New EV Car Sales Installed Capacity** LCE Demand*** Drivers: Increase in HEV conversion from nickel hydride to lithium battery Increased financial incentives and charging infrastructure accelerates conversion from conventional vehicles to non-conventional battery and plug-in battery vehicles Expected increase in PHEV car sales volumes demand same LCE volumes as with lower BEV car volume sales 2020: 4-4.5% EVs of 100 MM* new car sales 2013 E: PHEV: 5% HEV: 89% BEV: 6% 2013 E: PHEV: 30% HEV: 3% BEV: 67% 2013 E: PHEV: 30% HEV: 3% BEV: 67% BEV Dominant BEV Dominant BEV Dominant PHEV/HEV Dominant PHEV/HEV Dominant PHEV/HEV Dominant |
|
|
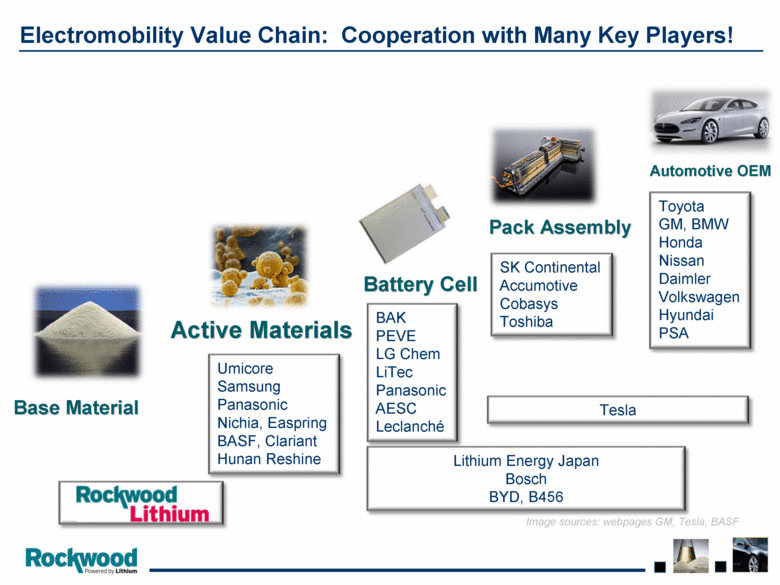
Electromobility Value Chain: Cooperation with Many Key Players! Base Material Active Materials Pack Assembly Automotive OEM Battery Cell Umicore Samsung Panasonic Nichia, Easpring BASF, Clariant Hunan Reshine Image sources: webpages GM, Tesla, BASF BAK PEVE LG Chem LiTec Panasonic AESC Leclanché Lithium Energy Japan Bosch BYD, B456 SK Continental Accumotive Cobasys Toshiba Toyota GM, BMW Honda Nissan Daimler Volkswagen Hyundai PSA Tesla |
|
|
Appendices |
|
|
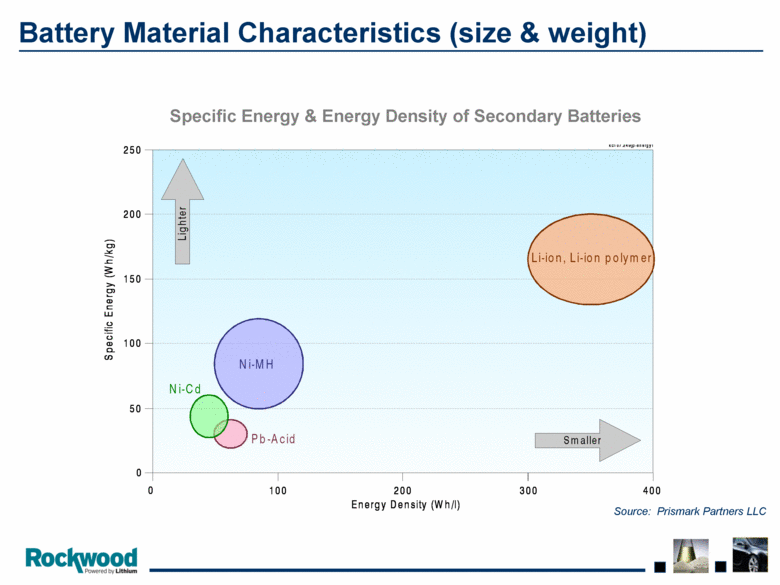
Specific Energy & Energy Density of Secondary Batteries Battery Material Characteristics (size & weight) Source: Prismark Partners LLC 100 0 0 50 100 150 200 250 200 300 400 Pb-Acid Ni-Cd Ni-MH Li-ion, Li-ion polymer Energy Density (Wh/l) Specific Energy (Wh/kg) kc107.249jp-energy1 Lighter Smaller SPECIFIC ENERGY AND ENERGY DENSITY OF SECONDARY BATTERIES |
|
|
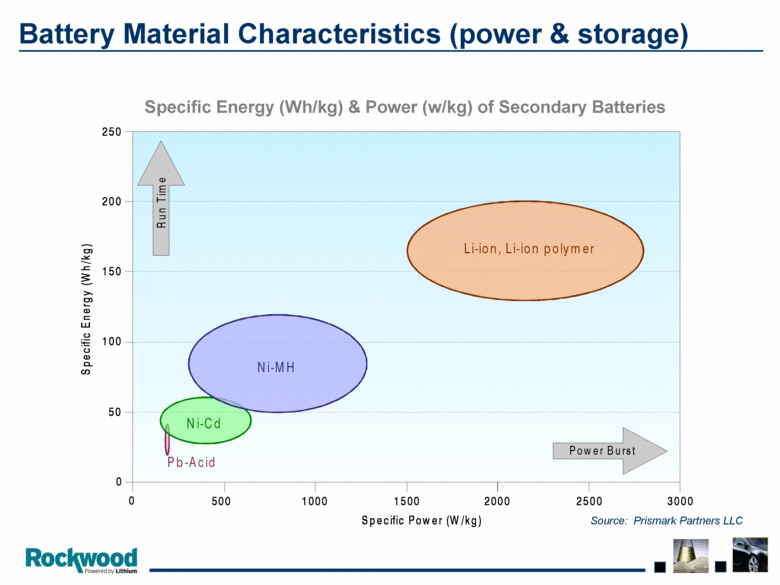
Specific Energy (Wh/kg) & Power (w/kg) of Secondary Batteries Battery Material Characteristics (power & storage) Source: Prismark Partners LLC 500 1000 1500 2000 2500 3000 0 0 50 100 150 200 250 Pb-Acid Ni-Cd Ni-MH Li-ion, Li-ion polymer Specific Power (W/kg) Specific Energy (Wh/kg) kc107.249jp-energy2 Run Time Power Burst POWER AND ENERGY OF SECONDARY BATTERIES |
|
|
[LOGO] |

