Attached files
| file | filename |
|---|---|
| 8-K - 8-K - STRATEGIC HOTELS & RESORTS, INC | d663246d8k.htm |
 Investor
Presentation January 2014
Exhibit 99.1 |
 I.
BEE’s Unique Value Proposition
II.
Industry Update & Operating Trends
III.
Financial Overview
BEE’s Unique Value Proposition
1 |
 o
Pure play high-end lodging REIT
o
High-end outperforms the industry in a recovery
o
Industry leading asset management expertise
o
Assets are in excellent condition
o
Embedded organic growth through revenue growth, margin expansion, and
ROI opportunities
o
Historically low supply growth environment, particularly in BEE markets
o
Replacement cost, excluding land, estimated at over $750,000 per
key
o
Solid balance sheet positioned for growth
The best investment proposition in the lodging space
2
BEE’s Unique Value Proposition |
 BEE has
outperformed its peers in 1-Year, 3-Year and 5-Year Total Shareholder Return
3
BEE’s Consistent Outperformance
587.9%
232.7%
BEE
Peers
(1)
SNL Hotel
REITs
RMS
1-yr
41.6%
18.9%
16.2%
2.5%
3-yr
84.1%
11.8%
13.2%
36.1%
5-yr
587.9%
232.7%
220.0%
172.8%
Source: SNL Financial as of 1/22/14
(1)
Includes DRH, LHO, PEB, SHO and HST
(1)
172.8%
220.0%
0
100
200
300
400
500
600
700
800
2009
2010
2011
2012
2013
2014
BEE
Peers
SNL Hotel REITs
RMS |
 BEE’s
Strategic Path to Creating Shareholder Value 4
Owning a high-end unique & irreplaceable portfolio
Operating an industry leading asset management platform
Conservatively managing the balance sheet
Allocating capital in a disciplined manner |
 o
Best portfolio in public markets
o
Locations in high-barrier-to-entry markets
o
City-center and resort destinations
o
World-class amenities
o
Historically low supply growth
Westin St. Francis
Ritz-Carlton Laguna Niguel
InterContinental Chicago
BEE’s Unique Value Proposition
5
Four Seasons Jackson Hole
Owning a high-end unique & irreplaceable portfolio |
 Top-Tier
Market Exposure Hotels in gateway urban cities and top tier resort locations
Hamburg, Germany
Chicago
Lincolnshire Resort
Punta Mita Resort
Chicago
Miami
Santa Monica Beach Hotel
Half Moon
Bay
La Jolla
St. Francis
Laguna Niguel
London, England
Scottsdale
Jackson Hole
Silicon Valley
6
New York
Properties
%
Rooms
%
2012
Property
EBITDA
(1)
%
Urban
10
56%
5,180
63%
$118.4
59%
Resorts
8
44%
3,091
37%
$81.9
41%
Total
18
8,271
$200.3
(1)
$ in millions and represents pro rata share
Washington, D.C. |
 o
Highest EBITDA per room in competitive set
o
Market share penetration exceeds peak
o
Unique F&B offerings with strong ROI results
o
Maintaining fixed cost reductions in recovery
o
Strong relationships with and rigorous oversight of brand managers
EBITDA Per Available Room
BEE’s Unique Value Proposition
Note: All metrics represent full-year 2012 results.
BEE
portfolio
reflects
Total
North
American
excl.
JW
Marriott
Essex
House
portfolio
as
of 12/31/2012.
Source: Public filings
Source: Smith Travel Research
BEE
portfolio
reflects
Total
United
States
portfolio
excl.
JW
Marriott
Essex
House
7
$81
$74
$71
$57
$53
$52
$0
$20
$40
$60
$80
$100
BEE
LHO
PEB
SHO
HST
DRH
Annual RevPAR Index
Operating an industry leading asset management platform
112.0
110.8
109.4
112.1
113.7
113.6
114.6
100.0
104.0
108.0
112.0
116.0
2007
2008
2009
2010
2011
2012
TTM |
 ADR
RevPAR
EBITDA Per Available Room
Non –
Rooms Revenue Per Available Room
Note: All metrics represent full-year 2012 results
BEE portfolio reflects Total North American portfolio excl. JW Marriott Essex House
as of 12/31/2012 Source: Public filings
BEE delivers industry leading results
BEE Outperforms Competitors
8
$189
$174
$160
$142
$139
$134
$0
$50
$100
$150
$200
BEE
PEB
LHO
HST
SHO
DRH
$81
$74
$71
$57
$53
$52
$0
$20
$40
$60
$80
$100
BEE
LHO
PEB
SHO
HST
DRH
$171
$84
$79
$71
$59
$55
$0
$40
$80
$120
$160
$200
BEE
PEB
HST
LHO
SHO
DRH
$264
$214
$203
$191
$176
$175
$0
$60
$120
$180
$240
$300
BEE
PEB
LHO
HST
SHO
DRH |
 9
BEE Continues to Outperform Competitors
Source: Company filings
Note: Based on the average reported same-store RevPAR growth from each year,
however may not reflect a same-store comparison over entire 3-year
period BEE portfolio reflects Total North American portfolio excl. JW
Marriott Essex House Source: Company filings
As of 9/30/13
BEE portfolio reflects Total North American portfolio excl. JW Marriott Essex
House o
Growth outperformance as a result of high quality assets and industry leading asset
management platform
Average RevPAR Growth 2010-2012
2013
YTD
Same-store
RevPAR
Growth
1
7.5%
7.2%
6.1%
5.5%
5.1%
4.4%
0.0%
2.0%
4.0%
6.0%
8.0%
10.0%
BEE
PEB
HST
DRH
SHO
LHO
8.4%
6.9%
5.9%
5.5%
4.0%
2.6%
0.0%
2.0%
4.0%
6.0%
8.0%
10.0%
BEE
PEB
DRH
HST
SHO
LHO
(1) |
 o
Total RevPAR is key top-line performance metric
o
Focus on maximizing RevPAR, non-rooms revenue, and EBITDA per room
BEE Total Revenue Mix
Peers Total Revenue Mix
Note:
All
metrics
represent
the
full-year
2012.
BEE
portfolio
reflects
the
Total
North
American
portfolio
excl.
JW
Marriott
Essex
House
Peers include: DRH, HST, LHO, SHO
Source: Public filings
BEE revenue driven more heavily by non-rooms revenue
relative to peers, maximizing EBITDA per available room
BEE Revenue Mix Compared to Peers
10
66%
28%
6%
Food &
Beverage
Other
Rooms
53%
36%
11%
Rooms
Other
Food &
Beverage |
 (1) Portfolio includes Total North American portfolio excl. JW Marriott Essex House
for the full year 2012 Peers include: DRH, HST, LHO, PEB, &
SHO Source: Public filings
Industry Leading Operating Margins
11
BEE
(1)
Peers
Peer Margins at
BEE's Room /
F&B Mix
Revenue
Rooms
59%
71%
59%
Food & Beverage
41%
29%
41%
Total Rooms / F&B
100%
100%
100%
Departmental Profit Margin
Rooms
71%
74%
74%
Food & Beverage
30%
27%
27%
EBITDA
23%
26%
21%
~200 basis point outperformance
BEE’s margins significantly outperform when adjusted for
same revenue mix
|
 o
Reduced Net Debt / EBITDA to 6.3x from over 14.0x
o
Raised over $660 million in equity since 2010
o
Refinanced property mortgages with staggered maturities
o
Executed an $86 million preferred equity tender at a 15% discount
o
Eliminated of $11.9 million in annual loan principal amortization
o
Maintain focus on liquidity; two assets currently unencumbered
BEE’s Unique Value Proposition
12
September 30, 2013
Note: Assumes full extension periods for all loans. Line of credit balance excludes
letters of credit. (a)
EBITDA
Conservatively managing the balance sheet
Key Stats
(a)
Net Debt/EBITDA
6.3x
Net Debt+Pref /EBITDA
7.7x
Net Debt/TEV
38.8%
Avg. Maturity (yrs)
3.8
Unencumbered assets
2
Corporate liquidity (MM)
$200.0
Mix of Debt
Bank Debt
42.0%
Life Insurance Co.
27.7%
CMBS
30.3%
Undrawn
$137.0
$113.4
$130.0
$95.0
$194.5
$350.5
$172.9
$144.9
$0.0
$100.0
$200.0
$300.0
$400.0
$500.0
2013
2014
2015
2016
2017
2018
2019
2020
2021
Bank
Life Co.
CMBS
Corporate
$367.4
$445.5
$163.0
Outstanding
$66.5
reflects mid-point of 2013 guidance range. |
 13
BEE’s Executing Strategy
Raised over $660 million in equity:
o
$333 million follow-on public offering (May 2010)
o
$145 million Woodbridge transaction acquiring two Four
Seasons hotels plus PIPE (February 2011)
o
$70 million equity placement to GIC for share in
InterContinental Chicago (June 2011)
o
$115 million overnight equity offering (April 2012)
Asset sales:
o
Sold InterContinental Prague for 110.6
million (December
2010) o
Sold leasehold position at Marriott Paris
Champs-Elysees for approximately $60 million
(April 2011) o
Sold stake in BuyEfficient for $9 million (January 2011)
o
Sold LSAC for $10.5 million (October 2013)
o
Agreed to sell the Four Seasons Punta Mita and La Solana
land parcel for $200.0 million (December 2013)
Debt repayments:
o
Tendered and fully retired $180 million unsecured
convertible recourse notes (May 2010)
Hotel del Coronado complex restructuring (February 2011):
o
Negotiated new joint-venture with Blackstone and KSL
o
Closed new CMBS mortgage financing totaling $425
million
Fairmont Scottsdale Princess complex restructuring (June
2011):
o
Negotiated new joint venture structure with Walton
Street Capital
o
Negotiated amendment and extension to CMBS debt for
four years at below market terms
New line of credit (June 2011):
o
Reduced lenders in bank syndicate from 21 banks to
10 banks
o
Achieved three year term with one year extension
Debt refinancings:
o
Seven property loans refinanced totaling nearly $900 million
(2011)
o
Amended mortgage loans to eliminate principal amortization
(2013)
Preferred equity tender (December 2011):
o
Successfully tendered for approximately 22% of outstanding
preferred equity at a 15% discount to par plus
accrued preferred dividends
Reinstatement of preferred equity dividends (June 2012):
o
Paid 14 quarters of preferred equity dividends
Acquired the Essex House in New York City (September 2012):
o
Acquired a 51% interest in the property
o
Closed new mortgage financing totaling $190.0 million
Raymond “Rip” Gellein a member of the board of directors throughout
entire execution. Note: |
 Hotel del
Coronado JW Marriott Essex House
Fairmont Scottsdale Princess
BEE’s Unique Value Proposition
14
Allocating capital in a disciplined manner
o
Execution of complex and accretive restructurings
o
Hotel del Coronado and Fairmont Scottsdale Princess
o
Assessment and development of ROI projects
o
InterContinental Miami
o
Recent success in acquiring hotels through off-market transactions
o
Four Seasons Jackson Hole and Silicon Valley, JW Marriott Essex House
o
Maximized proceeds through well-timed asset sales
o
Marriott Champs Elysees and InterContinental Prague |
 o
InterContinental Miami –
Guestrooms renovation
o
InterContinental Chicago –
Michael Jordan’s Steak House
o
InterContinental Chicago
–
Guestrooms renovation
o
Loews Santa Monica
–
Exterior façade enhancement
o
Ritz-Carlton Laguna Niguel
–
Guestrooms enhancement
o
Four Seasons Washington, D.C. –
ENO wine room
Notable 2013
capital projects
Notable 2011
capital projects
InterContinental Chicago Guestroom
InterContinental Miami Guestroom
Portfolio Well-Positioned to Enhance Cash Flow Growth
15
o
Fairmont Scottsdale Princess –
Meeting space expansion
o
Hotel del Coronado –
Guestrooms enhancement
o
InterContinental Miami –
Public space revitalization and
restaurant re-concept
o
Four Seasons Jackson Hole –
Restaurant re-concept
Notable 2012
capital projects
Fairmont Scottsdale
Princess Ballroom |
 I.
BEE’s Unique Value Proposition
II.
Industry Update & Operating Trends
III.
Financial Overview
Industry Update & Operating Trends
16 |
 o
Lodging demand historically correlates with GDP (~80%)
o
Customer demographics for luxury / high-end very strong
o
Supply growth remains historically low and lack of active development pipeline
U.S. Luxury Supply & Demand Change (TTM)
Source: Smith Travel Research
Demand growth exceeds supply growth by 180 bps which should
result in significant ADR growth as recovery continues
Luxury Lodging Supply & Demand Dynamics
+ 1.8%
17
-6%
-4%
-2%
0%
2%
4%
6%
8%
10%
12%
Supply % Change
Demand % Change |
 Source: Smith Travel Research and PWC
Source: Smith Travel Research
Luxury
Outperformance:
4.4% CAGR
Luxury
Outperformance:
2.2% CAGR
Annual % Change in RevPAR
Trailing Twelve Month Occupancy
o
Luxury hotel RevPAR growth outperforms in a recovery
o
1992
–
2000:
9
consecutive
years
of
annual
luxury
RevPAR
growth
totaling
115%
or
8.9%
annually
o
2002
–
2007:
5
consecutive
years
of
annual
luxury
RevPAR
growth
totaling
48%
or
8.2%
annually
Luxury Hotels Outperform in a Recovery
18
Luxury
Outperformance:
2.3% CAGR
Luxury outperformed by 200-400 basis points in
previous recoveries
Luxury occupancy exceeds previous peaks
54.0%
56.0%
58.0%
60.0%
62.0%
64.0%
66.0%
68.0%
70.0%
72.0%
74.0%
76.0%
-20%
-15%
-10%
-5%
0%
5%
10%
15%
20%
Total U.S.
Luxury
o
Luxury occupancy exceeding recent cycle peaks |
 o
Group pace remains the most reliable forward looking indicator
Year-Over-Year
Group
Pace
Group
room
nights
10%
below
peak
(2)
(1)
Group Pace excludes the JW Marriott Essex House & Four Seasons Punta Mita
(2)
2014 production assumed to be 95% of 2013
Group room nights on the books for 2014 are up 5.7% compared to 2013;
ADR up 1.7% compared to 2013 rate
2014 Group Booking Outlook
19
(2)
(1)
0
200,000
400,000
600,000
800,000
1,000,000
2007
2008
2009
2010
2011
2012
2013
2014
Definite through December
Production in the year |
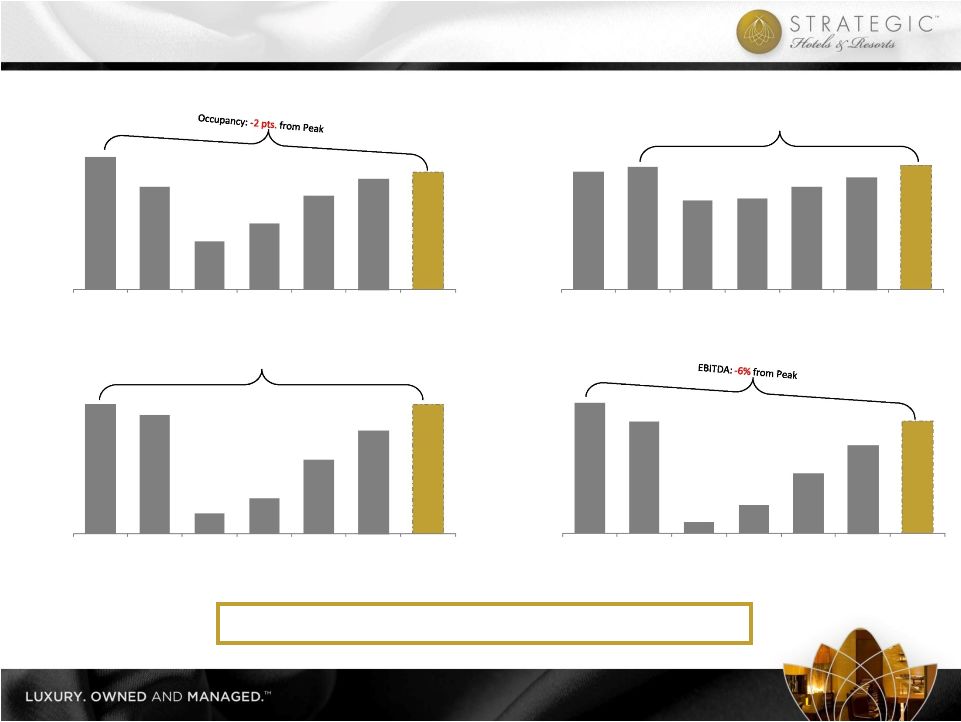 ADR:
+1%
from
Peak
RevPAR:
at
Peak
Occupancy
ADR
RevPAR
Property EBITDA (in millions)
Note: North America Same Store portfolio, excludes: Fairmont Scottsdale Princess, Hotel del
Coronado, and JW Marriott Essex House. 2013 forecast assumes midpoint of guidance
range. Operating performance improving; returning to peak
Embedded Portfolio Growth
20
60%
64%
68%
72%
76%
2007
2008
2009
2010
2011
2012
2013F
$140
$160
$180
$200
2007
2008
2009
2010
2011
2012
2013F
$100
$120
$140
$160
$180
$200
2007
2008
2009
2010
2011
2012
2013F
$120
$160
$200
$240
$280
2007
2008
2009
2010
2011
2012
2013F |
 I.
BEE’s Unique Value Proposition
II.
Industry Update & Operating Trends
III.
Financial Overview
Financial Overview
21 |
 3
Quarter 2013 Results (EBITDA in millions) 22
(1)
Excludes one-time items at the Hotel del Coronado and Fairmont Chicago
3Q 2012
3Q 2013
Operations
(Total North America Portfolio)
ADR
$278
7.4%
$299
RevPAR
$213
10.7%
$236
Total RevPAR
$371
9.0%
$405
EBITDA Margins
23.2%
240 bps
25.6%
Corporate Results
Comparable EBITDA
$46.6
29.1%
$60.1
Comparable FFO / share
$0.08
75.0%
$0.14
rd
(1) |
 YTD 2013
Results (EBITDA in millions) 23
Excludes one-time items at the Hotel del Coronado and Fairmont Chicago
(1)
Nine Months Ended
Nine Months Ended
September 30, 2012
September 30, 2013
Operations
(Total North America Portfolio)
ADR
$272
6.3%
$289
RevPAR
$199
8.8%
$217
Total RevPAR
$365
8.3%
$395
EBITDA Margins
22.0%
180 bps
23.7%
Corporate Results
Comparable EBITDA
$130.7
18.5%
$154.8
Comparable FFO / share
$0.21
38.1%
$0.29
(1) |
 (a)
Portfolio excludes Fairmont Scottsdale Princess, Hotel del Coronado, and JW Marriott
Essex House 2013 Guidance (EBITDA in millions)
24
2012 Actual
2013 Guidance
Operations
(Same Store N.A. Portfolio)
(a)
RevPAR
$186
7.5%-8%
$200-$201
Total RevPAR
$345
6.5%-7%
$367-$369
EBITDA Margins
22.0%
125 - 150bps
23.3%-23.5%
Corporate Results
Comparable EBITDA
$175
17%-23%
$205-$215
Comparable FFO / share
$0.26
35%-54%
$0.38-$0.43 |
 o
Pure play high-end lodging REIT
o
High-end outperforms the industry in a recovery
o
Industry leading asset management expertise
o
Assets are in excellent condition
o
Embedded organic growth through revenue growth, margin expansion, and
ROI opportunities
o
Historically low supply growth environment, particularly in BEE markets
o
Replacement cost, excluding land, estimated at over $750,000 per
key
o
Solid balance sheet positioned for growth
The best investment proposition in the lodging space
25
BEE’s Unique Value Proposition |
 26
BEE’s Leadership Team
Prior Experience
Management
Years with BEE
Former President of the Global Development Group for Starwood Hotels and
Resorts
Former
Director,
Chairman
and
CEO
of
Starwood
Vacation
Ownership
and
served as Chairman and Co-CEO of Vistana, a company he sold to
Starwood
Serves on the Board of Directors of Marriott Vacations Worldwide
5 years
Raymond L. “Rip”
Gellein
Jr.
Chairman & CEO
Diane Morefield
Executive VP & CFO
4 years
Former CFO of Equity International; 12 year tenure at Sam Zell related entities
including Equity Office
Serves on the Board and is Audit Committee Chair of Spirit Realty Capital
Senior officer with Barclays Bank real estate group
Richard Moreau
Executive VP & COO
16 years
Former Principal at Gremor Hospitality
Executive / officer positions at Hyatt Hotels, Inn America Corporation and Howard
Johnson Company
Stephen Briggs
Senior VP & CAO
6 years
Held various senior management positions at Equity Office Properties Trust
Member of Best Financial Practices Council of NAREIT
Paula Maggio
Executive VP, Secretary &
General Counsel
13 years
Former lawyer for Altheimer & Gray |
 27
BEE’s Highly Qualified & Independent Board of Directors
Experience
Chairman and CEO of Strategic Hotels & Resorts
Former President of the Global Development Group for Starwood Hotels and Resorts
Former
Director,
Chairman
and
CEO
of
Starwood
Vacation
Ownership
and
served
as
Chairman
and
Co-CEO
of Vistana
Serves on the Board of Directors of Marriott Vacations Worldwide
Directors
Raymond “Rip”
Gellein Jr.
Former Partner of Arthur Andersen, LLP
Served as member of Arthur Andersen’s hospitality industry team
Previously served as a Director of Gaylord Entertainment and Equity Inns
Robert Bowen
Kenneth Fisher
Senior
Partner
of
Fisher
Brothers
and
Chairman
and
CEO
of
Fisher
House
Foundation
Member of the Executive Committee of the City Investment Fund, LP and the Real Estate Board
of New York’s Board of Governors
Previously served on the Board of Directors of Realogy
James Jeffs
Managing Director and CIO of The Whittier Trust Company
Former Chairman and CEO of Chaparral Resources, CIO and Senior VP of Trust Services America
and President and CEO of TSA Capital Management
Sir David Michels
Former CEO of Hilton Group PLC and Hilton International
Previously a Non-Exec. Director of Hilton Hotels, the CEO of Stakis PLC and worked for
Grand Metropolitan Serves
as
Deputy
Chairman
and
Senior
Director
of
Marks
&
Spencer
and
is
a
member
of Jumeirah Hotels
Previously
served
as
Deputy
Chairman
and
Senior
Director
of
easy
Jet
PLC
Eugene Reilly
CEO of the Americas for Prologis, which merged with his former company, AMB Property
Corporation Former CIO of Cabot Properties
Member of the Urban Land Institute
William Prezant
Partner in the law firm of Prezant & Mollath
Serves on the Board of Directors of Forward Management and You Technologies
Previously served as Director of MacGregor Golf Company
Sheli Rosenberg
Lead Independent Director
Currently Of Counsel to Skadden, Arps, Slate, Meagher & Flom, LLP
Former President, CEO and Vice Chairman of Equity Group Investments
Previously a Principal of Rosenberg & Liebentritt PC and a Managing Partner of Schiff
Hardin, LLP Serves as Lead Director of Equity Lifestyle Properties and Director of
Nanosphere and Ventas Richard Kincaid
Independent
Years of Service
3 years
9 years
6 years
7 years
7 years
4 years
8 years
1 year
4 years
President and Founder of the BeCause Foundation
Former President, CEO and Director of Equity Office Properties Trust, where he also had
positions of Executive Vice President, COO and CFO
Serves on the Board of Directors of Rayonier and Vail Resorts
|
 Disclaimer
28
Except for historical information, the matters discussed in this presentation are
forward-looking statements subject to certain risks and uncertainties. Forward-looking statements relate to
expectations, beliefs, projections, future plans and strategies, anticipated events or
trends, and similar expressions concerning matters that are not historical facts. These forward-looking
statements are identified by their use of such terms and phrases such as
“anticipate,” “believe,” “could,” “estimate,” “expect,” “intend,” “may,” “plan,” “predict,” “project,” “should,” “will,”
“continue” and other similar terms and phrases, including references to
assumptions and forecasts of future results. Forward-looking statements are not guarantees of future
performance. Actual results could differ materially from the Company’s
projections. Factors that may contribute to these differences include, but are not limited to the
following: the effects of the recent global economic recession upon business and leisure travel and the
hotel markets in which the Company invests; the Company’s liquidity and refinancing
demands; the Company’s ability to obtain or refinance maturing debt; the Company’s ability to
maintain compliance with covenants contained in the Company’s debt facilities;
stagnation or further deterioration in economic and market conditions, particularly impacting business and
leisure travel spending in the markets where the Company’s hotels operate and in which
the Company invests, including luxury and upper upscale product; general volatility of the capital
markets and the market price of the Company’s shares of common stock; availability of
capital; the Company’s ability to dispose of properties in a manner consistent with its investment
strategy and liquidity needs; hostilities and security concerns, including future terrorist
attacks, or the apprehension of hostilities, in each case that affect travel within or to the United
States, Mexico, Germany, England or other countries where the Company invests; difficulties
in identifying properties to acquire and completing acquisitions; the Company’s failure to
maintain effective internal control over financial reporting and disclosure controls and
procedures; risks related to natural disasters; increases in interest rates and operating costs,
including insurance premiums and real property taxes; contagious disease outbreaks, such as
the H1N1 virus outbreak; delays and cost-overruns in construction and development;
marketing challenges associated with entering new lines of business or pursuing new business
strategies; the Company’s failure to maintain the Company’s status as a REIT; changes in
the competitive environment in the Company’s industry and the markets where the Company
invests; changes in real estate and zoning laws or regulations; legislative or regulatory
changes, including changes to laws governing the taxation of REITS; changes in generally
accepted accounting principles, policies and guidelines; and litigation, judgments or
settlements.
Additional risks are discussed in the Company’s filings with the Securities and
Exchange Commission, including those appearing under the heading “Item 1A. Risk Factors” in the
Company’s most recent Form 10-K and subsequent Form 10-Qs. Although the Company
believes the expectations reflected in such forward-looking statements are based on reasonable
assumptions, it can give no assurance that its expectations will be attained. The
forward-looking statements are made as of the date of this presentation, and the Company undertakes
no obligation to publicly update or revise any forward-looking statement, whether as a
result of new information, future events or otherwise, except as required by law.
|
 Non-GAAP
to GAAP Reconciliations 29
Reconciliation of Net Debt / EBITDA
($ in 000s)
3Q 2013
(a)
Consolidated debt
$1,299,567
Pro rata share of unconsolidated debt
239,400
Pro rata share of consolidated debt
(133,042)
Cash and cash equivalents
(79,801)
Net Debt
$1,326,124
Comparable EBITDA
$210,000
Net Debt / EBITDA
6.3x
(a) Comparable EBITDA reflects mid-point of guidance range.
($ in 000s)
3Q 2013
(a)
Preferred equity capitalization
$289,102
Consolidated debt
1,299,567
Pro rata share of unconsolidated debt
239,400
Pro rata share of consolidated debt
(133,042)
Cash and cash equivalents
(79,801)
Net Debt + Preferreds
$1,615,226
Comparable EBITDA
$210,000
Net Debt + Preferreds / EBITDA
7.7x
(a) Comparable EBITDA reflects mid-point of guidance range.
Reconciliation of Net Debt + Preferred Equity / EBITDA
Reconciliation of Net Debt / TEV
($ in 000s)
3Q 2013
Consolidated Debt
$1,299,567
Pro rata share of unconsolidated debt
239,400
Pro rata share of consolidated debt
(133,042)
Cash and cash equivalents
(79,801)
Net Debt
$1,326,124
Market Capitalization
$1,805,553
Total Debt
1,405,925
Preferred Equity
289,102
Cash and cash equivalents
(79,801)
Total Enterprise Value
$3,420,779
Net Debt / Enterprise Value
38.8% |
 Non-GAAP
to GAAP Reconciliations 30 |
 Non-GAAP
to GAAP Reconciliations 31 |
 Non-GAAP
to GAAP Reconciliations 32 |
 Thank
You |