Attached files
| file | filename |
|---|---|
| 8-K - 8-K - POPULAR, INC. | d659952d8k.htm |
 Financial Results
Fourth Quarter 2013
Fourth Quarter 2013
Exhibit 99.1 |
 The
information
contained
in
this
presentation
includes
forward-looking
statements
within
the
meaning
of
the
Private
Securities
Litigation
Reform
Act
of
1995.
These
forward-looking
statements
are
based
on
management’s
current
expectations
and
involve
risks
and
uncertainties
that
may
cause
the
Company's
actual
results
to
differ
materially
from
any
future
results
expressed
or
implied
by
such
forward-looking
statements.
Factors
that
may
cause
such
a
difference
include,
but
are
not
limited
to
(i)
the
rate
of
growth
in
the
economy
and
employment
levels,
as
well
as
general
business
and
economic
conditions;
(ii)
changes
in
interest
rates,
as
well
as
the
magnitude
of
such
changes;
(iii)
the
fiscal
and
monetary
policies
of
the
federal
government
and
its
agencies;
(iv)
changes
in
federal
bank
regulatory
and
supervisory
policies,
including
required
levels
of
capital;
(v)
the
relative
strength
or
weakness
of
the
consumer
and
commercial
credit
sectors
and
of
the
real
estate
markets
in
Puerto
Rico
and
the
other
markets
in
which
borrowers
are
located;
(vi)
the
performance
of
the
stock
and
bond
markets;
(vii)
competition
in
the
financial
services
industry;
(viii)
possible
legislative,
tax
or
regulatory
changes;
(ix)
the
impact
of
the
Dodd-Frank
Act
on
our
businesses,
business
practice
and
cost
of
operations;
and
(x)
additional
Federal
Deposit
Insurance
Corporation
assessments.
Other
than
to
the
extent
required
by
applicable
law,
the
Company
undertakes
no
obligation
to
publicly
update
or
revise
any
forward-looking
statement.
Please
refer
to
our
Annual
Report
on
Form
10-K
for
the
year
ended
December
31,
2012
and
other
SEC
reports
for
a
discussion
of
those
factors
that
could
impact
our
future
results.
The
financial
information
included
in
this
presentation
for
the
quarter
ended
December
31,
2013
is
based
on
preliminary
unaudited
data
and
is
subject
to
change.
1
Forward Looking Statements |
 2013
Full Year Highlights 2
Credit
EVTC
•
Current stake of 14.9% with a market value of approximately $300
million (January 2014) and book value of $19.9 million as of
December 31, 2013
•
Popular recognized an after tax gain of $424 million during 2013
which generated approximately $585 million in cash to the holding
company
•
$1.1 billion in NPAs sold in 2013
•
Continued improvement across key metrics, reaching new lows in the
cycle and returning to pre-crisis levels
NPAs/Total Assets declined to 2.6% from a peak of 7.2% in Q1 2010
NPL inflows down $492 million or 42% YoY; down 85% from peak levels in
Q2 2009
NCO ratio was 1.19% compared to 1.97% last year
Earnings
•
Reported annual net income of $599.3 million
•
Adjusted net income of $256.2 million*
* See appendix for non-GAAP to GAAP reconciliation |
  Total
Deposits (Net of Brokered) 1
39%
Total Loans
1
35%
Commercial & Construction Loans
1
38%
Credit Cards
1
51%
Mortgage Loan Production
1
32%
Personal Loans
1
30%
Auto Loans/Leases
3
26%
Assets Under Management
3
14%
Category
Market Position
as of Q3 2013
Market Share
as of Q3 2013
Market Leadership in Puerto Rico
Popular’s Market Share Trend
Puerto Rico Market Share by Category
Source:
Puerto
Rico
Office
of
the
Commissioner
of
Financial
Institutions
&
10K
reports;
Mortgage
origination
data
is
not
publicly
available;
Figures
presented
for
BPPR
and
competitors
were
provided
internally;
Personal
Loans:
As
a
group,
Credit
Unions
represent
the
largest
competitor
with
52%
market
share
(115
Credit
Unions
were
in
business
as
of
December
31,
2012
guaranteed
by
COSSEC)
3 |
 Q4
2013 Highlights 4
Credit
EVTC
•
Popular recognized an after tax gain of $99 million during the
quarter which generated approximately $118 million in cash to the
holding company
•
NPAs declined by $21.7 million
QoQ improvement was driven by commercial, legacy and construction
NPLs, in part offset by higher mortgage NPLs in the PR segment
•
Total NPL inflows decreased by $20.5 million, or 12.6% QoQ
•
NCOs for Q4 2013 are down by $22.5 million or 38.9% QoQ
NCO ratio stands at 0.66%, lowest level since Q2 2006
Earnings
•
Reported net income of $163 million
•
Adjusted net income of $74.6 million*
•
Strong margins: Popular, Inc. 4.74%, BPPR 5.59%
*See appendix for non-GAAP to GAAP reconciliation |
 TARP
& Capital 5
•
Submitted an application to repay TARP in full; subject to regulatory
approval •
Robust capital (Tier1 Common Equity ratio of 15.0%), $2.3 billion in excess of 5%
CCAR target
Common Tier 1 Capital
5.0%
15.0%
13.2%
Tier 1 Capital
6.0%
19.4%
15.3%
Total Capital
10.0%
20.7%
16.6%
Leverage
5.0%
12.9%
10.1%
Minimum
Well
Capitalized
Ratio
12/31/2013
Pro-forma
12/31/2013
Excl. TARP |
 Q4
2013 Q3 2013
See appendix for Non-GAAP to GAAP reconciliation
Non GAAP
Non GAAP
In thousands
Adjusted
Adjusted
Net interest income
$376,342
$354,206
$22,136
Non Interest Income
135,996
130,958
5,038
Total revenues before FDIC loss share impact
512,338
485,164
27,174
FDIC loss-share income (expense)
(37,164)
(14,866)
(22,298)
Gross revenues
475,174
470,298
4,876
Provision for loan losses (excluding covered loans)
47,729
55,230
(7,501)
Provision for loan losses (covered loans)
8,907
17,433
(8,526)
Total provision for loan losses
56,636
72,663
(16,027)
Net revenues
418,538
397,635
20,903
Personnel costs
114,360
116,839
(2,479)
Other real estate owned (OREO) expenses
10,558
17,175
(6,617)
Other operating expenses
197,785
192,335
5,450
Total operating expenses
322,703
326,349
(3,646)
Income before tax
95,835
71,286
24,549
Income tax expense
21,217
9,979
11,238
Net income
$74,618
$61,307
$13,311
Adjusted
Variance
Financial Summary (unaudited)
6 |
 Capital
7
Capital Ratios %
Excess Capital ($ in billions)
**Excess
capital
over
“well
capitalized”
Basel
I
threshold
*Averages
for
30
bank
holding
Companies
with
$50
billion
or
more
of
total
consolidated
assets,
consisting
of
19
firms
included
in
Comprehensive
Capital
Analysis
and
Review
(CCAR)
and
11
firms
included
in
Capital
Plan
Review
(CapPR).
•
Tier 1 Common Equity capital ratio of 15.0% exceeds current CCAR
5% target by $2.3
billion
•
We
expect
to
remain
“well-capitalized”
under
Basel
III
rules
issued
by
the
Federal
Reserve |
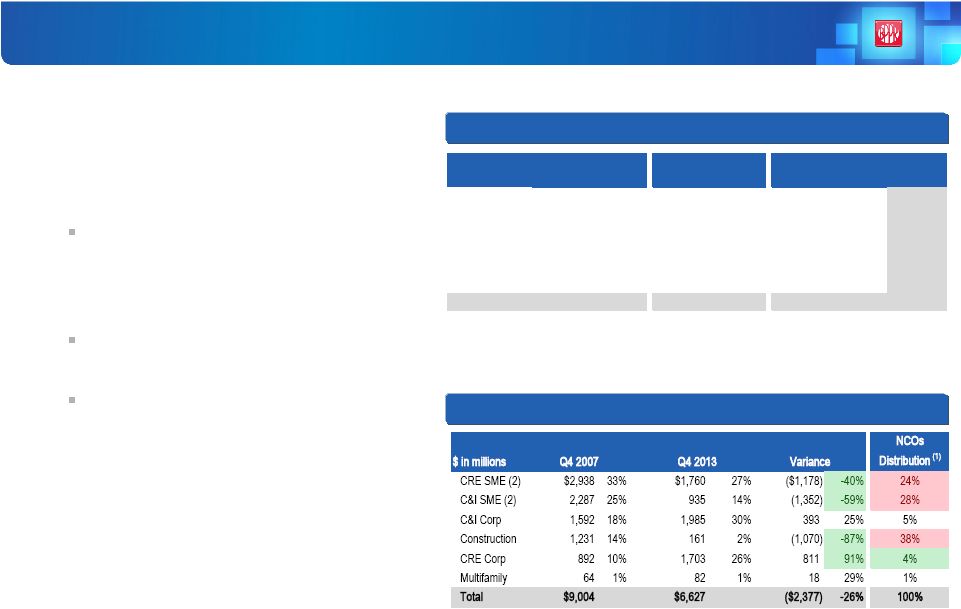 De-risked Loan Portfolios
•
PR has derisked its commercial loan
portfolio by reducing its exposure in
asset classes with historically high loss
content
Commercial portfolio, including
construction, has decreased from
55% of total loans held-in-portfolio
to 42%
Construction portfolio is down by
87% since Q4 2007
SME
(2)
lending is down by 48% from
Q4 2007
•
Collateralized exposure now represents
a larger portion of consumer loan
portfolio
•
Unsecured loans credit quality has
improved as overall FICO scores have
increased
Loan Composition (Held-in Portfolio)
PR Commercial and Construction Portfolio Distribution
8
(1) NCOs distribution represents the percentage allocation of NCOs from
Q1 2008 through Q3 2013 per each loan category. (2) Small and Medium
Enterprise Legacy portfolio is comprised of certain commercial, construction
and lease financings lending products exited by the US. $ in
millions Q4 2007
Q4 2013
Q4 2007
Q4 2013
Q4 2007
Q4 2013
Variance
Commercial
$7,774
$6,465
$4,515
$3,571
$12,288
$10,036
($2,252)
Consumer
3,552
3,317
1,698
1,281
5,249
4,598
(651)
Mortgage
2,933
5,401
3,139
616
6,071
6,017
(54)
Construction
1,231
161
237
45
1,468
206
(1,262)
Leases
814
544
-
-
814
544
(270)
Legacy
-
2,130
211
2,130
211
(1,919)
Total
$16,304
$15,888
$11,718
$5,724
$28,021
$21,612
($6,409)
Puerto Rico
US
Total |
 $618
$770
$858
$1,008
$771
$781
$923
$1,028
$1,203
$1,404
$1,978
$2,116
$2,276
$2,313
$2,330
$2,344
$1,572
$1,614
$1,625
$1,732
$1,738
$1,682
$1,563
$1,550
$1,425
$1,051
$614
$618
$598
2.4%
2.7%
3.1%
2.8%
2.9%
3.5%
3.9%
4.7%
5.6%
8.0%
8.7%
9.6%
10.0%
10.4%
10.6%
7.6%
7.9%
7.9%
8.4%
8.4%
8.2%
7.6%
7.5%
6.8%
4.9%
2.9%
2.9%
2.8%
0.0%
2.0%
4.0%
6.0%
8.0%
10.0
12.0
14.0
1Q 07
2Q 07
3Q 07
4Q 07
1Q 08
2Q 08
3Q 08
4Q 08
1Q 09
2Q 09
3Q 09
4Q 09
1Q 10
2Q 10
3Q 10
4Q 10
Q1 11
Q2 11
Q3 11
Q4 11
Q1 12
Q2 12
Q3 12
Q4 12
Q1 13
Q2 13
Q3 13
Q4 13
Mortgage
Commercial & Construction
Other
NPL/Loans (HIP)
$944
$859
$971
$1,142
$852
$866
$1,026
$1,101
$1,293
$1,500
$2,084
$2,245
$2,402
$2,448
$2,539
$2,623
$2,489
$2,314
$2,277
$2,254
$2,365
$2,311
$2,178
$2,120
$2,002
$1,419
$992
$944
$922
1.8%
2.1%
2.4%
1.9%
2.1%
2.5%
2.7%
3.3%
4.0%
5.7%
6.3%
6.9%
7.2%
6.0%
6.4%
6.4%
6.0%
5.8%
5.9%
6.3%
6.2%
5.9%
5.8%
5.5%
3.8%
2.7%
2.6%
2.6%
1Q 07
2Q 07
3Q 07
4Q 07
1Q 08
2Q 08
3Q 08
4Q 08
1Q 09
2Q 09
3Q 09
4Q 09
1Q 10
2Q 10
3Q 10
4Q 10
Q1 11
Q2 11
Q3 11
Q4 11
Q1 12
Q2 12
Q3 12
Q4 12
Q1 13
Q2 13
Q3 13
Q4 13
NPLs
OREO
NPL HFS
NPAs/Total Assets
Steady Improvements in Non Performing Assets
•
Non-performing loans held-in-portfolio declined by
$19.6 million, or 3.2%, QoQ and by $827 million, or
58% YoY
•
NPL to loans stands at 2.8% compared to 2.9% in Q3
2013, and at the same level in Q4 2007
•
QoQ improvement was driven by commercial, legacy
and construction NPLs, in part offset by higher
mortgage NPLs in the PR segment
Non-Performing Loans HIP ($MM)
9
Non-Performing Assets ($MM)
Metrics exclude covered loans
•
Non-performing assets declined by $21.7 million,
or 2.3%, QoQ and $1.1 billion, or 54%, YoY
•
Steady improvements following NPA bulk sales
completed
during the first half of 2013 |
 Total NPL Inflows ($MM)
NPL Inflows Continued Trending Down
•
Total NPL inflows decreased by $21 million, or
13% QoQ, and $492 million or 42% YoY; down
85% from peak levels in Q2 2009
•
Commercial, construction and legacy NPL inflows
reached new record low, decreasing by $22
million or 34% QoQ
•
Mortgage NPLs remained flat in both regions QoQ
Mortgage NPL Inflows ($MM)
Commercial, Construction & Legacy NPL Inflows ($MM)
10
Excludes consumer loans
Metrics exclude covered loans
$67
$92
$87
$84
$55
$51
$52
$34
$26
$29
$27
$16
$271
$273
$397
$333
$279
$231
$257
$210
$158
$158
$136
$126
Q1 11
Q2 11
Q3 11
Q4 11
Q1 12
Q2 12
Q3 12
Q4 12
Q1 13
Q2 13
Q3 13
Q4 13
US Inflows
PR Inflows
$9
$13
$10
$8
$6
$6
$10
$8
$5
$7
$5
$6
$140
$154
$175
$232
$187
$166
$157
$167
$110
$99
$94
$94
Q1 11
Q2 11
Q3 11
Q4 11
Q1 12
Q2 12
Q3 12
Q4 12
Q1 13
Q2 13
Q3 13
Q4 13
US Inflows
PR Inflows
$58
$79
$77
$76
$48
$45
$42
$26
$22
$22
$22
$10
$131
$119
$222
$101
$93
$65
$100
$43
$48
$59
$42
$32
Q1 11
Q2 11
Q3 11
Q4 11
Q1 12
Q2 12
Q3 12
Q4 12
Q1 13
Q2 13
Q3 13
Q4 13
US Inflows
PR Inflows |
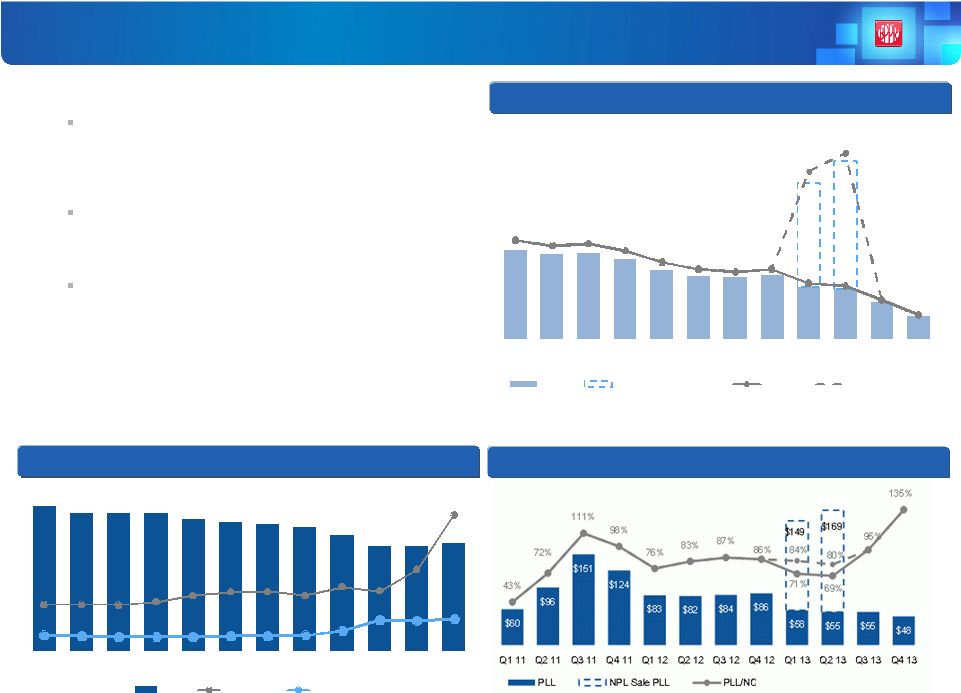 Continued Progress in Asset Quality
•
NCOs for Q4 2013 are down by $23 million or 39% QoQ
Recoveries up by $17 million driven by:
–
$9 million recovery related to the sale of previously
charged-off PR credit cards and personal loans
–
Higher commercial recoveries of $6 million
NCO ratio of 0.66%, lowest level since Q2 2006
Provision to NCO of 135%, compared to 95% in Q3
2013
•
ALLL to loans stands at 2.49% compared to 2.46% on Q3
2013
•
ALLL to NPL coverage ratio continued improving, standing
at 90% compared to 44% in Q4 2012, primarily driven by
the bulk sales in the first half of the year
ALLL ($MM), ALLL-to-NCO and ALLL-to-NPL Ratios
NCO ($MM) and NCO-to-HIP Loan Ratio
Provision ($MM) and Provision-to-NCO Ratio
11
Metrics exclude covered loans
$139
$133
$135
$126
$108
$98
$96
$101
$81
$79
$58
$35
$163
$200
2.74%
2.59%
2.64%
2.46%
2.13%
1.93%
1.87%
1.94%
1.55%
1.47%
1.08%
0.66%
4.66%
5.16%
Q1 11
Q2 11
Q3 11
Q4 11
Q1 12
Q2 12
Q3 12
Q4 12
Q1 13
Q2 13
Q3 13
Q4 13
NCO
NPL Sale Charge-offs
NCO%
NPL Sale NCO%
$727
$690
$693
$690
$665
$649
$636
$622
$584
$529
$526
$538
130%
129%
128%
137%
154%
165%
166%
154%
179%
167%
227%
381%
44%
42%
40%
40%
40%
41%
41%
44%
56%
86%
85%
90%
Q1 11
Q2 11
Q3 11
Q4 11
Q1 12
Q2 12
Q3 12
Q4 12
Q1 13
Q2 13
Q3 13
Q4 13
ALLL
ALLL/NCO
ALLL/NPL
•
Provision totaled $48 million, down by $8 million or 14%
vs. Q3 2013; |
 PR
Public Sector Exposure •
Loans to the Government of Puerto Rico and Public Corporations
are either collateralized loans or obligations that have a specific
source of income or revenues identified for their repayment
12
•
Loans to various municipalities backed by unlimited taxing power
or
real and personal property taxes collected within such municipalities
•
Includes $274 million residential mortgage loans to individual
borrowers with a government guarantee
•
$52 million in PR pass-through housing bonds backed by FNMA,
GNMA or residential loan CMOs
•
$34 million of industrial development notes payable primarily by
non government tenants
•
Our
current
direct
exposure
to
the
PR
government, instrumentalities
and municipalities
is
$1.2
billion,
of which
approximately $950 million
is
outstanding
•
Of
the
amount
outstanding,
$789 million
consists
of
loans
and
$161
million
are
securities
PR
Government
$527 million
outstanding
Indirect
Exposure
$360 million
outstanding
Municipalities
$423 million
outstanding
•
Additional $360 million in indirect exposure of loans or instruments that are
payable by non-governmental entities and have a government guarantee to
cover any shortfall in collateral in the event of borrower default
|
 Driving Shareholder Value
13
Capital
Earnings
Additional
Value
•
Robust
capital
with
excess
Tier
1
Common
Equity
of
$2.3
billion
and
significantly
improved
asset
quality
move
us
closer
to
TARP
exit
in
the
most
shareholder-friendly
fashion
•
Application for TARP repayment was submitted
•
Unique franchise in PR provides strong, stable revenue-generating
capacity
•
Popular’s credit metrics are now close to historical low levels
•
EVTC ownership, BHD stake and continued improvement in US
operations |
 APPENDIX
 |
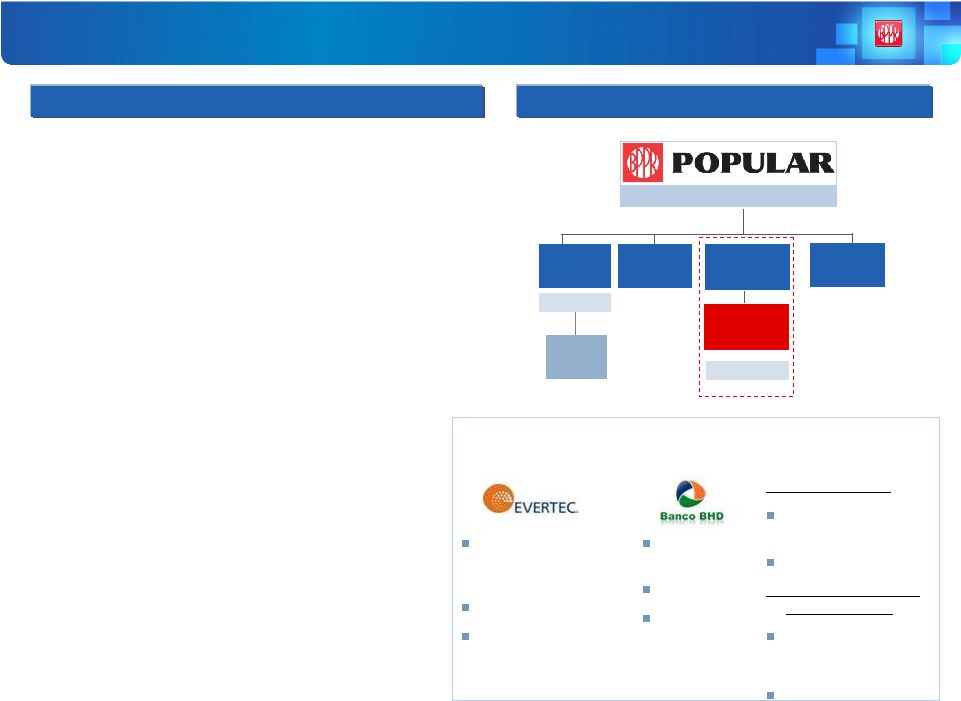 Who
We Are – Popular, Inc.
Franchise
•
Financial services company
•
Headquartered in San Juan, Puerto Rico
•
$36 billion in assets (top 50 bank holding
company in the U.S.)
•
$25 billion in total loans
•
$27 billion in total deposits
•
276 branches serving customers in Puerto
Rico, New York, California, Florida, Illinois,
U.S. Virgin Islands, and New Jersey
•
NASDAQ ticker symbol: BPOP
•
Market Cap: $2.97 billion
1
1
As of December 31, 2013
*Doing business as Popular Community Bank.
Summary Corporate Structure
Assets = $35.8 bn
Popular Auto,
Inc.
Banco Popular
de Puerto Rico
Popular
Securities, Inc.
Assets = $27 bn
Assets = $8.7bn
Banco Popular
North America*
Puerto Rico operations
Selected equity investments
(first two under “corporate”
segment and third and fourth under PR):
Popular
Insurance, Inc.
Popular North
America, Inc.
U.S. banking operations
Transaction processing,
business processes
outsourcing
14.9% stake
Adjusted EBITDA of $180.7
million for the 12-months
ended September 30, 2013;
$43.4 million for Q3 2013.
Dominican
Republic bank
19.99% stake
2012
approximate net
income $114
million
PRLP 2011 Holdings
Construction and
commercial loans vehicle
24.9% stake
PR Asset Portfolio 2013-1
International, LLC
Construction, commercial
loans and OREOs
vehicle
24.9% stake
15 |
 [1] Covered loans represent loans acquired in the Westernbank FDIC-assisted
transaction that are covered under FDIC loss sharing agreements. 16
GAAP Reconciliation Q4 2013
Q4 2013
US GAAP
Non GAAP
In thousands, except per share amount
Actual
EVERTEC's
SPO
Adjusted
Net interest income
$376,342
$376,342
Non interest income
228,354
92,358
$135,996
Total revenues before FDIC loss-share impact
604,696
92,358
512,338
FDIC loss-share income (expense)
(37,164)
(37,164)
Gross revenues
567,532
92,358
475,174
Provision for loan losses (excluding covered loans)
47,729
47,729
Provision for loan losses (covered loans)
(1)
8,907
8,907
Total provision for loan losses
56,636
56,636
Net revenues
510,896
92,358
418,538
Personnel costs
114,360
114,360
OREO expenses
10,558
10,558
Other operating expenses
197,785
-
197,785
Total operating expenses
322,703
-
322,703
Income before tax
188,193
92,358
95,835
Income tax expense
25,162
3,945
21,217
Net income
$163,031
$88,413
$74,618
EPS -
Basic
$1.58
EPS -
Diluted
$1.57
NIM
4.74%
Tangible book value per share (quarter end)
$37.56
Market price (quarter end)
$28.73 |
 GAAP
Reconciliation Q3 2013 17
[1] Covered loans represent loans acquired in the Westernbank FDIC-assisted
transaction that are covered under FDIC loss sharing agreements. Q3 2013
US GAAP
Non GAAP
In thousands, except per share amount
Actual
EVERTEC's
SPO
Adjusted
Net interest income
$354,206
$354,206
Non interest income
306,825
175,867
$130,958
Total revenues before FDIC loss-share impact
661,031
175,867
485,164
FDIC loss-share income (expense)
(14,866)
(14,866)
Gross revenues
646,165
175,867
470,298
Provision for loan losses (excluding covered loans)
55,230
55,230
Provision for loan losses (covered loans)
(1)
17,433
17,433
Total provision for loan losses
72,663
72,663
Net revenues
573,502
175,867
397,635
Personnel costs
116,839
116,839
OREO expenses
17,175
17,175
Other operating expenses
192,585
250
192,335
Total operating expenses
326,599
250
326,349
Income before tax
246,903
175,617
71,286
Income tax expense
17,768
7,789
9,979
Net income
$229,135
$167,828
$61,307
EPS -
Basic
$2.22
EPS -
Diluted
$2.22
NIM
4.49%
Tangible book value per share (quarter end)
$35.32
Market price (quarter end)
$26.25 |
 GAAP
Reconciliation FY 2013 18
[1] Covered
loans
represent
loans
acquired
in
the
Westernbank
FDIC-assisted
transaction
that
are
covered
under
FDIC
loss
sharing
agreements.
[2]
Net
(loss)
gain
on
sale
of
loans
for
the
first
quarter
includes
$8.8
million
of
negative
valuation
adjustments
on
loans
held
for
sale
which
were
transferred
to
held-in-portfolio
subsequent
to
the
sale.
[3]
Represents
the
net
benefit
of
$215.6
million
for
the
increase
on
the
net
deferred
tax
asset
from
the
change
of
the
corporate
tax
rate
from
30%
to
39%,
$7.9
million
resulting
from
the
adjustment
in
tax
rate
for
distributions
from
EVERTEC
from
15%
to
4% |
 19
Consolidated Credit Summary (Excluding Covered Loans)
1
Excluding provision for loan losses and net write-downs related to the asset
sale $ in millions
Q4 13
Q3 13
Q2 13
Q1 13
Q4 12
Loans Held in Portfolio (HIP)
$21,612
$21,427
$21,522
$21,634
$20,984
Performing HFS
109
123
180
183
258
NPL HFS
1
2
11
18
96
Total Non Covered Loans
21,722
21,552
21,713
21,835
21,338
Non-performing loans (NPLs)
$598
$618
$614
$1,051
$1,425
Commercial
$282
$320
$328
$321
$665
Construction
$24
$29
$45
$51
$43
Legacy
$15
$24
$28
$36
$41
Mortgage
$233
$203
$172
$601
$630
Consumer
$44
$42
$41
$42
$46
NPLs HIP to loans HIP
2.77%
2.88%
2.85%
4.86%
6.79%
Net charge-offs (NCOs)
$35
$58
$79
$81
$101
Commercial
$16
$21
$41
$32
$49
Construction
($2)
($5)
($2)
$0
($2)
Legacy
($5)
$2
($1)
$2
$3
Mortgage
$8
$13
$16
$20
$20
Consumer
$18
$27
$26
$27
$31
Write-downs bulk sale
$0
$0
$200
$163
$0
NCOs to average loans HIP
0.66%
1.08%
1
1.47%
1
1.55%
1.94%
Provision for loan losses (PLL)
$48
$55
1
$55
1
$58
$86
PLL to average loans HIP
0.89%
1.03%
1
1.02%
1
1.10%
1.66%
PLL to NCOs
1.35x
0.95x
1
0.69x
1
0.71x
0.86x
Allowance for loan losses (ALL)
$538
$526
$529
$584
$622
ALL to loans HIP
2.49%
2.46%
2.46%
2.70%
2.96%
ALL to NPLs HIP
90.05%
85.19%
86.14%
55.54%
43.62% |
 PR
& US Business 20
1
Excludes covered loans
$ in millions (unaudited)
Q4 13
Q3 13
Variance
Q4 13
Q3 13
Variance
Net Interest Income
$331
$310
$21
$71
$73
($2)
Non Interest Income
72
91
(19)
16
17
(1)
Gross Revenues
403
401
2
87
90
(3)
Provision (non-covered)
63
51
12
(15)
5
(20)
Provision (covered)
9
17
(8)
-
-
- Provision for loan losses
72
68
4
(15)
5
(20)
Expenses
246
244
2
59
59
0
Tax Expense
25
26
(1)
0
1
(1)
Net Income
$60
$63
($3)
$43
$25
$18
NPLs (HIP) ¹
$447
$441
$6
$151
$176
($25)
NPLs (HIP + HFS) ¹
447
442
5
152
178
(26)
Loan loss reserve ¹
427
399
28
112
127
(15)
Assets
$26,883
$27,090
($207)
$8,725
$8,782
($57)
Loans (HIP)
18,871
18,739
132
5,724
5,763
(39)
Loans (HIP + HFS)
18,979
18,860
119
5,726
5,766
(40)
Deposits
20,753
20,401
352
6,027
6,042
(15)
NIM
5.59%
5.26%
0.33%
3.55%
3.66%
-0.11%
PR
US |
 Popular, Inc. Credit Ratings
•
Our
senior
unsecured
ratings
have
been
gradually
improving
since
2010:
•
Moody’s:
B1
Negative Outlook (Revised October 2013)
•
Fitch:
BB-
Stable Outlook (Reaffirmed December 2013)
•
S&P:
B+
Stable Outlook (Revised December 2011)
•
October 2013: Moody’s revised outlook to negative
•
January
2013:
Fitch
raised
to
BB-
from
B+;
outlook
revised
to
stable
•
December 2012: Moody’s downgraded BPOP to B1; stable outlook assigned
•
April 2012: Moody’s placing most of the PR banks under review with the
possibility of downgrades, due to the state of the Puerto Rico economy
•
January 2012: Fitch raised BPOP’s outlook to positive
•
December
2011:
S&P
raised
its
ratings
on
BPPR
to
BB
from
BB-
and
changed
outlook
to
stable
given
revised
bank
criteria
to
regional
banks
•
July 2011: S&P raised our senior unsecured rating by one notch to B+
21 |
 Financial Results
Fourth Quarter 2013
Fourth Quarter 2013 |