Attached files
| file | filename |
|---|---|
| 8-K - FORM 8-K - FIFTH THIRD BANCORP | d660158d8k.htm |
| EX-99.1 - EX-99.1 - FIFTH THIRD BANCORP | d660158dex991.htm |
| EX-99.3 - EX-99.3 - FIFTH THIRD BANCORP | d660158dex993.htm |
| EX-99.4 - EX-99.4 - FIFTH THIRD BANCORP | d660158dex994.htm |
 ©
Fifth Third Bank | All Rights Reserved
4Q13 Earnings Conference Call
January 23, 2014
Please refer to earnings release dated January 23, 2014 for further
information. Exhibit 99.2 |
 2
©
Fifth Third Bank | All Rights Reserved
Cautionary statement
This
report
contains
statements
that
we
believe
are
“forward-looking
statements”
within
the
meaning
of
Section
27A
of
the
Securities
Act
of
1933,
as
amended,
and
Rule
175
promulgated
thereunder,
and
Section
21E
of
the
Securities
Exchange
Act
of
1934,
as
amended,
and
Rule
3b-6
promulgated
thereunder.
These
statements
relate
to
our
financial
condition,
results
of
operations,
plans,
objectives,
future
performance
or
business.
They
usually
can
be
identified
by
the
use
of
forward-looking
language
such
as
“will
likely
result,”
“may,”
“are
expected
to,”
“is
anticipated,”
“estimate,”
“forecast,”
“projected,”
“intends
to,”
or
may
include
other
similar
words
or
phrases
such
as
“believes,”
“plans,”
“trend,”
“objective,”
“continue,”
“remain,”
or
similar
expressions,
or
future
or
conditional
verbs
such
as
“will,”
“would,”
“should,”
“could,”
“might,”
“can,”
or
similar
verbs.
You
should
not
place
undue
reliance
on
these
statements,
as
they
are
subject
to
risks
and
uncertainties,
including
but
not
limited
to
the
risk
factors
set
forth
in
our
most
recent
Annual
Report
on
Form
10-K.
When
considering
these
forward-looking
statements,
you
should
keep
in
mind
these
risks
and
uncertainties,
as
well
as
any
cautionary
statements
we
may
make.
Moreover,
you
should
treat
these
statements
as
speaking
only
as
of
the
date
they
are
made
and
based
only
on
information
then
actually
known
to
us.
There
are
a
number
of
important
factors
that
could
cause
future
results
to
differ
materially
from
historical
performance
and
these
forward-
looking
statements.
Factors
that
might
cause
such
a
difference
include,
but
are
not
limited
to:
(1)
general
economic
conditions
and
weakening
in
the
economy,
specifically
the
real
estate
market,
either
nationally
or
in
the
states
in
which
Fifth
Third,
one
or
more
acquired
entities
and/or
the
combined
company
do
business,
are
less
favorable
than
expected;
(2)
deteriorating
credit
quality;
(3)
political
developments,
wars
or
other
hostilities
may
disrupt
or
increase
volatility
in
securities
markets
or
other
economic
conditions;
(4)
changes
in
the
interest
rate
environment
reduce
interest
margins;
(5)
prepayment
speeds,
loan
origination
and
sale
volumes,
charge-offs
and
loan
loss
provisions;
(6)
Fifth
Third’s
ability
to
maintain
required
capital
levels
and
adequate
sources
of
funding
and
liquidity;
(7)
maintaining
capital
requirements
may
limit
Fifth
Third’s
operations
and
potential
growth;
(8)
changes
and
trends
in
capital
markets;
(9)
problems
encountered
by
larger
or
similar
financial
institutions
may
adversely
affect
the
banking
industry
and/or
Fifth
Third;
(10)
competitive
pressures
among
depository
institutions
increase
significantly;
(11)
effects
of
critical
accounting
policies
and
judgments;
(12)
changes
in
accounting
policies
or
procedures
as
may
be
required
by
the
Financial
Accounting
Standards
Board
(FASB)
or
other
regulatory
agencies;
(13)
legislative
or
regulatory
changes
or
actions,
or
significant
litigation,
adversely
affect
Fifth
Third,
one
or
more
acquired
entities
and/or
the
combined
company
or
the
businesses
in
which
Fifth
Third,
one
or
more
acquired
entities
and/or
the
combined
company
are
engaged,
including
the
Dodd-Frank
Wall
Street
Reform
and
Consumer
Protection
Act;
(14)
ability
to
maintain
favorable
ratings
from
rating
agencies;
(15)
fluctuation
of
Fifth
Third’s
stock
price;
(16)
ability
to
attract
and
retain
key
personnel;
(17)
ability
to
receive
dividends
from
its
subsidiaries;
(18)
potentially
dilutive
effect
of
future
acquisitions
on
current
shareholders’
ownership
of
Fifth
Third;
(19)
effects
of
accounting
or
financial
results
of
one
or
more
acquired
entities;
(20)
difficulties
from
the
separation
of
or
the
results
of
operations
of
Vantiv,
LLC;
(21)
loss
of
income
from
any
sale
or
potential
sale
of
businesses
that
could
have
an
adverse
effect
on
Fifth
Third’s
earnings
and
future
growth;
(22)
ability
to
secure
confidential
information
and
deliver
products
and
services
through
the
use
of
computer
systems
and
telecommunications
networks;
and
(23)
the
impact
of
reputational
risk
created
by
these
developments
on
such
matters
as
business
generation
and
retention,
funding
and
liquidity.
You
should
refer
to
our
periodic
and
current
reports
filed
with
the
Securities
and
Exchange
Commission,
or
“SEC,”
for
further
information
on
other
factors,
which
could
cause
actual
results
to
be
significantly
different
from
those
expressed
or
implied
by
these
forward-looking
statements. |
 3
©
Fifth Third Bank | All Rights Reserved
2013: A record year
Return on avg. assets
Net charge-off ratio
Net income to common ($MM)
Generated highest level of net
income in Company’s history.
Improving profitability approaching
target for normalized environment.
Problem assets are at the lowest
levels in five years.
Tier 1 common ratio
1
Total payout ratio
ALLL / NPLs
Coverage levels more than adequate
to protect against potential losses.
Capital ratios strong and above
regulatory well-capitalized levels.
Net
payouts
to
shareholders
of
$1.3B
2
in
2013.
1
Non-GAAP measure; see Reg. G reconciliation in appendix; capital ratios
estimated; presented under current U.S. capital regulations. 2
2013 is net of the issuance of shares valued at $398MM related to the Series G
preferred stock conversion on July 1, 2013. 3
Repurchases of shares in the amount of after-tax gains on the sale of Vantiv
shares. |
 4
©
Fifth Third Bank | All Rights Reserved
Net
income
available
to
common
shareholders
of
$383MM
($0.43
per
diluted
share),
vs.
$421MM
($0.47
per
share)
in
3Q13
and
$390MM
($0.43
per
share)
in
4Q12
Overall credit trends remain favorable
—
Net charge-offs of $148MM (0.67% of loans and leases)
–
Includes $43MM of charge-offs on a C&I loan restructured during the quarter
and $6MM of home equity charge-offs due to a change in policy (22 bps
combined impact) –
Excluding these items, net charge-offs declined $10MM or 4 bps from 3Q13
—
Total nonperforming assets (NPA) of $986MM including loans held-for-sale,
down $39MM, or 4%, from 3Q13; NPA ratio of 1.10% down 6 bps from 3Q13,
nonperforming loans ratio of 0.84% down 4 bps from 3Q13
–
Includes $46MM of additions due to a change in policy on home equity nonaccruals (5
bps impact to NPA ratio) Strong capital ratios
2
; sequentially reduced due to 4Q13 repurchases
—
Repurchased 32MM common shares in 4Q13; reduced average diluted share count by
12MM —
Tier 1 common ratio 9.38%
3
vs. 9.88% in 3Q13; Basel III pro forma estimate of ~9.0%
3
—
Tier 1 risk-based capital ratio 10.35%, Total risk-based capital ratio
14.07%, Leverage ratio 9.64% —
Tangible common equity ratio
3
of 8.63% excluding unrealized gains/losses; 8.69% including them
—
Book value per share of $15.85; tangible book value per share
1
of $13.00, up 5% from 4Q12
4Q13 in review
1
Assumes 35% marginal tax rate
2
Capital
ratios
estimated;
presented
under
current
U.S.
capital
regulations.
The
pro
forma
Basel
III
Tier
I
common
equity
ratio
is
management’s
estimate
based
upon
its
current
interpretation
of
recent
prospective
regulatory
capital
requirements
approved
in
July
2013.
3
Non-GAAP measure; see Reg. G reconciliation in appendix.
Significant items in 4Q13 results
$ in MM, except per share data
Net income impact
After tax EPS
impact
Pre-tax
After tax
1
Valuation adjustment on Vantiv warrant
$91
$59
Mortgage repurchase provision benefit
$28
$18
Vantiv tax receivable agreement
$9
$6
Contribution to Fifth Third Foundation
($8)
($5)
Severance expense
($8)
($5)
TruPS debt extinguishment
($8)
($5)
Valuation adjustment on Visa total return swap
($18)
($12)
Expense to increase litigation reserves
($69)
($45)
Total
$17
$11
~$0.01 |
 5
©
Fifth Third Bank | All Rights Reserved
Financial summary
•
Strong returns, with sequential growth in NII and certain fee income categories as
well as ongoing disciplined expense management
•
4Q13 included $19MM, or $0.02 per diluted share, of dividends on
preferred stock
Actual
Seq.
YOY
($ in millions)
4Q12
3Q13
4Q13
$
%
$
%
Average Balances
Total loans & leases1
$83,943
$87,272
$87,895
$623
1%
$3,952
5%
Core deposits
$84,289
$86,921
$89,269
$2,348
3%
$4,980
6%
Income Statement Data
Net interest income (taxable equivalent) (NII)
$903
$898
$905
$7
1%
$2
-
Provision for loan and lease losses
76
51
53
2
5%
(23)
(30%)
Noninterest income
880
721
703
(18)
(2%)
(177)
(20%)
Noninterest expense
1,163
959
989
30
3%
(174)
(15%)
Net income attributable to Bancorp
$399
$421
$402
($19)
(4%)
3
1%
Net income available to common shareholders
$390
$421
$383
($38)
(9%)
($7)
(2%)
Financial Ratios
Earnings per share, diluted
0.43
0.47
0.43
($0.04)
(9%)
-
-
Net interest margin
3.49%
3.31%
3.21%
(10bps)
(3%)
(28bps)
(8%)
Efficiency ratio
65.2%
59.2%
61.5%
230bps
4%
(370bps)
(6%)
Return on average assets
1.33%
1.35%
1.24%
(11bps)
(8%)
(9bps)
(7%)
Return on average common equity
11.5%
12.1%
10.8%
(130bps)
(10%)
(70bps)
(6%)
Return on average tangible common equity2
14.1%
14.7%
13.1%
(160bps)
(11%)
(100bps)
(7%)
Note: Numbers may not sum due to rounding and percentages in all of the tables in
this presentation are calculated on actual dollar amounts not the rounded dollar amounts.
1
Excludes loans held-for-sale
2
Non-GAAP measure; see Reg. G reconciliation in appendix.
|
 6
©
Fifth Third Bank | All Rights Reserved
Net interest income
NII and NIM (FTE)
•
Net interest income up $7MM from 3Q13 and $2MM from 4Q12
–
Sequential increase due to higher balances and yields in investment securities,
higher portfolio loan balances, and the benefit from high-priced CD
maturities partially offset by the effects of loan repricing, lower held-for-
sale loan balances, and higher interest expense.
–
Year-over-year increase due to lower asset yields partially offset by higher
average loan balances, lower long- term debt expense, and run-off in
higher-priced CDs. •
NIM declined 10 bps sequentially largely due to higher cash balances driven by strong
deposit growth as well as the impact of the debt issuances during the quarter.
Otherwise, the benefit from the maturity of high-priced CDs and higher
securities yields offset the impact of lower loan yields. Yield Analysis
4Q12
3Q13
4Q13
Seq.
(bps)
YoY
(bps)
Commercial and industrial loans
4.01%
3.49%
3.46%
(3)
(55)
Commercial mortgage loans
3.69%
3.60%
3.53%
(7)
(16)
Commercial construction loans
3.01%
3.71%
3.46%
(25)
45
Commercial leases
3.42%
3.22%
3.10%
(12)
(32)
Residential mortgage loans
3.94%
3.87%
3.88%
1
(6)
Home equity
3.72%
3.74%
3.62%
(12)
(10)
Automobile loans
3.46%
3.02%
2.96%
(6)
(50)
Credit card
9.96%
9.93%
9.90%
(3)
(6)
Other consumer loans and leases
50.06%
42.84%
43.19%
35
(687)
Total loans and leases
4.13%
3.83%
3.79%
(4)
(34)
Taxable securities
3.23%
3.20%
3.32%
12
9
Tax exempt securities
2.91%
5.08%
5.65%
57
274
Other short-term investments
0.28%
0.26%
0.26%
-
(2)
Total interest-earning assets
3.94%
3.68%
3.57%
(11)
(37)
Total interest-bearing liabilities
0.65%
0.54%
0.52%
(2)
(13)
Net interest spread
3.29%
3.14%
3.05%
(9)
(24) |
 7
©
Fifth Third Bank | All Rights Reserved
Balance sheet
•
Average C&I loans up 2% sequentially and 13% from 4Q12
•
Period end CRE loans up 2% sequentially;
first quarter of sequential CRE growth since 2Q08
•
End of period commercial line utilization 29%;
potential source of future growth
•
Average consumer loans flat sequentially and
up 1% year-over-year
•
Lower production reduced average warehoused
residential mortgage loans held-for-sale to $934MM in
4Q13 versus $1.8B in 3Q13
•
Core deposit to loan ratio of 102%
–
DDAs flat sequentially and up 5% from 4Q12
–
Consumer average transaction deposits up 1%
sequentially and up 4% year-over-year
–
Commercial average transaction deposits up 6%
sequentially and up 10% year-over-year
•
Short-term wholesale borrowings represent <3% of total
funding
Note: Numbers may not sum due to rounding.
1
Excludes loans held-for-sale
Average loan growth ($B)
1
Average core deposit growth ($B) |
 8
©
Fifth Third Bank | All Rights Reserved
Noninterest income
Noninterest income
Note: Numbers may not sum due to rounding.
1
Net
credit-related
costs
recognized
in
other
noninterest
income
were
$5MM
in
4Q13,
reflecting
$6MM
of
losses
on
OREO,
$2MM
of
fair
value
charges
on
commercial
loans
HFS,
and
$2MM
of
mortgage
repurchase
benefits.
This
compares
with
net
credit-related
costs
of
$5MM
in
3Q13
and
$13MM
in
4Q12.
•
4Q13 fee income included sequential growth in mortgage banking net revenue, card and
processing revenue, service charges on deposits, and investment advisory
revenue, partially offset by lower other noninterest income and corporate
banking revenue. •
4Q13 other noninterest income included a $91MM positive valuation adjustment on the
Vantiv warrant, $9MM in payments received pursuant to Fifth Third’s tax
receivable agreement with Vantiv, and an $18MM negative valuation on the Visa
total return swap. –
3Q13 other noninterest income included $89MM of net gains on significant items,
listed on page 10. •
Growth in service charges on deposits due to deeper customer relationships across
consumer and commercial platforms
Actual
Seq.
YOY
4Q12
3Q13
4Q13
$
%
$
%
($ in millions)
Service charges on deposits
$134
$140
$142
$2
1%
$8
6%
Corporate banking revenue
114
102
94
(8)
(8%)
(20)
(18%)
Mortgage banking net revenue
258
121
126
5
4%
(132)
(51%)
Investment advisory revenue
93
97
98
1
2%
5
6%
Card and processing revenue
66
69
71
2
3%
5
8%
Other noninterest income
1
215
185
170
(15)
(7%)
(45)
(21%)
Securities gains, net
2
2
2
-
(36%)
-
(23%)
Securities gains (losses), net -
(2)
5
-
(5)
(100%)
2
100%
non-qualifying hedges on MSRs
Total noninterest income
$880
$721
$703
($18)
(2%)
($177)
(20%)
|
 9
©
Fifth Third Bank | All Rights Reserved
Noninterest expense
Noninterest expense
•
4Q13 results included $69MM in charges to increase litigation reserves, $8MM of debt
extinguishment costs related to TruPS,
$8MM
contribution
to
the
Fifth
Third
Foundation,
and
$8MM
in
severance
expense.
Results
also
included
a
$26MM
benefit
to
the
mortgage
repurchase
provision.
•
3Q13 results included $30MM in charges to increase litigation reserves, $5MM in
severance expense, $5MM in large bank assessment fees, and a $4MM seasonal
pension settlement charge. Results also included a $4MM benefit to the
mortgage repurchase provision.
•
Credit costs recorded in noninterest expense:
Note: Numbers may not sum due to rounding.
Actual
($ in millions)
4Q12
3Q13
4Q13
Mortgage repurchase expense
$44
($4)
($26)
Provision for unfunded commitments
3
1
(5)
Derivative valuation adjustments
(2)
-
(2)
OREO expense
5
5
4
Other problem asset related expenses
19
14
17
Total credit-related operating expenses
$68
$16
($12)
Actual
Seq.
YOY
4Q12
3Q13
4Q13
$
%
$
%
($ in millions)
Salaries, wages and incentives
$416
$389
$388
($1)
-
($28)
(7%)
Employee benefits
96
83
78
(5)
(6%)
(18)
(19%)
Net occupancy expense
76
75
77
2
2%
1
1%
Technology and communications
52
52
53
1
2%
1
2%
Equipment expense
27
29
29
-
-
2
8%
Card and processing expense
31
33
37
4
13%
6
18%
Other noninterest expense
465
298
327
29
10%
(138)
(30%)
Total noninterest expense
$1,163
$959
$989
$30
3%
($174)
(15%)
|
 10
©
Fifth Third Bank | All Rights Reserved
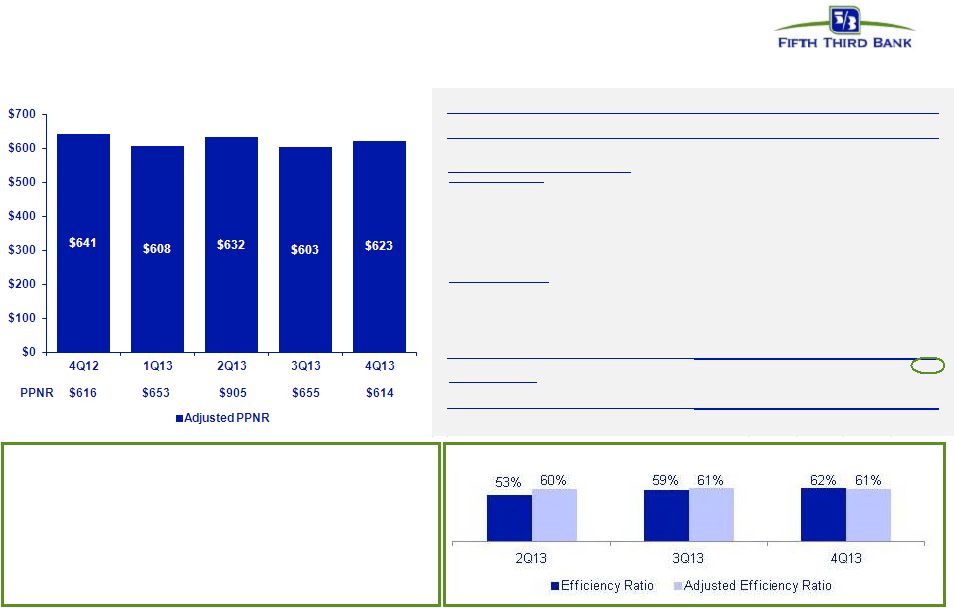
Pre-tax pre-provision earnings
1
PPNR trend
1
Non-GAAP measure; see Reg. G reconciliation in appendix.
2
Prior quarters include similar adjustments.
3
There
are
limitations
on
the
usefulness
of
credit-adjusted
PPNR,
including
the
significant
degree
to
which
changes
in
credit
and
fair
value
are
integral,
recurring
components
of
the
Bancorp’s
core
operations
as
a
financial
institution.
This
measure
has
been
included
herein
to
facilitate
a
greater
understanding
of
the
Bancorp’s
financial
condition.
Note:
4Q13
and
3Q13
also
included benefits to the mortgage repurchase provision of $28MM and $4MM,
respectively. 2Q13 also included the impact of $47MM in mortgage repurchase
provision.
These
impacts
are
reflected
in
“Credit-related
items”
and
“Adjusted
Efficiency
Ratio”
listed
above.
•
PPNR of $614MM down 6% from 3Q13 levels and
flat to prior year
•
Adjusted PPNR of $623MM, up 3% sequentially and
down 3% from prior year
PPNR reconciliation
Efficiency ratio
($ in millions)
4Q12
1Q13
2Q13
3Q13
4Q13
Income before income taxes (U.S. GAAP) (a)
$540
$591
$841
$604
$561
Add: Provision expense (U.S. GAAP) (b)
76
62
64
51
53
PPNR (a) + (b)
$616
$653
$905
$655
$614
2
In noninterest income:
Gain from sales of Vantiv shares
(157)
-
(242)
(85)
-
Vantiv warrant & puts
19
(34)
(76)
(6)
(91)
Other Vantiv-related income
-
-
-
-
(9)
Valuation of 2009 Visa total return swap
15
7
5
2
18
Sale of certain Fifth Third funds
-
(7)
-
-
-
BOLI settlement
-
-
(10)
-
-
Securities (gains) / losses
(2)
(17)
-
(2)
(2)
In noninterest expense:
Debt extinguishment (gains) / losses
134
-
-
-
8
Severance expense
3
3
1
5
8
Large bank assessment fees
-
-
-
5
-
Gain on sale of affordable housing investments
-
(9)
(2)
(1)
-
Donation to Fifth Third Foundation
-
3
-
-
8
Additions to litigation reserves
13
9
51
30
69
Adjusted PPNR
$641
$608
$632
$603
$623
Credit-related items
:
In noninterest income
13
10
6
5
5
In noninterest expense
68
24
35
16
(12)
Credit-adjusted PPNR
3
$722
$642
$673
$624
$616
:
Adjustments to remove (benefit) / detriment |
 11
©
Fifth Third Bank | All Rights Reserved
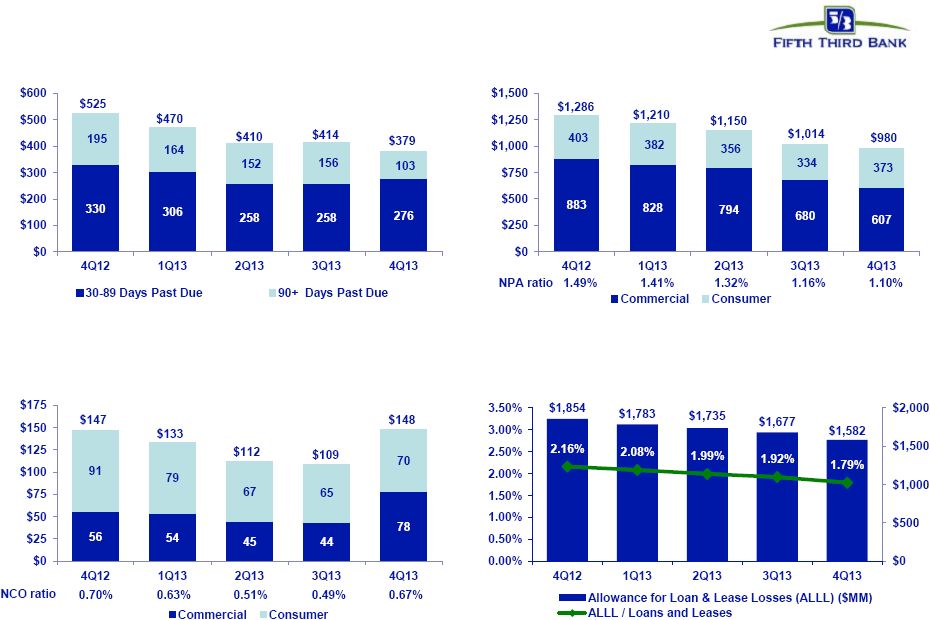
Improving Credit Quality
Net charge-offs ($MM)
4Q13 incl. a $43MM charge-off on a C&I loan restructured during the
quarter and $6MM of home equity charge-offs due to an accounting
policy change.
HFI Nonperforming assets ($MM)
NPAs down 24% from 4Q12;
lowest level since 2007
Reserve Coverage
Accruing Past Due ($MM)
Includes 4Q13 provision expense of $53MM;
Total delinquencies declined 28% from 4Q12;
remain at very low levels
reserve coverage levels remain among best-in-class
|
 12
©
Fifth Third Bank | All Rights Reserved
NPL Rollforward
1
Increase in NPL inflow due to $43 million in inflows related to a portion of a
large credit restructured in 4Q13. This portion was charged off in 4Q13, therefore resulting in no net impact to ending
NPL balances.
2
Increase in NPL inflow primarily due to $46 million inflow resulting from change in
home equity nonaccrual policy. Note: Numbers may not sum due to
rounding. NPL HFI Rollforward
Commercial
4Q12
1Q13
2Q13
3Q13
4Q13
806
697
639
623
521
Transfers to nonperforming
68
80
151
71
107
Transfers to performing
(4)
(1)
(6)
(1)
(1)
Transfers to performing (restructured)
(5)
(4)
(7)
(2)
(2)
Transfers to held-for-sale
0
(1)
(2)
-
-
Loans sold from portfolio
(6)
(3)
(2)
(14)
(19)
Loan paydowns/payoffs
(89)
(53)
(80)
(101)
(61)
Transfers to other real estate owned
(22)
(27)
(28)
(14)
(12)
Charge-offs
(55)
(54)
(45)
(44)
(78)
Draws/other extensions of credit
4
5
3
3
3
697
639
623
521
458
Consumer
4Q12
1Q13
2Q13
3Q13
4Q13
347
332
314
286
248
Transfers to nonperforming
146
124
116
95
165
Transfers to performing
(28)
(26)
(31)
(30)
(25)
Transfers to performing (restructured)
(34)
(29)
(28)
(24)
(22)
Transfers to held-for-sale
-
-
-
-
-
Loans sold from portfolio
-
-
-
-
-
Loan paydowns/payoffs
(36)
(27)
(33)
(39)
(24)
Transfers to OREO/other repossessed property
(18)
(17)
(21)
(28)
(20)
Charge-offs
(47)
(46)
(30)
(13)
(30)
Draws/other extensions of credit
1
1
(1)
1
1
332
312
286
248
293
Total NPL
1,029
951
909
769
751
Total new nonaccrual loans -
HFI
214
204
267
166
272
Beginning NPL amount
Ending Commercial NPL
Beginning NPL amount
Ending Consumer NPL
1
1
2 |
 13
©
Fifth Third Bank | All Rights Reserved
Mortgage repurchase overview
4Q13 balances of outstanding claims decreased 6% from 3Q13
Virtually all sold loans and the majority of new claims relate to
agencies
—
99% of outstanding balance of loans sold
—
89% of current quarter outstanding claims
Approximately 89% of outstanding balances of the serviced for
others portfolio relates to origination activity in 2009 and later
Private claims and exposure relate to whole loan sales (no
outstanding first mortgage securitizations)
—
Preponderance of private sales prior to 2006
2004-2008 vintages account for ~84% of total life to date losses
of $449MM from sold portfolio
$60MM decrease in repurchase reserves resulting from
previously announced settlement with Freddie Mac as well as
the corresponding expectations for future repurchase requests
and file claims.
Repurchase Reserves
1
($ in millions)
Outstanding Counterparty Claims ($ in millions)
4Q12
1Q13
2Q13
3Q13
4Q13
Beginning balance
$99
$131
$133
$139
$121
Net reserve additions
47
22
20
(4)
(27)
Repurchase losses
(15)
(20)
(14)
(13)
(33)
Ending balance
$131
$133
$139
$121
$61
1
Includes representation and warranty reserve ($44MM) and reserve for loans sold
with recourse ($16MM) Note: Numbers may not sum due to rounding.
Outstanding Balance of Sold Loans ($ in millions)
Fannie
Freddie
GNMA
Private
Total
2003 and Prior
$366
$1,590
$115
$122
$2,193
2004
151
586
22
92
851
2005
137
691
29
93
950
2006
182
537
25
150
895
8%
2007
269
888
33
126
1,316
2008
329
654
245
1,228
2009
858
4,174
2,179
1
7,211
2010
2,084
4,753
2,113
8,950
2011
2,744
5,101
1,721
9,566
2012
5,042
9,630
4,173
33
18,879
2013
3,932
7,376
5,553
259
17,120
Grand Total
16,095
35,979
16,208
877
69,159
1.3% |
 14
©
Fifth Third Bank | All Rights Reserved
Strong capital position
1
Non-GAAP measure; See Reg. G reconciliation in appendix.
2
Capital
ratios
estimated;
presented
under
current
U.S.
capital
regulations.
The
pro
forma
Basel
III
Tier
I
common
equity
ratio
is
management’s
estimate
based
upon
its
current
interpretation
of
recent
prospective
regulatory
capital
requirements
approved
in
July
2013.
Significant payouts to shareholders
$710MM common
stock repurchases
(net of $398MM
shares issued
related to Series G
conversion)
$407MM common
dividends declared
$212MM common
stock repurchases
utilizing AT Vantiv
gains
•
Continue to execute on capital plans in 4Q13
–
Issued $450MM of preferred stock, Series I
–
Redeemed $750MM of Fifth Third Capital Trust
IV TruPS
Tier 1 common equity
1
Common Shares Outstanding (MM)
and Tangible Book Value per share |
 15
©
Fifth Third Bank | All Rights Reserved
Balance Sheet:
Average loans & leases (excl. HFS)
Average transaction deposits
Income Statement:
Net interest income
2
Net interest margin
2
Noninterest income
1
Noninterest expense
Pre-provision net revenue
1,2
ROA
1
Effective tax rate
1
Asset Quality:
Net charge-offs
Loan loss allowance
4
Nonperforming assets
4
Tier 1 common equity
3,6
Category
Fifth Third: Outlook
2014 Outlook
1
$87.0B
$82.9B
1
2013 results exclude a net $534MM benefit from gains on Vantiv share issuance and
Vantiv warrants. 2014 outlook does not include potential but currently unforecasted items, such as any
potential additional Vantiv gains or losses, future capital actions, or changes in
regulatory or accounting guidance. 2
Presented on a fully-taxable equivalent basis.
3
Non-GAAP measure; see Reg. G reconciliation in appendix.
4
Ratio as a percent of loans excluding held-for-sale; allowance expectation
assumes current expectation for credit and economic trends and is subject to review in each period.
5
As a percentage of loans and leases
6
Current period capital ratios estimated. Tier 1 common equity ratio outlook assumes
generally stable common equity levels managed through asset growth and share repurchases.
Repurchases subject to ongoing evaluation under the Federal Reserve’s CCAR
process. 2013-Adjusted
1
Outlook as of January 23, 2014;
please see cautionary statement on slide 2 for risk factors related to
forward-looking statements Mid single digit growth
Mid single digit growth
Down ~$100MM (~0.40-0.45%
5
)
Lower vs. 4Q13
Down ~20%
vs. 4Q13
$3.58B
3.32% (3.21% 4Q13)
$2.70B
$3.95B
$2.31B
~1.2%
~28.4%
9.38%
$501MM (0.58%
5
)
$1.6B (1.79%)
$980MM (1.10%)
Consistent with 4Q13 |
 16
©
Fifth Third Bank | All Rights Reserved
Appendix |
 17
©
Fifth Third Bank | All Rights Reserved
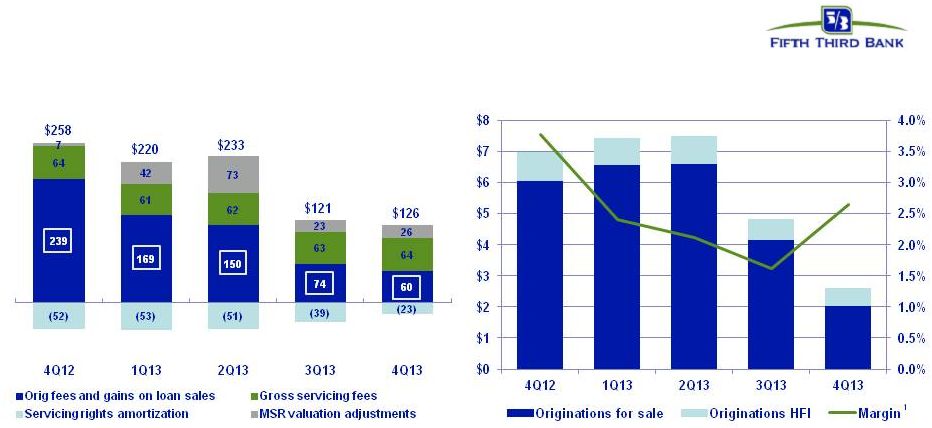
Mortgage banking results
•
4Q13 mortgage components:
–
MSR valuation adjustments of positive $26 million partially offset by lower gains on
sale –
Gain on sale margins improved
•
Expect stronger mortgage servicing results as rates rise
•
Emphasis on purchase business continues to shift volumes
–
51% purchase volume in 4Q13 vs. 43% 3Q13
Mortgage originations ($B) and gain-on-sale
margin1 Mortgage Banking Net Revenue ($MM)
Note: Numbers may not sum due to rounding.
1
Gain-on-sale margin represents gains on all loans originated for
sale. |
 18
©
Fifth Third Bank | All Rights Reserved
Total
Funded
Total
Funded
Total
Funded
Total
Funded
(amounts in $MMs)
exposure
exposure
exposure
exposure
exposure
exposure
exposure
exposure
Peripheral Europe
-
-
10
-
202
103
212
103
Other Eurozone
-
-
56
14
2,031
1,161
2,087
1,175
Total Eurozone
-
-
66
14
2,233
1,264
2,299
1,278
Other Europe
-
-
83
23
889
500
972
523
Total Europe
-
-
149
37
3,122
1,764
3,271
1,801
Sovereigns
Financial Institutions
Non-Financial Entities
Total
European Exposure
Total exposure includes funded and unfunded commitments, net of collateral; funded
exposure excludes unfunded exposure Peripheral Europe includes Greece,
Ireland, Italy, Portugal and Spain Eurozone includes countries participating
in the European common currency (Euro)
Other Europe includes European countries not part of the Euro (primarily the United
Kingdom and Switzerland) Data above includes exposure to U.S. subsidiaries of
Europe-domiciled companies •
International exposure primarily related to trade finance and financing activities of
U.S. companies with foreign parent or overseas activities of U.S.
customers •
No European sovereign exposure (total international sovereign exposure $7MM)
•
Total exposure to European financial institutions <$150MM
•
Total exposure to five peripheral Europe countries ~$200MM
•
~$1.3B in funded exposure to Eurozone-related companies (~1% of total loan
portfolio) |
 19
©
Fifth Third Bank | All Rights Reserved
Available and contingent borrowing capacity
(4Q13):
–
FHLB ~$12B available, ~$13B total
–
Federal Reserve ~$28B
Holding Company cash at 12/31/13: $2.1B
Cash currently sufficient to satisfy all fixed
obligations in a stressed environment for over
2 years (debt maturities, common and
preferred dividends, interest and other
expenses) without accessing capital markets;
relying on dividends from subsidiaries or any
other discretionary actions
Holding company unsecured debt maturities ($MM)
Bank unsecured debt maturities ($MM –
excl. Brokered CDs)
Heavily core funded
Strong liquidity profile
Demand
25%
Interest
checking
20%
Savings/
MMDA
22%
Consumer
time
3%
Foreign
Office
2%
Non-Core
Deposits
5%
S-T
borrowings
1%
Other
liabilities
4%
Equity
11%
L-T debt
7%
S-T
wholesale
6%
$1,250
$500
$500
$2,312
2014
2015
2016
2017
2018
2019
2020 on
Fifth Third Bancorp
Fifth Third Capital Trust (Bancorp) |
 20
©
Fifth Third Bank | All Rights Reserved
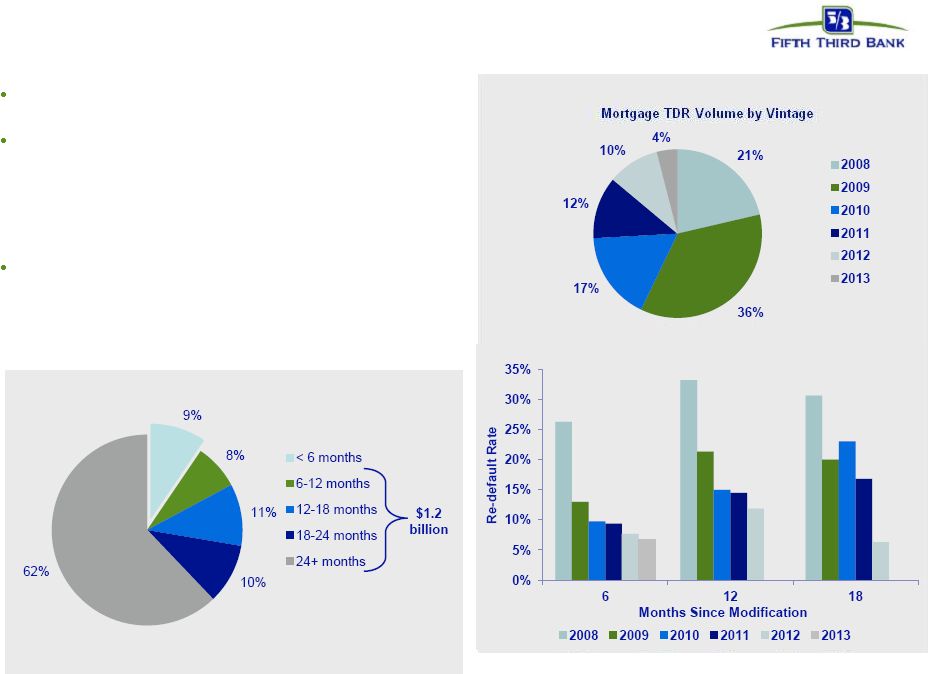
Troubled debt restructurings overview
Successive improvement in vintage performance during
2008 and 2009 as volume of modification increased
Of $1.8B in consumer TDRs, $1.7B were on accrual
status and $136MM were nonaccruals
—
$1.2B of TDRs are current and have been on the
books 6 or more months; within that, ~$1.1B of
TDRs are current and have been on the books for
more than a year
As current TDRs season, their default propensity
declines significantly
—
We see much lower defaults on current loans after
a vintage approaches 12 months since
modification
Source: Fifth Third and OCC/OTS data through 2Q13
$1.3B current consumer TDRs (%)
1
Fifth
Third
data
includes
changes
made
to
align
with
OCC/OTS
methodology
(i.e.
excludes
government
loans,
closed
loans
and
OREO
from
calculations)
TDR performance has improved in newer vintages
Mortgage TDRs that are past due 60 days or more trend by vintage
1 |
 21
©
Fifth Third Bank | All Rights Reserved
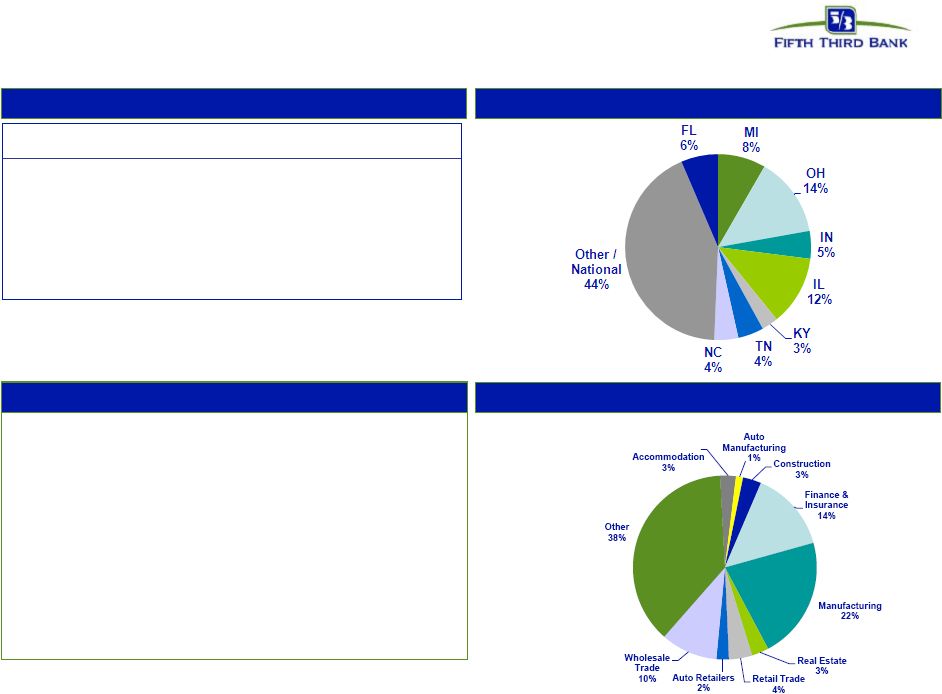
Commercial & industrial
Loans by geography
Credit trends
Loans by industry
Comments
•
Commercial & industrial loans represented 44% of total loans and
45% of net charge-offs
–
4Q13 NCOs included a $43 million charge-off on a single
restructured credit
* Excludes loans held-for-sale.
($ in millions)
4Q12
1Q13
2Q13
3Q13
4Q13
EOP Balance*
$36,038
$36,757
$37,856
$38,253
$39,316
Avg Loans*
$34,301
$36,395
$37,630
$38,133
$38,835
90+ days delinquent
$1
$1
-
$3
-
as % of loans
NM
NM
NM
0.01%
NM
NPAs*
$352
$332
$361
$321
$290
as % of loans
0.98%
0.90%
0.95%
0.84%
0.74%
Net charge-offs
$36
$25
$33
$44
$66
as % of loans
0.42%
0.28%
0.35%
0.46%
0.67%
C&I |
   22
©
Fifth Third Bank | All Rights Reserved
Commercial mortgage
Loans by geography
Credit trends
Loans by industry
Comments
•
Commercial mortgage loans represented 9% of total loans and
5% of net charge-offs
•
Owner occupied 4Q13 NCO ratio of 0.4%, non-owner occupied
4Q13 NCO ratio of 0.3%
•
Loans from FL/MI represented 36% of portfolio loans, 93% of
portfolio losses in 4Q13
* Excludes loans held-for-sale.
($ in millions)
4Q12
1Q13
2Q13
3Q13
4Q13
EOP Balance*
$9,103
$8,766
$8,443
$8,052
$8,066
Avg Loans*
$9,193
$8,965
$8,618
$8,273
$8,047
90+ days delinquent
$22
-
-
-
-
as % of loans
0.24%
NM
NM
NM
NM
NPAs*
$434
$409
$355
$296
$252
as % of loans
4.69%
4.59%
4.15%
3.62%
3.09%
Net charge-offs
$17
$26
$10
$2
$8
as % of loans
0.70%
1.18%
0.50%
0.14%
0.40%
Commercial mortgage |
  23
©
Fifth Third Bank | All Rights Reserved
Commercial construction
Loans by geography
Credit trends
Loans by industry
Comments
•
Commercial construction loans represented 1% of total loans
and 3% of net charge-offs
•
Loans from FL/MI represented 17% of portfolio loans
* Excludes loans held-for-sale.
($ in millions)
4Q12
1Q13
2Q13
3Q13
4Q13
EOP Balance*
$698
$694
$754
$875
$1,039
Avg Loans*
$686
$695
$713
$793
$952
90+ days delinquent
$1
-
-
-
-
as % of loans
0.14%
NM
NM
NM
NM
NPAs*
$88
$78
$69
$62
$59
as % of loans
12.37%
11.12%
8.88%
6.86%
5.53%
Net charge-offs
$4
$3
-
($2)
$4
as % of loans
1.91%
1.44%
(0.04%)
(1.16%)
1.65%
Commercial construction |
  24
©
Fifth Third Bank | All Rights Reserved
Homebuilders/developers
(included in previous slides)
Loans by geography
Credit trends
Loans by industry
Comments
•
Originations of builder/developer loans suspended in 2007
•
Remaining portfolio balance of $194MM, down 94% from peak of
$3.3B in 2Q08; represents <1% of total loans and <1% of commercial
loans
•
$47MM of NPAs (71% commercial mortgage, 16% commercial
construction, 13% C&I)
* Excludes loans held-for-sale.
($ in millions)
4Q12
1Q13
2Q13
3Q13
4Q13
EOP Balance*
$318
$309
$285
$226
$194
90+ days delinquent
-
-
-
-
-
as % of loans
NM
NM
NM
NM
NM
NPAs*
$88
$79
$63
$53
$47
as % of loans
24.19%
22.44%
22.00%
20.85%
20.72%
Net charge-offs
-
$1
($1)
($1)
$4
as % of loans
0.28%
1.57%
(0.84%)
(0.96%)
7.40%
Homebuilders/developers |
  25
©
Fifth Third Bank | All Rights Reserved
Residential mortgage
1
st
liens: 100%; weighted average LTV: 72.7%
Weighted average origination FICO: 753
Origination FICO distribution: <660 6%; 660-689 5%; 690-719 9%;
720-749 14%; 750+ 57%; Other^ 9%
(note: loans <660 includes CRA loans and FHA/VA loans)
Origination LTV distribution: <=70 39%; 70.1-80 36%; 80.1-90 7%;
90.1-95 4%; >95 14%
Vintage distribution: 2013: 22%; 2012 24%; 2011 15%; 2010 8%;
2009 4%; 2008 4%; 2007 4%; 2006 4%; 2005 7%; 2004 and prior
8%
15% originated through 3rd
party; performance similar to direct
Loans by geography
Credit trends
Portfolio details
Comments
^ Includes acquired loans where FICO at origination is not available
* Excludes loans held-for-sale
•
Residential mortgage loans represented 14% of total loans and 8%
of
net charge-offs
•
FL portfolio 13% of residential mortgage loans and 16% of portfolio
losses; MI portfolio 15% of residential mortgage loans and 18% of
portfolio losses
($ in millions)
4Q12
1Q13
2Q13
3Q13
4Q13
EOP Balance*
$12,017
$12,091
$12,400
$12,534
$12,680
Avg Loans*
$11,846
$12,096
$12,260
$12,486
$12,609
90+ days delinquent
$75
$74
$71
$73
$66
as % of loans
0.62%
0.61%
0.57%
0.58%
0.52%
NPAs*
$290
$275
$255
$229
$222
as % of loans
2.41%
2.27%
2.06%
1.83%
1.75%
Net charge-offs
$23
$20
$15
$12
$13
as % of loans
0.77%
0.69%
0.48%
0.39%
0.39%
Residential mortgage |
 26
©
Fifth Third Bank | All Rights Reserved
Home equity loans represented 10% of total loans and 17% of net
charge-offs
–
4Q13 included $6 million of additional charge-offs and $46 million
of additional NPAs due to a change in policy on home equity
nonaccruals
Approximately 13% of portfolio in broker product generated 31% total
loss
Approximately one third of Fifth Third 2
nd
liens are behind Fifth Third
1
st
liens
2005/2006 vintages represent approximately 25% of portfolio; account
for 45% of losses
Home equity
1
st
liens: 34%; 2nd liens: 66%
Weighted average origination FICO: 751
Origination FICO distribution^: <660 3%; 660-689 7%; 690-719 12%;
720-749 16%; 750+ 53%; Other 9%
Average CLTV: 73%; Origination CLTV distribution: <=70 40%; 70.1-
80 23%; 80.1-90 19%; 90.1-95 6%; >95 12%
Vintage distribution: 2013: 7%; 2012 5%; 2011 3%; 2010 3%; 2009
3%; 2008 9%; 2007 10%; 2006 13%; 2005 12%; 2004 and prior 35%
% through broker channels: 13% WA FICO: 734 brokered, 754 direct;
WA CLTV: 88% brokered; 71% direct
Portfolio details
Comments
Brokered loans by geography
Direct loans by geography
Credit trends
Note: Brokered and direct home equity net charge-off ratios are calculated
based on end of period loan balances ^ Includes acquired loans where FICO at
origination is not available * Excludes loans held-for-sale
($ in millions)
4Q12
1Q13
2Q13
3Q13
4Q13
EOP Balance*
$1,366
$1,321
$1,275
$1,231
$1,190
90+ days delinquent
$14
$13
$11
$11
-
as % of loans
1.05%
1.02%
0.89%
0.88%
NM
Net charge-offs
$12
$10
$7
$6
$8
as % of loans
3.48%
3.08%
2.30%
1.91%
2.75%
Home equity - brokered
($ in millions)
4Q12
1Q13
2Q13
3Q13
4Q13
EOP Balance*
$8,652
$8,406
$8,256
$8,125
$8,056
90+ days delinquent
$44
$40
$37
$35
-
as % of loans
0.50%
0.47%
0.44%
0.43%
NM
Net charge-offs
$22
$20
$16
$13
$18
as % of loans
1.01%
0.93%
0.76%
0.64%
0.87%
Home equity - direct |
 27
©
Fifth Third Bank | All Rights Reserved
Regulation G Non-GAAP reconciliation
Fifth Third Bancorp and Subsidiaries
Regulation G Non-GAAP Reconcilation
$ and shares in millions
(unaudited)
December
September
June
March
December
2013
2013
2013
2013
2012
Income before income taxes (U.S. GAAP)
$561
$604
$841
$591
$540
Add:
Provision expense (U.S. GAAP)
53
51
64
62
76
Pre-provision net revenue (a)
614
655
905
653
616
Net income available to common shareholders (U.S. GAAP)
383
421
582
413
390
Add:
Intangible amortization, net of tax
1
1
1
1
2
Tangible net
income available to common shareholders 384
422
583
414
392
Tangible net income available to common
shareholders (annualized) (b) 1,523
1,674
2,338
1,679
1,559
Average Bancorp shareholders' equity (U.S. GAAP)
14,757
14,440
14,221
13,779
13,855
Less:
Average preferred stock
(703)
(593)
(717)
(398)
(398)
Average goodwill
(2,416)
(2,416)
(2,416)
(2,416)
(2,417)
Average intangible assets
(20)
(22)
(24)
(26)
(28)
Average tangible common equity
(c) 11,618
11,409
11,064
10,939
11,012
Total Bancorp shareholders' equity (U.S. GAAP)
14,589
14,641
14,239
13,882
13,716
Less:
Preferred stock
(1,034)
(593)
(991)
(398)
(398)
Goodwill
(2,416)
(2,416)
(2,416)
(2,416)
(2,416)
Intangible assets
(19)
(21)
(23)
(25)
(27)
Tangible common equity, including
unrealized gains / losses (d) 11,120
11,611
10,809
11,043
10,875
Less: Accumulated other comprehensive income
(82)
(218)
(149)
(333)
(375)
Tangible common equity, excluding unrealized gains /
losses (e) 11,038
11,393
10,660
10,710
10,500
Total assets (U.S. GAAP)
130,443
125,673
123,360
121,382
121,894
Less:
Goodwill
(2,416)
(2,416)
(2,416)
(2,416)
(2,416)
Intangible assets
(19)
(21)
(23)
(25)
(27)
Tangible assets, including
unrealized gains / losses (f) 128,008
123,236
120,921
118,941
119,451
Less: Accumulated other comprehensive income / loss, before tax
(126)
(335)
(229)
(512)
(577)
Tangible assets, excluding unrealized gains / losses
(g) 127,882
122,901
120,692
118,429
118,874
Common shares outstanding (h)
855
887
851
875
882
Ratios:
Return on average tangible common equity (b) / (c)
13.1%
14.7%
21.1%
15.4%
14.1%
Tangible common equity (excluding unrealized gains/losses) (e) / (g)
8.63%
9.27%
8.83%
9.03%
8.83%
Tangible common equity (including unrealized gains/losses) (d) / (f)
8.69%
9.42%
8.94%
9.28%
9.10%
Tangible book value per share (d) / (h)
13.00
13.09
12.69
12.62
12.33
For the Three Months Ended |
 28
©
Fifth Third Bank | All Rights Reserved
Regulation G Non-GAAP reconciliation
Fifth Third Bancorp and Subsidiaries
Regulation G Non-GAAP Reconcilation
$ and shares in millions
(unaudited)
December
September
June
March
December
2013
2013
2013
2013
2012
Total Bancorp shareholders' equity (U.S. GAAP)
$14,589
$14,641
$14,239
$13,882
$13,716
Goodwill and certain other intangibles
(2,492)
(2,492)
(2,496)
(2,504)
(2,499)
Unrealized gains
(82)
(218)
(149)
(333)
(375)
Qualifying trust preferred securities
60
810
810
810
810
Other
19
21
22
23
33
Tier I capital
12,094
12,762
12,426
11,878
11,685
Less:
Preferred stock
(1,034)
(593)
(991)
(398)
(398)
Qualifying trust preferred securities
(60)
(810)
(810)
(810)
(810)
Qualifying noncontrolling interest in consolidated
subsidiaries (37)
(39)
(38)
(38)
(48)
Tier I common equity (a)
10,963
11,320
10,587
10,632
10,429
Risk-weighted assets, determined in accordance with
prescribed regulatory requirements (b)
116,836
114,544
112,285
109,626
109,699
Ratio:
Tier I common equity (a) / (b)
9.38%
9.88%
9.43%
9.70%
9.51%
Basel III - Estimated Tier 1 common equity ratio
December
September
2013
2013
Tier 1 common equity (Basel I)
$10,963
$11,320
Add:
Adjustment related to capital components
$82
$88
Estimated Tier 1 common equity under final Basel III rules without AOCI (opt out)(c)
$11,045
$11,408
Add:
Adjustment related to AOCI
$82
$218
Estimated Tier 1 common equity under final Basel III rules with AOCI (non opt out)(d)
$11,127
$11,626
Estimated risk-weighted assets under final Basel III rules (e)
122,602
120,447
Estimated Tier 1 common equity ratio under final Basel III rules (opt out) (c) /
(e) 9.01%
9.47%
Estimated Tier 1 common equity ratio under final Basel III rules (non opt out) (d) / (e)
9.08%
9.65%
(c), (d)
(e)
Under the final Basel III rules, non-advanced approach banks are permitted to make a one-time
election to opt out of the requirement to include AOCI in Tier 1 common equity. Other adjustments
include mortgage servicing rights and deferred tax assets subject to threshold limitations and
deferred tax liabilities related to intangible assets. Key differences under Basel III in the
calculation of risk-weighted assets compared to Basel I include: (1) Risk weighting for commitments under 1 year; (2) Higher risk weighting for exposures to
securitizations, past due loans, foreign banks and certain commercial real estate; (3) Higher risk
weighting for mortgage servicing rights and deferred tax assets that are under certain thresholds as
a percent of Tier 1 capial; and (4) Derivatives are differentiated between exchange clearing and
over-the-counter and the 50% risk-weight cap is removed. For the Three Months
Ended |
 29
©
Fifth Third Bank | All Rights Reserved
Regulation G Non-GAAP reconciliation
Fifth Third Bancorp and Subsidiaries
Regulation G Non-GAAP Reconcilation
$ and shares in millions
(unaudited)
2013
2012
2011
2010
2009
Total Bancorp shareholders' equity (U.S. GAAP)
$14,589
$13,716
$13,201
$14,051
$13,497
Goodwill and certain other intangibles
(2,492)
(2,499)
(2,514)
(2,546)
(2,565)
Unrealized gains
(82)
(375)
(470)
(314)
(241)
Qualifying trust preferred securities
60
810
2,248
2,763
2,763
Other
19
33
38
11
(26)
Tier I capital
12,094
11,685
12,503
13,965
13,428
Less:
Preferred stock
(1,034)
(398)
(398)
(3,654)
(3,609)
Qualifying trust preferred securities
(60)
(810)
(2,248)
(2,763)
(2,763)
Qualifying noncontrolling interest in consolidated subsidiaries
(37)
(48)
(50)
(30)
-
Tier I common equity (a)
10,963
10,429
9,807
7,518
7,056
Risk-weighted assets, determined in accordance with
prescribed regulatory requirements (b)
116,836
109,699
104,945
100,561
100,933
Ratio:
Tier I common equity (a) / (b)
9.38%
9.51%
9.35%
7.48%
6.99%
For the Year Ended |