Attached files
| file | filename |
|---|---|
| 8-K - 8-K - AVAYA INC | form8-k1x23x2014.htm |

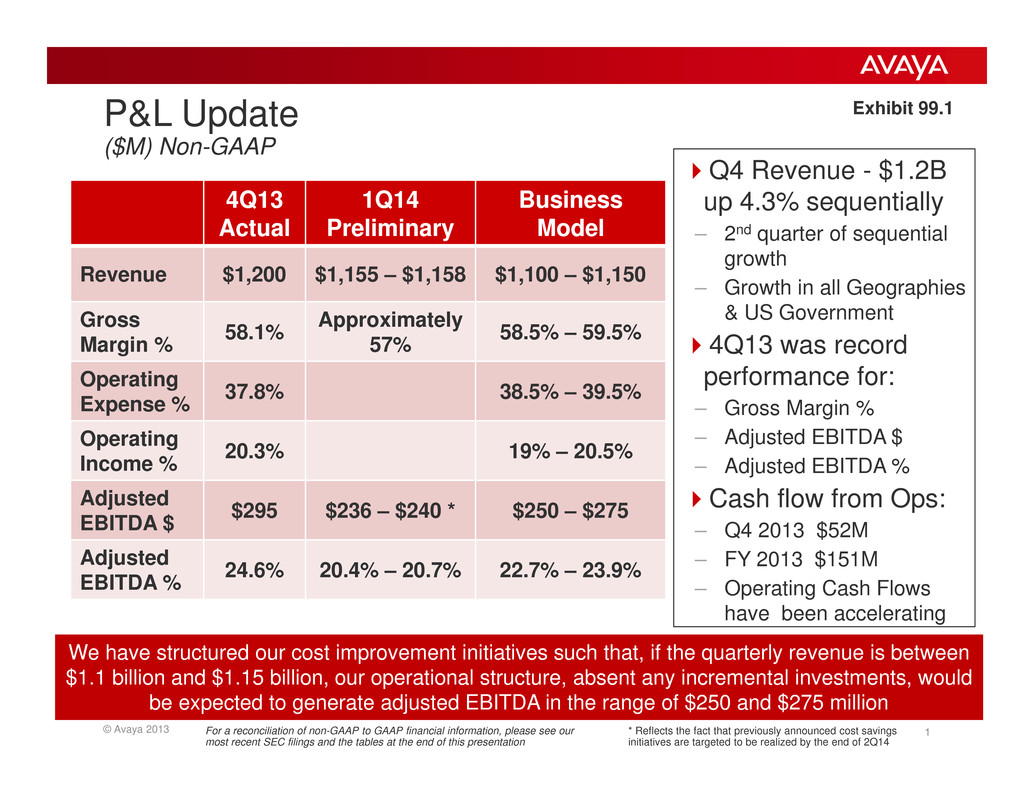
© Avaya 2013 1 P&L Update ($M) Non-GAAP 4Q13 Actual 1Q14 Preliminary Business Model Revenue $1,200 $1,155 – $1,158 $1,100 – $1,150 Gross Margin % 58.1% Approximately 57% 58.5% – 59.5% Operating Expense % 37.8% 38.5% – 39.5% Operating Income % 20.3% 19% – 20.5% Adjusted EBITDA $ $295 $236 – $240 * $250 – $275 Adjusted EBITDA % 24.6% 20.4% – 20.7% 22.7% – 23.9% Q4 Revenue - $1.2B up 4.3% sequentially – 2nd quarter of sequential growth – Growth in all Geographies & US Government 4Q13 was record performance for: – Gross Margin % – Adjusted EBITDA $ – Adjusted EBITDA % Cash flow from Ops: – Q4 2013 $52M – FY 2013 $151M – Operating Cash Flows have been accelerating We have structured our cost improvement initiatives such that, if the quarterly revenue is between $1.1 billion and $1.15 billion, our operational structure, absent any incremental investments, would be expected to generate adjusted EBITDA in the range of $250 and $275 million For a reconciliation of non-GAAP to GAAP financial information, please see our most recent SEC filings and the tables at the end of this presentation * Reflects the fact that previously announced cost savings initiatives are targeted to be realized by the end of 2Q14 Exhibit 99.1

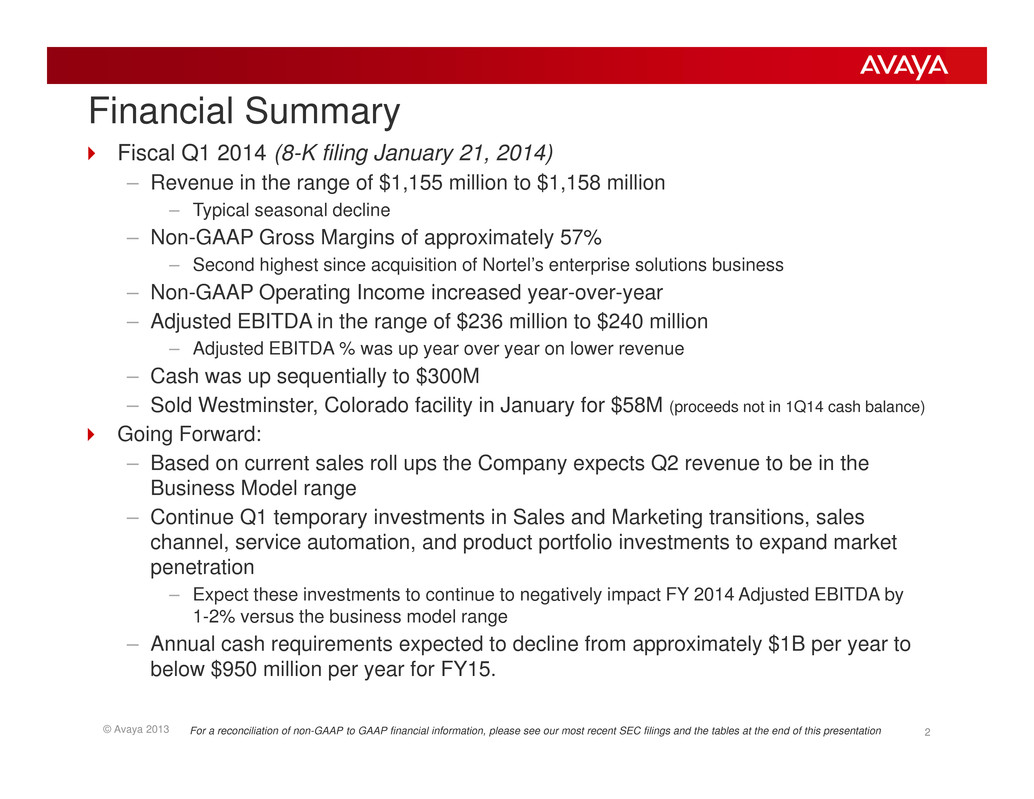
© Avaya 2013 2 Financial Summary Fiscal Q1 2014 (8-K filing January 21, 2014) – Revenue in the range of $1,155 million to $1,158 million – Typical seasonal decline – Non-GAAP Gross Margins of approximately 57% – Second highest since acquisition of Nortel’s enterprise solutions business – Non-GAAP Operating Income increased year-over-year – Adjusted EBITDA in the range of $236 million to $240 million – Adjusted EBITDA % was up year over year on lower revenue – Cash was up sequentially to $300M – Sold Westminster, Colorado facility in January for $58M (proceeds not in 1Q14 cash balance) Going Forward: – Based on current sales roll ups the Company expects Q2 revenue to be in the Business Model range – Continue Q1 temporary investments in Sales and Marketing transitions, sales channel, service automation, and product portfolio investments to expand market penetration – Expect these investments to continue to negatively impact FY 2014 Adjusted EBITDA by 1-2% versus the business model range – Annual cash requirements expected to decline from approximately $1B per year to below $950 million per year for FY15. For a reconciliation of non-GAAP to GAAP financial information, please see our most recent SEC filings and the tables at the end of this presentation
