Attached files
| file | filename |
|---|---|
| 8-K - FORM 8-K - WESTERN DIGITAL CORP | d660078d8k.htm |
| EX-99.1 - EX-99.1 - WESTERN DIGITAL CORP | d660078dex991.htm |
Exhibit 99.2
FY14Cash and Cash Equivalents $2,826 $2,734 $2,858 $3,110 $3,230 $3,490 $3,675 $3,924 $3,377 $3,208 $3,537 $3,816 $4,060 $4,309 $4,869 $4,655 Debt 425 400 375 350 325 294 263 231 2,743 2,185 2,128 2,128 2,013 1,955 2,398 2,340 Net Cash and Cash Equivalents $2,401 $2,334 $2,483 $2,760 $2,905 $3,196 $3,412 $3,693 $634 $1,023 $1,409 $1,688 $2,047 $2,354 $2,471 $2,315 Cash Flow From Operations $588 $363 $390 $505 $313 $447 $352 $378 $1,208 $1,128 $936 $772 $727 $684 $680 $727 Free Cash Flow $411 $178 $190 $255 $138 $294 $218 $258 $1,069 $804 $554 $526 $539 $548 $544 $557 Capital Expenditures $177 $185 $200 $250 $175 $153 $134 $120 $139 $324 $382 $246 $188 $136 $136 $170 Depreciation and Amortization $128 $134 $150 $151 $151 $150 $158 $140 $188 $339 $313 $309 $309 $302 $312 $317 EBITDA $569 $427 $361 $391 $309 $322 $417 $302 $730 $1,147 $905 $787 $726 $81 $854 $795 Accounts Receivable, Net $1,257 $1,256 $1,325 $1,250 $1,171 $1,206 $1,356 $747 $2,377 $2,364 $1,951 $1,732 $1,700 $1,793 $1,791 $1,959 Inventory Raw Materials $115 $159 $155 $141 $151 $172 $170 $191 $329 $245 $237 $193 $191 $167 $208 $201 Work in Process 254 255 266 274 260 263 275 185 667 552 559 581 583 575 579 581 Finished Goods 138 146 140 153 163 142 200 90 286 413 508 430 423 446 457 511 Total Inventory $507 $560 $561 $568 $574 $577 $645 $466 $1,282 $1,210 $1,304 $1,204 $1,197 $1,188 $1,244 $1,293 Property, Plant and Equipment, Net $1,756 $2,159 $2,245 $2,277 $2,249 $2,224 $2,209 $2,091 $4,171 $4,067 $4,027 $3,938 $3,803 $3,700 $3,638 $3,509 Accounts Payable $1,508 $1,507 $1,703 $1,628 $1,486 $1,545 $1,708 $883 $2,774 $2,773 $2,545 $2,185 $2,037 $1,990 $2,061 $2,106 Days Sales Outstanding 43 48 50 46 47 46 46 34 71 45 44 41 41 44 43 45 Days Inventory Outstanding 23 28 26 26 28 27 27 31 57 34 42 40 40 40 42 42 Days Payables Outstanding 69 74 79 74 73 73 72 60 123 77 82 72 69 67 69 68 Cash Conversion Cycle (3) 2 (3) (2) 2 - 1 5 5 2 4 9 12 17 16 19 Inventory Turns 16 13 14 14 13 13 13 12 6 11 9 9 9 9 9 9 Dividends Paid $ - $ - $ - $ - $ - $ - $ - $ - $ - $ - $ - $121 $ - $60 $59 $59 Shares Repurchased - - 1.8 16.4 5.2 4.2 5.2 4.4 2.3 2.0 Shares Repurchased $ - $ - $50 $ - $ - $ - $ - $ - $ - $604 $218 $146 $243 $235 $150 $150 Remaining Amount Authorized $466 $466 $416 $416 $416 $416 $416 $416 $416 $1,312 $2,594 $2,448 $2,205 $1,970 $1,820 $1,670 R4Q Economic Profit8 $786 $826 $714 $484 $213 $92 $113 $15 $(83) $542 $801 $976 $884 $(59) $(176) $(109) R4Q ROIC8 31.2% 30.2% 26.4% 21.1% 15.6% 13.2% 13.6% 11.9% 14.8% 20.4% 21.3% 21.0% 20.0% 10.1% 9.7% 10.5% R4Q ROA8 21.2% 20.7% 18.1% 14.6% 10.9% 9.2% 9.5% 8.5% 10.5% 14.3% 14.9% 14.7% 14.2% 7.0% 6.7% 7.2% Worldwide Headcount3 61,803 62,500 62,817 62,991 61,349 65,431 67,799 67,121 106,604 103,111 96,002 93,820 87,565 85,777 87,586 87,976
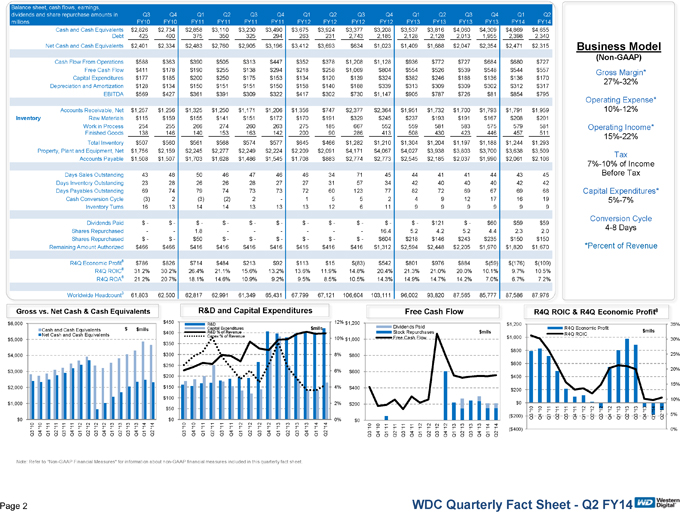
No Spacing;Cash and Cash Equivalents $2,826 $2,734 $2,858 $3,110 $3,230 $3,490 $3,675 $3,924 $3,377 $3,208 $3,537 $3,816 $4,060 $4,309 $4,869 $4,655 Debt 425 400 375 350 325 294 263 231 2,743 2,185 2,128 2,128 2,013 1,955 2,398 2,340 Net Cash and Cash Equivalents $2,401 $2,334 $2,483 $2,760 $2,905 $3,196 $3,412 $3,693 $634 $1,023 $1,409 $1,688 $2,047 $2,354 $2,471 $2,315 Cash Flow From Operations $588 $363 $390 $505 $313 $447 $352 $378 $1,208 $1,128 $936 $772 $727 $684 $680 $727 Free Cash Flow $411 $178 $190 $255 $138 $294 $218 $258 $1,069 $804 $554 $526 $539 $548 $544 $557 Capital Expenditures $177 $185 $200 $250 $175 $153 $134 $120 $139 $324 $382 $246 $188 $136 $136 $170 Depreciation and Amortization $128 $134 $150 $151 $151 $150 $158 $140 $188 $339 $313 $309 $309 $302 $312 $317 EBITDA $569 $427 $361 $391 $309 $322 $417 $302 $730 $1,147 $905 $787 $726 $81 $854 $795 Accounts Receivable, Net $1,257 $1,256 $1,325 $1,250 $1,171 $1,206 $1,356 $747 $2,377 $2,364 $1,951 $1,732 $1,700 $1,793 $1,791 $1,959 Inventory Raw Materials $115 $159 $155 $141 $151 $172 $170 $191 $329 $245 $237 $193 $191 $167 $208 $201 Work in Process 254 255 266 274 260 263 275 185 667 552 559 581 583 575 579 581 Finished Goods 138 146 140 153 163 142 200 90 286 413 508 430 423 446 457 511 Total Inventory $507 $560 $561 $568 $574 $577 $645 $466 $1,282 $1,210 $1,304 $1,204 $1,197 $1,188 $1,244 $1,293 Property, Plant and Equipment, Net $1,756 $2,159 $2,245 $2,277 $2,249 $2,224 $2,209 $2,091 $4,171 $4,067 $4,027 $3,938 $3,803 $3,700 $3,638 $3,509 Accounts Payable $1,508 $1,507 $1,703 $1,628 $1,486 $1,545 $1,708 $883 $2,774 $2,773 $2,545 $2,185 $2,037 $1,990 $2,061 $2,106 Days Sales Outstanding 43 48 50 46 47 46 46 34 71 45 44 41 41 44 43 45 Days Inventory Outstanding 23 28 26 26 28 27 27 31 57 34 42 40 40 40 42 42 Days Payables Outstanding 69 74 79 74 73 73 72 60 123 77 82 72 69 67 69 68 Cash Conversion Cycle (3) 2 (3) (2) 2 - 1 5 5 2 4 9 12 17 16 19 Inventory Turns 16 13 14 14 13 13 13 12 6 11 9 9 9 9 9 9 Dividends Paid $ - $ - $ - $ - $ - $ - $ - $ - $ - $ - $ - $121 $ - $60 $59 $59 Shares Repurchased - - 1.8 16.4 5.2 4.2 5.2 4.4 2.3 2.0 Shares Repurchased $ - $ - $50 $ - $ - $ - $ - $ - $ - $604 $218 $146 $243 $235 $150 $150 Remaining Amount Authorized $466 $466 $416 $416 $416 $416 $416 $416 $416 $1,312 $2,594 $2,448 $2,205 $1,970 $1,820 $1,670 R4Q Economic Profit8 $786 $826 $714 $484 $213 $92 $113 $15 $(83) $542 $801 $976 $884 $(59) $(176) $(109) R4Q ROIC8 31.2% 30.2% 26.4% 21.1% 15.6% 13.2% 13.6% 11.9% 14.8% 20.4% 21.3% 21.0% 20.0% 10.1% 9.7% 10.5% R4Q8 21.2% 20.7% 18.1% 14.6% 10.9% 9.2% 9.5% 8.5% 10.5% 14.3% 14.9% 14.7% 14.2% 7.0% 6.7% 7.2% Worldwide Headcount3 61,803 62,500 62,817 62,991 61,349 65,431 67,799 67,121 106,604 103,111 96,002 93,820 87,565 85,777 87,586 87,976 Balance sheet, cash flows, earnings, dividends and share repurchase amounts in millions Q3 FY10 Q4 FY10 Q1 FY11 Q2 FY11 Q3 FY11 Q4 FY11 Q1 FY12 Q2 FY12 Q3 FY12 Q4 FY12 Q1 FY13 Q2 FY13 Q3 FY13 Q4 FY13 Q1 FY14 Q2 FY14 Cash and Cash Equivalents $2,826 $2,734 $2,858 $3,110 $3,230 $3,490 $3,675 $3,924 $3,377 $3,208 $3,537 $3,816 $4,060 $4,309 $4,869 $4,655 Debt 425 400 375 350 325 294 263 231 2,743 2,185 2,128 2,128 2,013 1,955 2,398 2,340 Net Cash and Cash Equivalents $2,401 $2,334 $2,483 $2,760 $2,905 $3,196 $3,412 $3,693 $634 $1,023 $1,409 $1,688 $2,047 $2,354 $2,471 $2,315 Cash Flow From Operations $588 $363 $390 $505 $313 $447 $352 $378 $1,208 $1,128 $936 $772 $727 $684 $680 $727 Free Cash Flow $411 $178 $190 $255 $138 $294 $218 $258 $1,069 $804 $554 $526 $539 $548 $544 $557 Capital Expenditures $177 $185 $200 $250 $175 $153 $134 $120 $139 $324 $382 $246 $188 $136 $136 $170 Depreciation and Amortization $128 $134 $150 $151 $151 $150 $158 $140 $188 $339 $313 $309 $309 $302 $312 $317 EBITDA $569 $427 $361 $391 $309 $322 $417 $302 $730 $1,147 $905 $787 $726 $81 $854 $795 Accounts Receivable, Net $1,257 $1,256 $1,325 $1,250 $1,171 $1,206 $1,356 $747 $2,377 $2,364 $1,951 $1,732 $1,700 $1,793 $1,791 $1,959 Inventory Raw Materials $115 $159 $155 $141 $151 $172 $170 $191 $329 $245 $237 $193 $191 $167 $208 $201 Work in Process 254 255 266 274 260 263 275 185 667 552 559 581 583 575 579 581 Finished Goods 138 146 140 153 163 142 200 90 286 413 508 430 423 446 457 511 Total Inventory $507 $560 $561 $568 $574 $577 $645 $466 $1,282 $1,210 $1,304 $1,204 $1,197 $1,188 $1,244 $1,293 Property, Plant and Equipment, Net $1,756 $2,159 $2,245 $2,277 $2,249 $2,224 $2,209 $2,091 $4,171 $4,067 $4,027 $3,938 $3,803 $3,700 $3,638 $3,509 Accounts Payable $1,508 $1,507 $1,703 $1,628 $1,486 $1,545 $1,708 $883 $2,774 $2,773 $2,545 $2,185 $2,037 $1,990 $2,061 $2,106 Days Sales Outstanding 43 48 50 46 47 46 46 34 71 45 44 41 41 44 43 45 Days Inventory Outstanding 23 28 26 26 28 27 27 31 57 34 42 40 40 40 42 42 Days Payables Outstanding 69 74 79 74 73 73 72 60 123 77 82 72 69 67 69 68 Cash Conversion Cycle (3) 2 (3) (2) 2 - 1 5 5 2 4 9 12 17 16 19 Inventory Turns 16 13 14 14 13 13 13 12 6 11 9 9 9 9 9 9 Dividends Paid $ - $ - $ - $ - $ - $ - $ - $ - $ - $ - $ - $121 $ - $60 $59 $59 Shares Repurchased - - 1.8 - 16.4 5.2 4.2 5.2 4.4 2.3 2.0 Shares Repurchased $ - $ - $50 $ - $ - $ - $ - $ - $ - $604 $218 $146 $243 $235 $150 $150 Remaining Amount Authorized $466 $466 $416 $416 $416 $416 $416 $416 $416 $1,312 $2,594 $2,448 $2,205 $1,970 $1,820 $1,670 R4Q Economic Profit8 $786 $826 $714 $484 $213 $92 $113 $15 $(83) $542 $801 $976 $884 $(59) 176) $(109) R4QROIC8 31.2% 30.2% 26.4% 21.1% 15.6% 13.2% 13.6% 11.9% 14.8% 20.4% 21.3% 21.0% 20.0% 10.1% 9.7% 10.5% R4Q ROA8 21.2% 20.7% 18.1% 14.6% 10.9% 9.2% 9.5% 8.5% 10.5% 14.3% 14.9% 14.7% 14.2% 7.0% 6.7% 7.2% Worldwide Headcount3 61,803 62,500 62,817 62,991 61,349 65,431 67,799 67,121 106,604 103,111 96,002 93,820 87,565 85,777 87,586 87,976
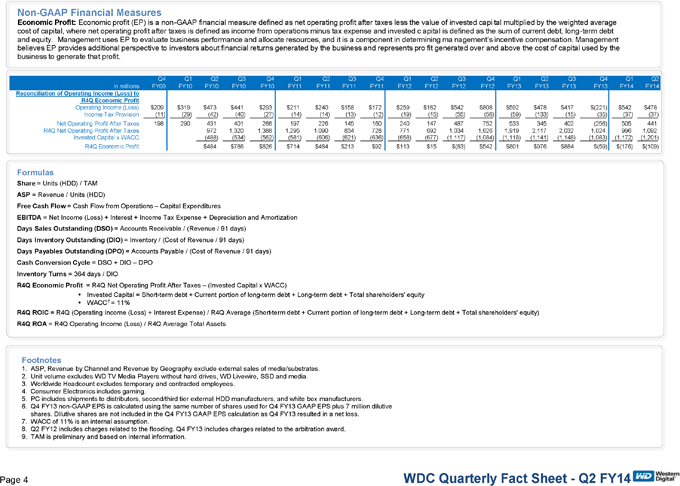
Y14 Reconciliation of Operating Income (Loss) to R4Q Economic Profit Operating Income (Loss) $209 $319 $473 $441 $293 $211 $240 $158 $172 $259 $162 $542 $808 $592 $478 $417 $(221) $542 $478 Income Tax Provision (11) (29) (42) (40) (27) (14) (14) (13) (12) (19) (15) (55) (56) (59) (133) (15) (35) (37) (37) Net Operating Profit After Taxes 198 290 431 401 266 197 226 145 160 240 147 487 752 533 345 402 (256) 505 441 R4Q Net Operating Profit After Taxes 972 1,320 1,388 1,295 1,090 834 728 771 692 1,034 1,626 1,919 2,117 2,032 1,024 996 1,092 Invested Capital x WACC (488) (534) (562) (581) (606) (621) (636) (658) (677) (1,117) (1,084) (1,118) (1,141) (1,148) (1,083) (1,172) (1,201) R4Q Economic Profit $484 $786 $826 $714 $484 $213 $92 $113 $15 $(83) $542 $801 $976 $884 $(59) $(176) $(109) Formulas Share = Units (HDD) / TAM ASP = Revenue / Units (HDD) Free Cash Flow = Cash Flow from Operations – Capital Expenditures EBITDA = Net Income (Loss) + Interest + Income Tax Expense + Depreciation and Amortization Days Sales Outstanding (DSO) = Accounts Receivable / (Revenue / 91 days) Days Inventory Outstanding (DIO) = Inventory / (Cost of Revenue / 91 days) Days Payables Outstanding (DPO) = Accounts Payable / (Cost of Revenue / 91 days) Cash Conversion Cycle = DSO + DIO – DPO Inventory Turns = 364 days / DIO R4Q Economic Profit = R4Q Net Operating Profit After Taxes – (Invested Capital x WACC)Ÿ Invested Capital = Short-term debt + Current portion of long-term debt + Long-term debt + Total shareholders’ equity Ÿ WACC7 = 11% R4Q ROIC = R4Q (Operating Income (Loss) + Interest Expense) / R4Q Average (Short-term debt + Current portion of long-term debt + Long-term debt + Total shareholders’ equity) R4Q ROA = R4Q Operating Income (Loss) / R4Q Average Total Assets Footnotes 1. ASP, Revenue by Channel and Revenue by Geography exclude external sales of media/substrates. 2. Unit volume excludes WD TV Media Players without hard drives, WD Livewire, SSD and media. 3. Worldwide Headcount excludes temporary and contracted employees. 4. Consumer Electronics includes gaming. 5. PC includes shipments to distributors, second/third tier external HDD manufacturers, and white box manufacturers. 6. Q4 FY13 non-GAAP EPS is calculated using the same number of shares used for Q4 FY13 GAAP EPS plus 7 million dilutive shares. Dilutive shares are not included in the Q4 FY13 GAAP EPS calculation as Q4 FY13 resulted in a net loss. 7. WACC of 11% is an internal assumption. 8. Q2 FY12 includes charges related to the flooding. Q4 FY13 includes charges related to the arbitration award. 9. TAM is preliminary and based on internal information.
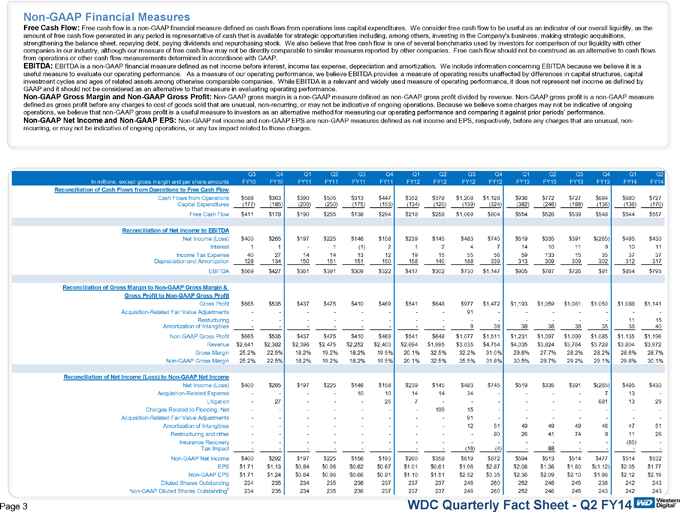
No Spacing;Reconciliation of Cash Flows from Operations to Free Cash Flow Cash Flows from Operations $588 $363 $390 $505 $313 $447 $352 $378 $1,208 $1,128 $936 $772 $727 $684 $680 $727 Capital Expenditures (177) (185) (200) (250) (175) (153) (134) (120) (139) (324) (382) (246) (188) (136) (136) (170) Free Cash Flow $411 $178 $190 $255 $138 $294 $218 $258 $1,069 $804 $554 $526 $539 $548 $544 $557 Reconciliation of Net Income to EBITDA Net Income (Loss) $400 $265 $197 $225 $146 $158 $239 $145 $483 $745 $519 $335 $391 $(265) $495 $430 Interest 1 1 1 (1) 2 1 2 4 7 14 10 11 9 10 11 Income Tax Expense 40 27 14 14 13 12 19 15 55 56 59 133 15 35 37 37 Depreciation and Amortization 128 134 150 151 151 150 158 140 188 339 313 309 309 302 312 317 EBITDA $569 $427 $361 $391 $309 $322 $417 $302 $730 $1,147 $905 $787 $726 $81 $854 $795 Reconciliation of Gross Margin to Non GAAP Gross Margin & Gross Profit to Non GAAP Gross Profit Gross Profit $665 $535 $437 $475 $410 $469 $541 $648 $977 $1,472 $1,193 $1,059 $1,061 $1,050 $1,088 $1,141 Acquisition Related Fair Value Adjustments 91 Restucturing 11 15 Amortization of Intangibles 9 39 38 38 38 35 36 40 Non GAAP Gross Profit $665 $535 $437 $475 $410 $469 $541 $648 $1,077 $1,511 $1,231 $1,097 $1,099 $1,085 $1,135 $1,196 Revenue $2,641 $2,382 $2,396 $2,475 $2,252 $2,403 $2,694 $1,995 $3,035 $4,754 $4,035 $3,824 $3,764 $3,728 $3,804 $3,972 Gross Margin 25.2% 22.5% 18.2% 19.2% 18.2% 19.5% 20.1% 32.5% 32.2% 31.0% 29.6% 27.7% 28.2% 28.2% 28.6% 28.7% Non GAAP Gross Margin 25.2% 22.5% 18.2% 19.2% 18.2% 19.5% 20.1% 32.5% 35.5% 31.8% 30.5% 28.7% 29.2% 29.1% 29.8% 30.1% Reconciliation of Net Income (Loss) to Non GAAP Net Income Net Income (Loss) $400 $265 $197 $225 $146 $158 $239 $145 $483 $745 $519 $335 $391 $(265) $495 $430 Acquisition Related Expense 10 10 14 14 34 7 13 Litigation 27 25 7 681 13 25 Charges Related to Flooding, Net 199 15 Acquisition Related Fair Value Adjustments 91 Amortization of Intangibles 12 51 49 49 49 46 47 51 Restructuring and other 80 26 41 74 8 11 26 Insurance Recovery (65) Tax Impact (16) (4) 88 Non GAAP Net Income $400 $292 $197 $225 $156 $193 $260 $358 $619 $872 $594 $513 $514 $477 $514 $532 EPS $1.71 $1.13 $0.84 $0.96 $0.62 $0.67 $1.01 $0.61 $1.96 $2.87 $2.06 $1.36 $1.60 $(1.12) $2.05 $1.77 Non GAAP EPS $1.71 $1.24 $0.84 $0.96 $0.66 $0.81 $1.10 $1.51 $2.52 $3.35 $2.36 $2.09 $2.10 $1.96 $2.12 $2.19 Diluted Shares Outstanding 234 235 234 235 236 237 237 237 246 260 252 246 245 236 242 243 Non GAAP Diluted Shares Outstanding6 234 235 234 235 236 237 237 237 246 260 252 246 245 243 242 243