Attached files
| file | filename |
|---|---|
| 8-K - 8-K - NAUTILUS, INC. | d654964d8k.htm |
 JANUARY 14, 2014
Orlando, Florida
ICR Xchange Conference
Exhibit 99.1 |
 Safe Harbor
Statement This presentation includes forward-looking statements (statements which
are not historical facts) within the meaning of the Private Securities Litigation
Reform Act of 1995, including statements concerning the Company's prospects, resources, capabilities, current or future financial trends
or operating results, demand for the Company‘s products, future plans for introduction
of new products and the anticipated outcome of new business initiatives, estimates of
market size and growth, planned capital expenditures and statements concerning our ability to finance growth plans with
cash generated from our operations. Factors that could cause Nautilus, Inc.'s actual results
to differ materially from these forward-looking statements include our ability to
acquire inventory from sole source foreign manufacturers at acceptable costs, within timely delivery schedules and
that meet our quality control standards, availability and price of media time consistent
with our cost and audience profile parameters, a decline in consumer spending due to
unfavorable economic conditions in one or more of our current or target markets, an adverse change in the availability of
credit for our customers who finance their purchases, our ability to pass along vendor raw
material price increases and increased shipping costs, our ability to effectively
develop, market and sell future products, our ability to protect our intellectual property, and the introduction of competing
products. Additional assumptions, risks and uncertainties are described in detail in our
registration statements, reports and other filings with the Securities and Exchange
Commission, including the "Risk Factors" set forth in our Annual Report on
Form 10-K, as supplemented by our quarterly reports on Form 10-Q. Such
filings are available on our website or at www.sec.gov. You are cautioned that such statements are not guarantees of
future performance and that actual results or developments may differ materially from those
set forth in the forward-looking statements. We undertake no obligation to
publicly update or revise forward-looking statements to reflect subsequent events or circumstances.
Unless otherwise indicated, all information regarding our operating results pertain to
continuing operations. ©
Nautilus, Inc. 2014
2 |
 Presentation Overview
•
Who We Are:
A team focused on providing
innovative fitness solutions and superior results
•
Business Strategies:
Strategic Innovation,
Operational Excellence, Footprint Expansion
•
Financial Overview:
Robust top and bottom line
growth; Strong Balance Sheet
3 |
 Who We
Are 4 |
 A Team That
Delivers Superior Results PRELIMINARY* UNAUDITED Q4 AND FULL YEAR 2013
RESULTS (CONTINUING
OPERATIONS) •
Q4 Revenues grew 18.5% over Q4 last year
Direct business -
3.7% growth
Retail business -
47.0% growth
•
Full Year 2013 Revenues grew 12.8% over 2012
Direct business -
9.3% growth
Retail business -
20.2% growth
•
Non-GAAP Q4 EPS is expected to be between $0.29 and $0.31 per share**
Versus $0.23 last year
•
Non-GAAP full year EPS is expected to be between $0.46 and $0.48 per
share†
Versus $0.34 last year
5
* All Q4 2013 and full year 2013 financial information is preliminary
and unaudited; see preliminary earnings release dated January 13, 2014. **
Excludes income tax expense resulting from partial reestablishment of a valuation allowance against the Company’s deferred tax assets.
†
Excludes partial reversal of a valuation allowance recorded against the Company’s
deferred tax assets. Non-GAAP Information, see Nautilus’ website under
“Investor Relations” for a reconciliation to GAAP.
|
 Who
We Are Today A
leading
provider
of
fitness
equipment
and
related
products
for
use
in,
and
around,
the
home
Industry leading capabilities in product innovation and quality
Growing company which has
dramatically improved profitability
Strong portfolio of
brands, including #1 in the fitness industry (Bowflex)*
Unique
three-pronged business model
An organization focused on increasing shareholder value
6
Our goal is to provide products which allow consumers to
achieve their health and fitness goals
* Based on 2012 National Consumer Research Study |
 Strongest
Brands in Fitness Equipment 7
* Based on 2012 National Consumer Research Study |
 Winning Product
Portfolio of Existing Heritage Products Cardio
Unique technologies and modalities have driven growth
Strength
TreadClimber®
SelectTech®
Home Gym
8
AD6 |
 Recent
Innovations Bowflex MAX Trainer™
Schwinn®
Cardio MY13
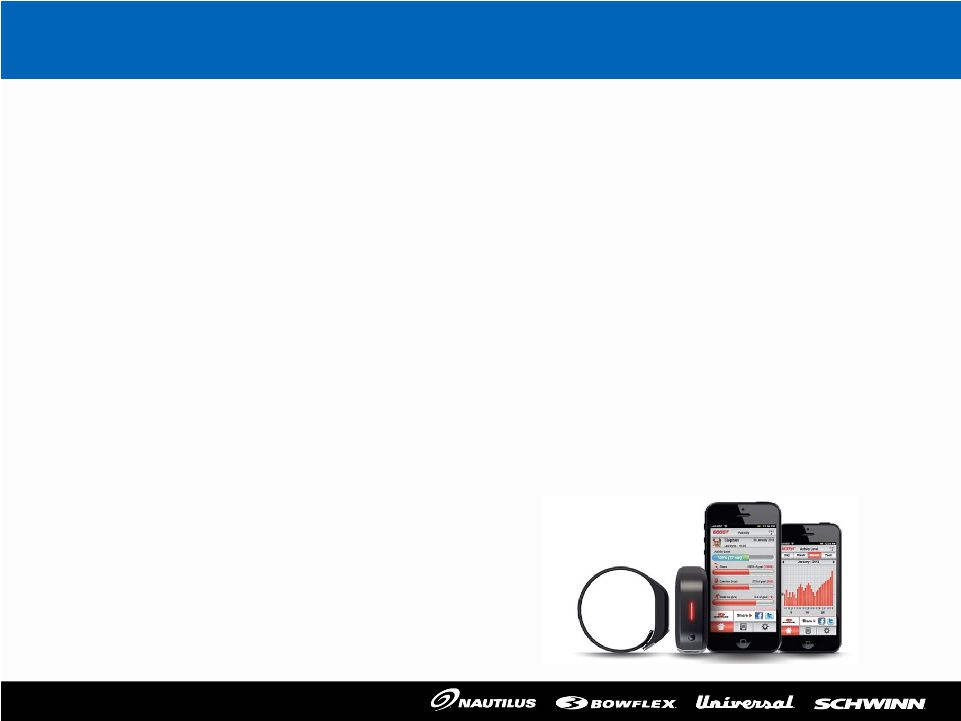
Bowflex Boost ™
UpperCut®
Schwinn®
Elliptical MY13
9 |
 Growing in all
Our Channels % of 2013
Revenue*
2013 Full
Year Gross
Margin*
Op-ex
Profile*
2013
Full
Year
Cont.
Margin**
Revenue
Growth
in 2013*
Direct to
Consumer
63%
59-61%
Higher
(due to
advertising)
10-11%
9%
Retail
35%
24-26%
Very Low
14-16%
20%
Licensing
Royalties
2%
~100%
Minimal
100%
6%
Plus…
Complementary business drivers across channels
* All Q4 2013 and full year 2013 financial information is preliminary and
unaudited; see preliminary earnings release dated January 13, 2014. ** Excluding
unallocated corporate expense. 10 |
 Our Six
Philosophies 1.
Focus on profitable growth while leveraging and tightly
controlling expenses
2.
Deliver a steady flow of consumer driven innovations
3.
Continue investing in our brands and new product launches
•
Longer term view
4.
Emphasis on high opportunity initiatives for maximum success
•
Carefully scrutinize deployment of resources
5.
Apply sense of urgency and intense focus on strategy and
execution
•
Achieve what we say we’re going to do
6.
Support and nurture our vibrant culture of organizational
excellence
Continue to drive positive shareholder return!
11 |
 Business
Strategies 12 |
 Key
Drivers •
Emphasis on new product development for both the Direct and
Retail channels; guided by a focus on consumer needs/wants
•
Utilize our unique multi-channel business model to gain share and
secure traction on new products
•
Diversify our product offering and geographic footprint
•
Utilize new marketing approaches to energize our brands and build
deeper customer relationships
Utilize combination of “core growth”
and “plus growth”
initiatives to strengthen core and extend our reach
13 |
 Growth
Opportunities •
Launch
New
Direct
to
Consumer
Products:
Lead
with
new
MAX
Trainer,
leverage
our
unique
market’s
capabilities
•
Large
Domestic
Retail
Market:
We
are
under-represented
but
well
poised
to
take
share
•
International
Market
Opportunity:
Where
we
are
almost
non-
existent
today,
but
our
brands
are
already
well-known
•
Expand
Licensing
Royalty
Base:
Utilize
both
IP
and
Brands
•
Tap
Into
Adjacent
Product
Categories:
That
are
growing
and
compliment
our
core
competencies
14 |
 Global Market
Opportunity *Compilation of Industry and Internal Data
15
Estimated Wholesale Retail Market Size by Region* |
 “The Road Map”
16
•New Price Points
•New Core Categories
•Plus Growth Opportunities
•Access to Broader Audience
•Licensing
•Process Rigor
•IP Portfolio
•Brand Engagement
•Margin Discipline
•Leverage Infrastructure
•Continuous Cost
Improvements •Supply Chain
Efficiency •Media
Planning Our approach to
profitable growth focuses
on three major areas: |
 Financial
Overview 17 |
 Revenue growing
at 9.1% CAGR* *All Q4 2013 and full year 2013 financial information is preliminary and
unaudited; see preliminary earnings release dated January 13, 2014. Note: Net Revenue
and Operating Income are for Continuing Operations. Consistent Revenue and Profitability
Growth 18 |
 Note: All Q4
and full year financial information is preliminary and unaudited; see preliminary earnings release January 13, 2014.
* Non-GAAP Information, see Nautilus’
website under “Investor Relations”
for a reconciliation to GAAP
* Net Revenue and EBITDA are rolling four quarter totals, Continuing Operations
EBITDA Outpacing Revenue Growth
19 |
 Strong Balance
Sheet •
Approximately $41M* of cash and no debt as of December
31, 2013
•
$31.6M of deferred net tax assets as of September 30, 2013
•
Working capital utilization metrics are best in the industry
•
Internal cash generation expected to finance growth plans
•
Modest capital expenditures of approximately $2 -
$3M per
year range expected
*All Q4 2013 and full year 2013 financial information is preliminary and unaudited; see
preliminary earnings release dated January 13, 2014. 20 |
 Longer Term
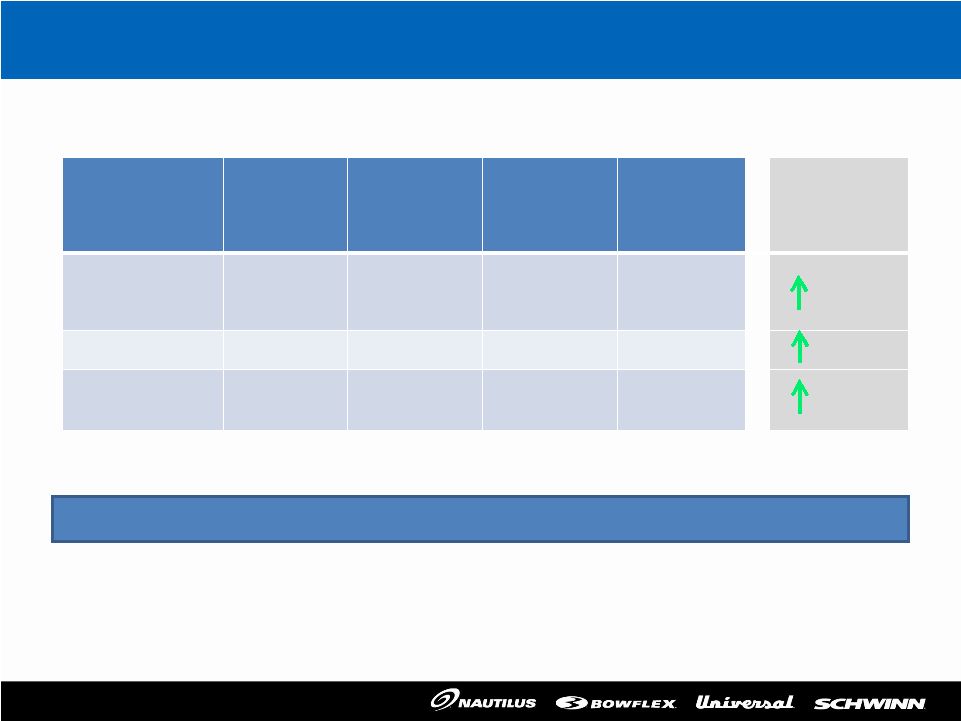
Expectations Stated Strategic Goal
Run Rate
2013 Preliminary
Results vs. 2012*
Revenue Growth
9-10% year
12.8% vs. 7.5% (L.Y.)
Gross Margin
Sustain gains in each
channel
2-4 point improvement in
both channels
Operating Expense
Leverage
1-3 points better
Expenses flat to up slightly
Operating Income
7-10% of revenue
Absolute dollars increasing
at double digit pace
7.0-7.2% vs. 5.5% (L.Y.)
45-49% growth
EBITDA Growth
Strong (outpacing revenue)
39-42% growth vs. 84% (L.Y.)
21
*All Q4 2013 and full year 2013 financial information is preliminary and unaudited; see
preliminary earnings release dated January 13, 2014. |
 Key Take
Aways Our company is achieving growth and significantly improved
profitability
Capabilities have been built to deliver long-term profitability
Strategic growth drivers and opportunities have been identified and
are being pursued
Strong asset position is unique and leverage-able
•
Brands, IP, balance sheet, business model, human capital
Our plan is solid and it is working
22 |
 23
|
Nautilus, Inc.
Reconciliation of Non-GAAP Financial Measure
Earnings Before Interest, Taxes, Depreciation and Amortization (EBITDA)
Management considers EBITDA, a non-GAAP financial measure, to be useful for investors in evaluating our operating performance. We calculate EBITDA by adding income from continuing operations, plus (i) interest expense net of interest income, (ii) income tax expense and (iii) depreciation and amortization. A reconciliation of EBITDA to income from continuing operations is as follows (in millions).
| 2010 | 2011 | 2012 | 2013(2) | |||||||||||||
| Income (loss) from continuing operations(1) |
$ | (9.8 | ) | $ | 2.5 | $ | 10.6 | $ | 47.7-48.3 | |||||||
| Interest expense (income), net |
0.1 | 0.4 | (0.1 | ) | 0.0 | |||||||||||
| Income tax expense (benefit) of continuing operations |
0.6 | 0.7 | (0.2 | ) | (32.0)-(32.3 | ) | ||||||||||
| Depreciation and amortization |
6.6 | 3.8 | 3.3 | 3.3 | ||||||||||||
| EBITDA from continuing operations |
$ | (2.5 | ) | $ | 7.4 | $ | 13.7 | (3) | $ | 19.0-19.4 | (3) | |||||
| (1) | Management does not include the results of discontinued operation in its calculation of EBITDA and, therefore, EBITDA was not reconciled to net income including discontinued operation. |
| (2) | Full year 2013 financial information is preliminary and unaudited. |
| (3) | May not add due to rounding. |
Nautilus, Inc.
Reconciliation of Non-GAAP Financial Measure
Net Income and Earnings Per Diluted Share Excluding a Partial Reversal of a
Valuation Allowance
Nautilus presents adjusted net income and earnings per diluted share results because management believes that due to the non-recurring nature of the partial reversal of a valuation allowance recorded against the Company’s deferred tax assets resulting in an income tax benefit, including the non-GAAP results assists investors in assessing the Company’s operational performance relative to its competitors and its historical financial performance.
Continuing Operations Income and Diluted EPS (as reported and excluding non-recurring items) (unaudited and in millions, except per share amounts):
| Three Months Ended December 31, 2013 | ||||||||||||
| Prelim Results (est range) (1) |
Less non- recurring items(2) |
Excluding non- (est range) |
||||||||||
| Income from continuing operations |
$ | 8.0-8.6 | $ | (1.1 | ) | $ | 9.1-9.7 | |||||
| Diluted net income per share |
$ | 0.25-0.27 | $ | (0.04 | ) | $ | 0.29-0.31 | |||||
| Twelve Months Ended December 31, 2013 | ||||||||||||
| Prelim Results (est range) (1) |
Less non- recurring items(2) |
Excluding non- (est range)(3) |
||||||||||
| Income from continuing operations |
$ | 47.7-48.3 | $ | 33.0 | $ | 14.6-15.2 | ||||||
| Diluted net income per share |
$ | 1.52-1.54 | $ | 1.05 | $ | 0.46-0.48 | ||||||
| (1) | Full year and fourth quarter 2013 financial information is preliminary and unaudited. |
| (2) | Such items were offset by the after-tax impact of an income tax benefit (expense) related to a partial reversal of a valuation allowance recorded against the Company’s deferred tax assets. |
| (3) | May not add due to rounding. |
